In the fast-moving construction and real estate industries, tracking performance is not just helpful—it’s vital. Whether you’re managing multiple sites, overseeing contractors, or controlling budgets, having real-time visibility into key metrics can transform how you operate.
That’s where the Construction and Real Estate Performance KPI Dashboard in Excel comes in. This powerful tool allows managers, engineers, and real estate professionals to monitor KPIs, analyze trends, and make strategic decisions without the need for complicated software.
In this article, we’ll walk you through everything—from features and advantages to best practices and frequently asked questions. Let’s get started!
Click to Purchases Construction and Real Estate Performance KPI Dashboard in Excel
What Is the Construction and Real Estate Performance KPI Dashboard in Excel?
The Construction and Real Estate KPI Dashboard is a ready-to-use Excel-based tool that tracks performance metrics across construction and property projects. It enables users to input monthly data, set performance targets, and compare against previous year benchmarks—all in one centralized location.
Designed for both beginners and professionals, this dashboard offers a clear, visual summary of your operations using drop-down selectors, conditional formatting, and dynamic charts.
Key Features of the Dashboard
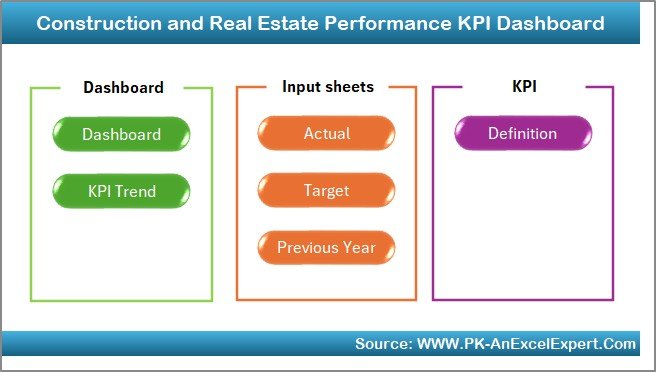
The dashboard includes 7 well-organized worksheet tabs, each with a specific purpose. Let’s explore them:
Home Sheet
-
Works like a navigation panel
-
Includes buttons linked to other sheets
-
Easy access to Dashboard, KPI Trends, Input sheets, and more
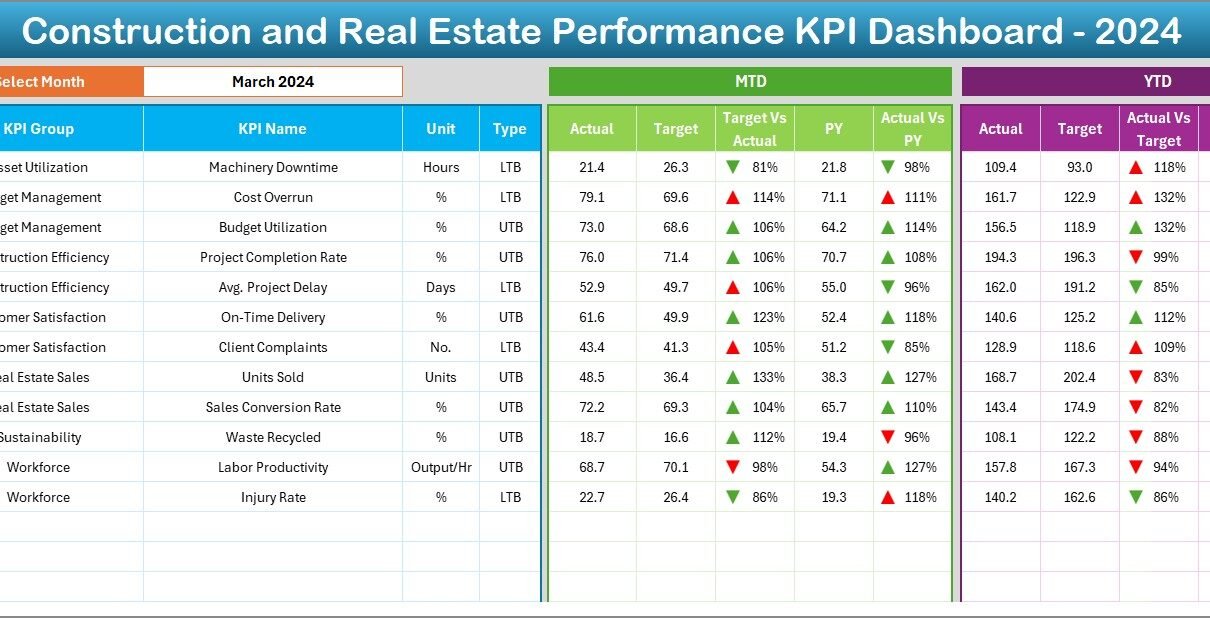
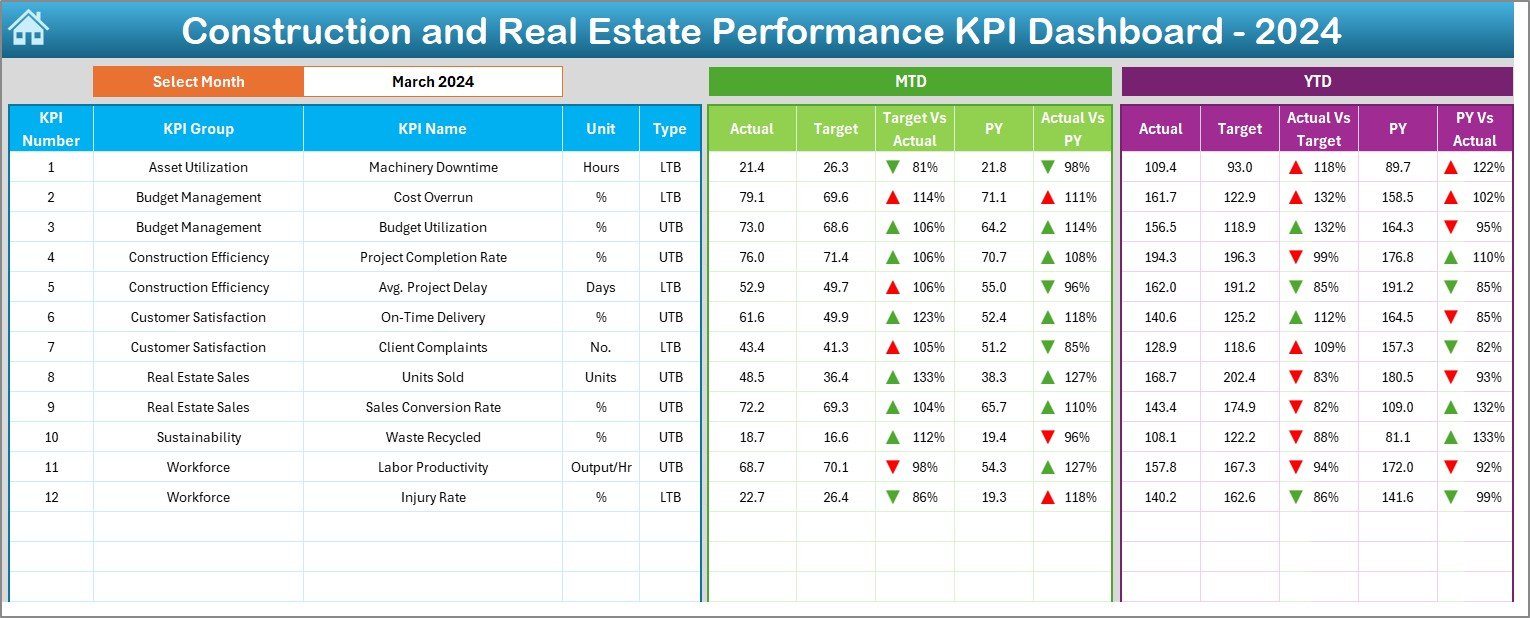
Dashboard Sheet Tab
-
Core page for monthly performance review
-
Select Month from cell
D3to update visuals dynamically
Displays MTD (Month-To-Date) and YTD (Year-To-Date) values for:
- Actual
- Target
- Previous Year
-
Includes Target vs Actual and PY vs Actual comparisons with up/down arrows
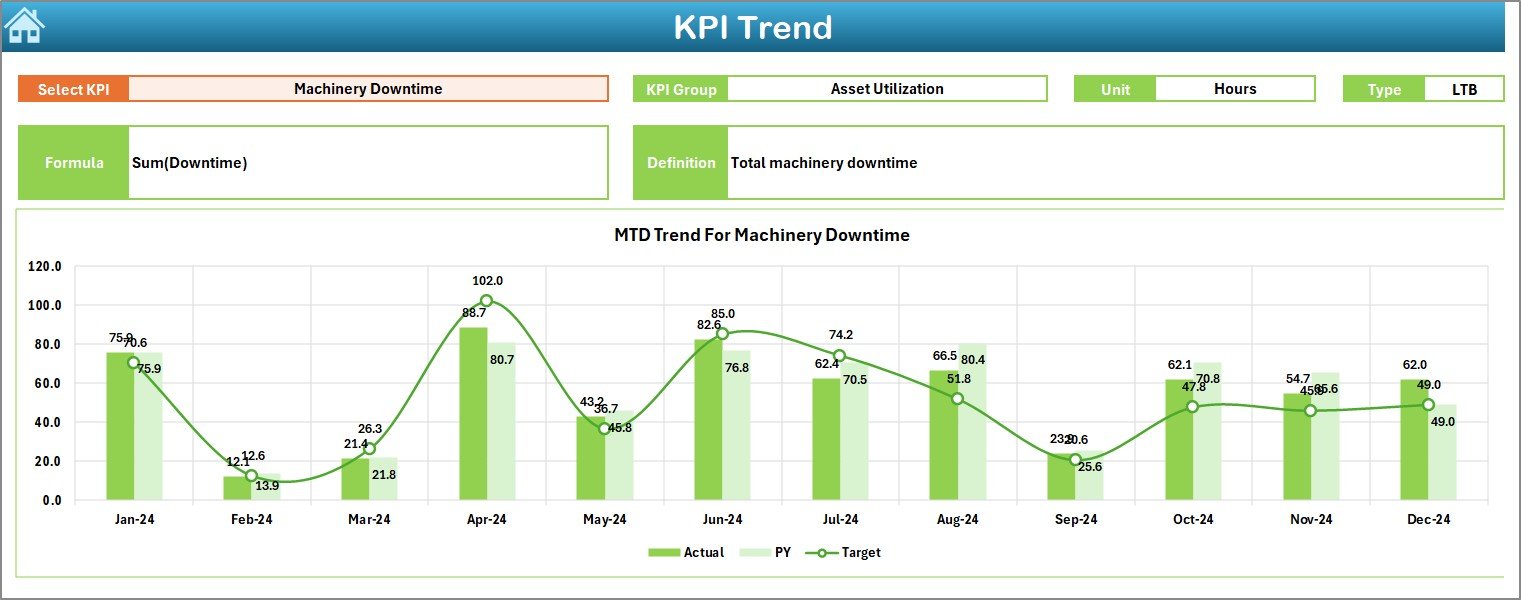
KPI Trend Sheet Tab
-
Choose KPI from
C3dropdown
View:
- KPI Group
- Unit
- Type (UTB or LTB)
- Formula
- Definition
-
Charts for MTD and YTD performance trends
Actual Numbers Input Sheet
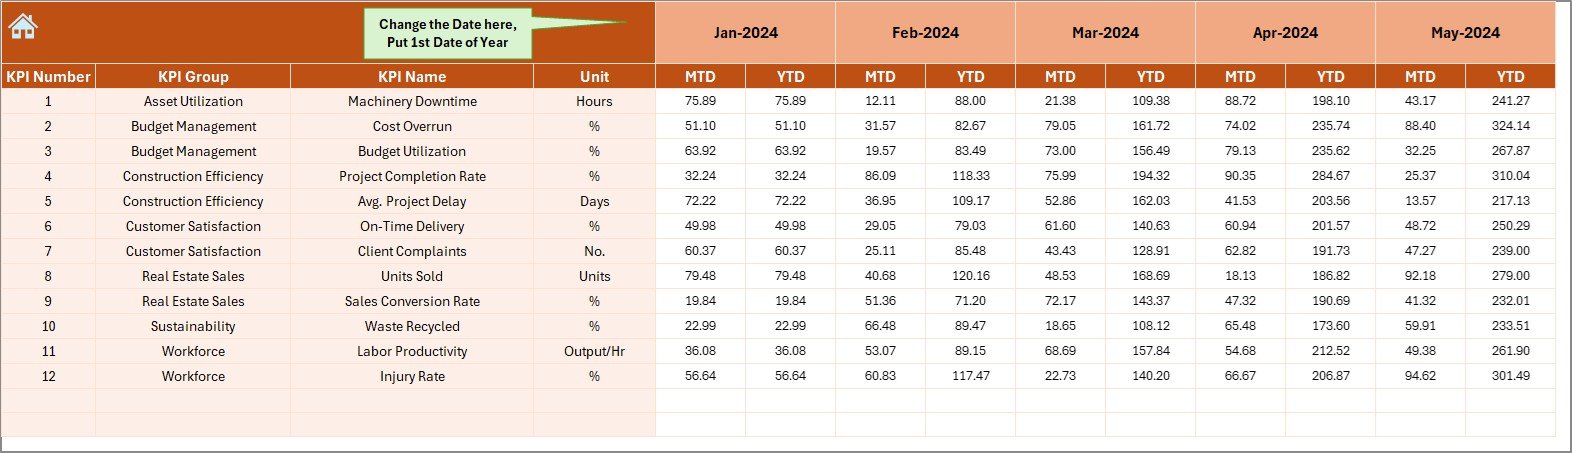
-
Input monthly actuals for both MTD and YTD
-
E1allows you to set the starting month of the year -
Auto-updates charts across other sheets
Target Sheet Tab
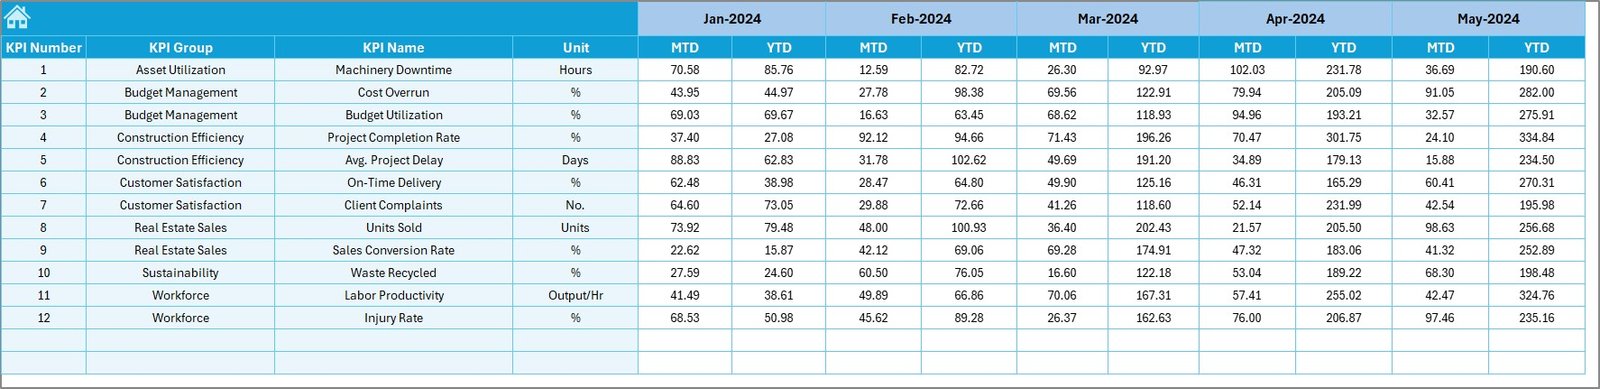
-
Define monthly MTD and YTD targets
-
Helps track alignment with annual goals
Previous Year Number Sheet
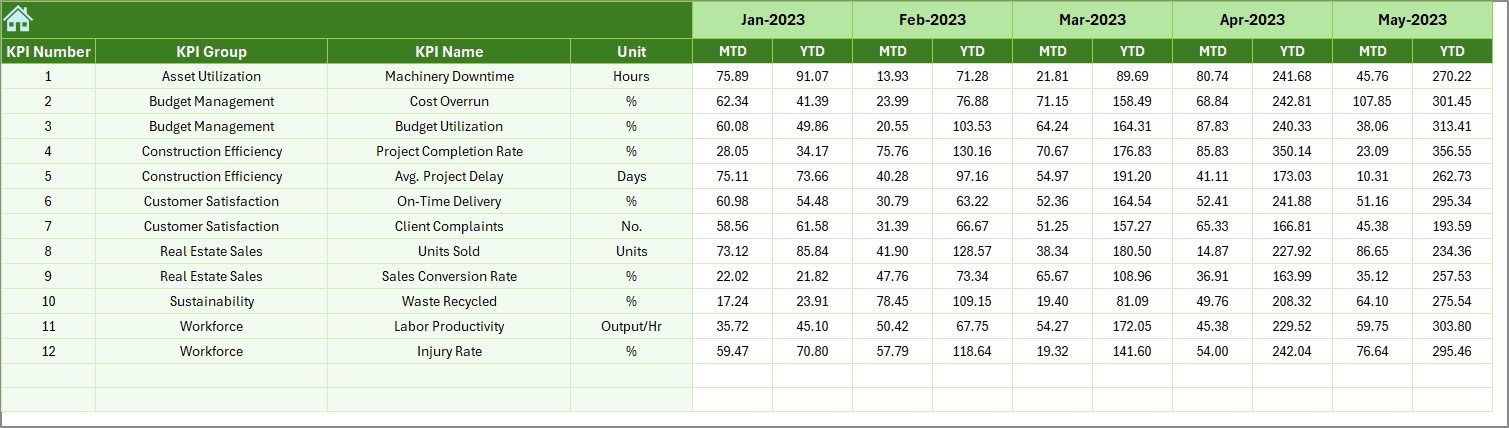
-
Enter the prior year’s monthly MTD and YTD values
-
Enables historical benchmarking
KPI Definition Sheet
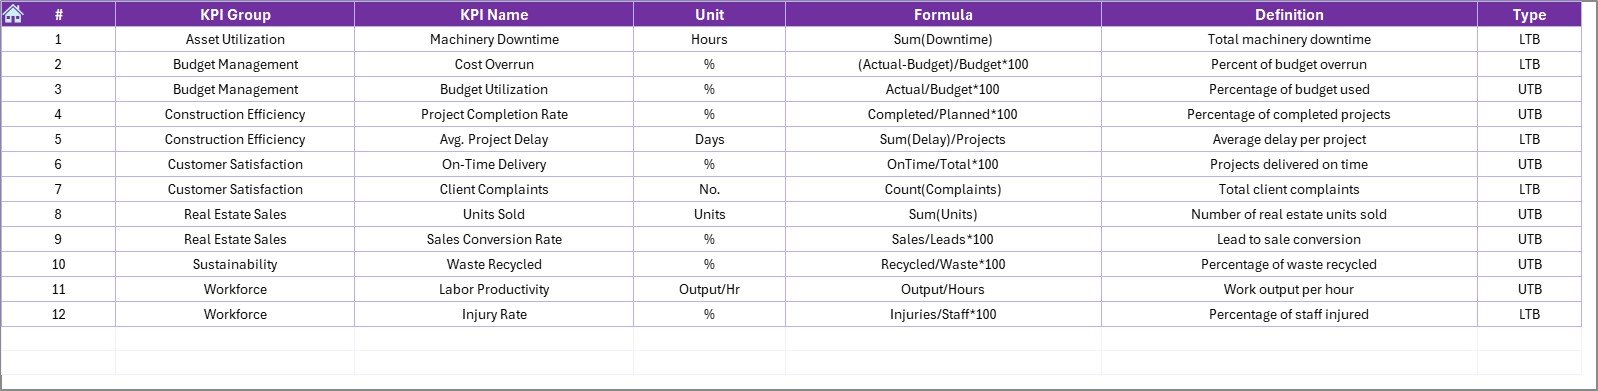
-
Maintain a reference library of KPIs
Includes:
- KPI Name
- Group
- Unit
- Formula
- Brief Definition
Advantages of Using a KPI Dashboard in Construction and Real Estate
Click to Purchases Construction and Real Estate Performance KPI Dashboard in Excel
Why should your construction or property business rely on an Excel KPI dashboard? Here’s why:
📌 Centralized Data Management
-
All KPI metrics are accessible in one file
-
No need to switch between multiple tools
📌 Easy Customization
-
Add or remove KPIs as needed
-
Update targets, actuals, and formulas with no coding
📌 Cost-Effective Solution
-
Built in Microsoft Excel—no extra software cost
-
Ideal for small to mid-sized businesses
📌 Performance Transparency
-
MTD and YTD tracking helps spot trends early
-
Highlights gaps between actual and targets
📌 Informed Decision-Making
-
Use trend charts to make data-driven project decisions
-
Quickly assess if a KPI is improving or declining
Typical KPIs to Track in the Dashboard
While you can customize the dashboard to suit your needs, here are some common KPIs used in construction and real estate:
-
Project Completion Rate (%)
-
Budget Variance (INR / USD)
-
Safety Incidents (#)
-
Client Satisfaction Score
-
Material Waste (%)
-
Equipment Utilization (%)
-
Revenue Per Project
-
Employee Productivity
-
Inspection Pass Rate (%)
-
Cost Per Square Foot
-
Contractor Delay Hours
-
Energy Efficiency Ratio
Each KPI comes with a clear definition, formula, and unit of measure to ensure consistency across reporting.
How to Use the Dashboard Effectively
Follow these steps to start tracking performance efficiently:
Step 1: Enter Actual Values
-
Go to the Actual Numbers Input sheet
-
Set your starting month in cell
E1 -
Fill in MTD and YTD values for each KPI
Step 2: Set Targets
-
Open the Target sheet tab
-
Define monthly goals for each KPI
Step 3: Enter Historical Data
-
Fill the Previous Year sheet with past MTD and YTD values
Step 4: View Trends
-
Navigate to the KPI Trend sheet
-
Select a KPI and analyze how it’s trending
Step 5: Review the Dashboard
-
On the Dashboard tab, select a month from
D3 -
Review all KPIs with color-coded arrows and conditional formatting
Best Practices for the Construction and Real Estate KPI Dashboard
Maximize your insights by following these best practices:
✔️ Keep Your KPI List Focused
Only include KPIs that align with your project or strategic goals.
✔️ Update Data Monthly
Keep actuals and targets current for accurate comparisons.
✔️ Use Conditional Formatting
Highlight poor-performing KPIs with red or downward arrows.
✔️ Review Trends, Not Just Values
MTD and YTD trends reveal if improvements are sustained.
✔️ Backup Data Regularly
Avoid losing valuable data by saving backups monthly.
✔️ Train Team Members
Ensure your staff understands how to input data and interpret visuals.
Transitioning from Manual Reports to a Dashboard
If you’ve relied on manual reporting, switching to a structured dashboard may seem challenging. But it doesn’t have to be.
Start small. Use just 5 KPIs in the first month. Once you’re confident, expand gradually. The Excel template supports unlimited KPIs, so you can scale over time.
Real-World Use Case Example
Scenario:
A real estate firm tracks 10 projects monthly. They want to monitor budget variance, project progress, and safety incidents.
Solution:
They implement the KPI dashboard and assign team members to update actual values weekly. Managers check MTD vs. Target every month and take corrective actions immediately.
Outcome:
In 3 months, they reduce project delays by 18%, and their average safety incident rate drops by 30%.
Why Excel Is Still a Great Tool for KPI Dashboards
You might wonder, “Why not use Power BI or Tableau?”
Here’s why Excel is still powerful:
-
✅ Widely available and understood
-
✅ No extra training needed
-
✅ Perfect for mid-sized teams
-
✅ Highly customizable with formulas and VBA
-
✅ Can integrate with Power BI for advanced visuals later
What Makes This Dashboard Template Stand Out?
-
Pre-built formulas and slicers
-
MTD & YTD performance cards
-
Up/down arrows for instant insights
-
Drop-downs for KPI and Month selection
-
Designed for non-technical users
-
Easily adaptable across industries (Construction, Real Estate, Infrastructure)
Conclusion
The Construction and Real Estate Performance KPI Dashboard in Excel empowers businesses to make informed, real-time decisions. Whether you’re tracking construction timelines, costs, or safety metrics, this dashboard gives you a complete view of your operations—on one screen.
Its simple design, dynamic charts, and intuitive layout make it the perfect fit for project managers, real estate developers, and consultants who want a no-code solution that delivers results.
So, don’t just track your projects—transform them.
Frequently Asked Questions (FAQs)
1. What are KPIs in construction and real estate?
KPIs (Key Performance Indicators) are measurable values that indicate how well your construction or real estate project is performing in key areas like budget, safety, and timelines.
2. Can I add more KPIs to this Excel dashboard?
Yes! The dashboard is fully customizable. Just update the KPI Definition, Actual, Target, and Previous Year sheets to include your new metrics.
3. Is this dashboard suitable for small construction firms?
Absolutely. It’s built in Excel, so even small businesses can use it without extra costs or software.
4. How do I track trends in the dashboard?
Go to the KPI Trend sheet and select the KPI from the drop-down. You’ll see line charts for MTD and YTD performance against Target and PY.
5. Can this be used for real estate portfolio management?
Yes, the dashboard works perfectly for managing real estate KPIs such as cost per square foot, occupancy rates, rental income, and ROI.
6. Do I need VBA knowledge to use this tool?
No VBA knowledge is required. All navigation and charts work using Excel formulas and buttons.
7. What if I want to track weekly data instead of monthly?
You can modify the structure to accommodate weekly tracking. However, the current version is optimized for monthly updates.
8. How often should I update the dashboard?
Ideally, update the dashboard at the end of each month to keep it current and relevant for performance reviews.
9. What types of charts are used in the dashboard?
The dashboard uses line charts, bar graphs, and conditional formatting arrows to visualize trends and performance comparisons.
10. Is there any training required to use this dashboard?
Not really. If your team is familiar with Excel basics, they can start using the dashboard immediately. A short 15-minute walkthrough is usually sufficient.
Visit our YouTube channel to learn step-by-step video tutorials