In the fast-paced world of fashion retail, staying ahead of performance metrics is essential to success. From tracking monthly sales targets to monitoring year-on-year growth and operational efficiency, retailers need more than spreadsheets and manual calculations. That’s where the Fashion Retail KPI Dashboard in Power BI comes in. It provides a visual, interactive, and intelligent way to track key performance indicators (KPIs), spot trends, and make informed decisions.
This article walks you through the key components, features, benefits, and best practices of using the Fashion Retail KPI Dashboard in Power BI. We’ll also address frequently asked questions to ensure you understand how to implement and optimize this tool in your retail business.
Click to Purchases Fashion Retail KPI Dashboard in Power BI
What is the Fashion Retail KPI Dashboard in Power BI?
The Fashion Retail KPI Dashboard in Power BI is a ready-to-use business intelligence tool that captures and visualizes retail performance data from an Excel data source. It consolidates critical KPIs into a user-friendly interface, enabling retail professionals to monitor performance at both granular and strategic levels.
Whether you are a store manager, regional director, or business analyst, this dashboard offers the insights needed to track monthly and yearly trends, evaluate target achievements, and identify areas of concern.
Key Features of the Fashion Retail KPI Dashboard
The dashboard comprises three interactive pages in the Power BI desktop application:
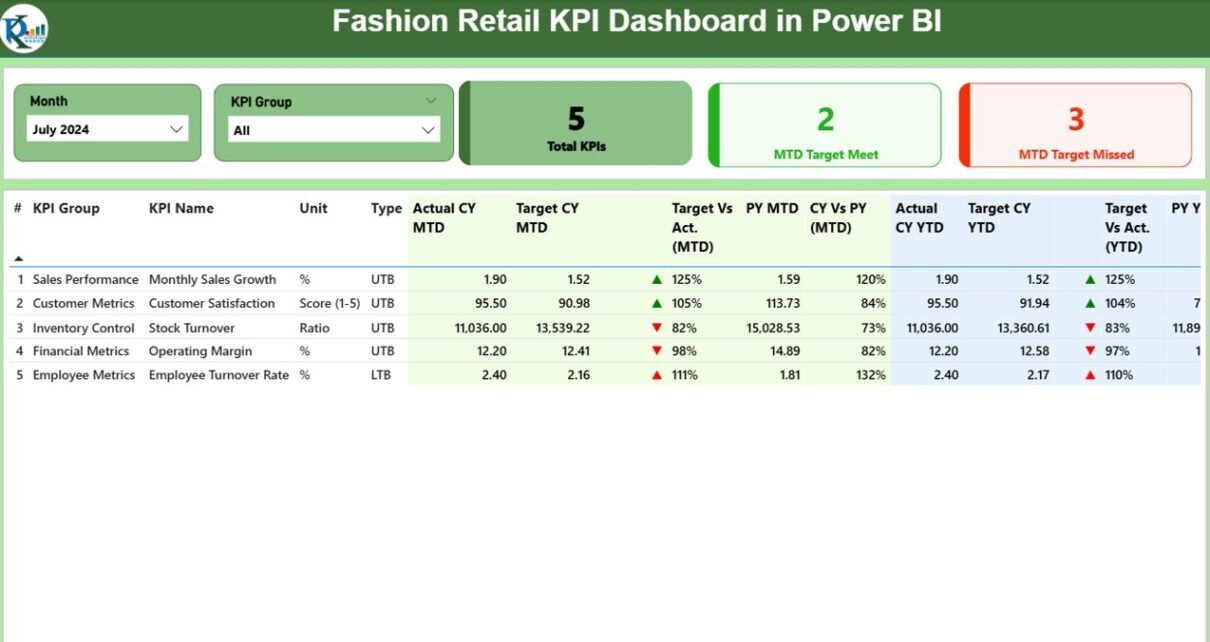
Summary Page
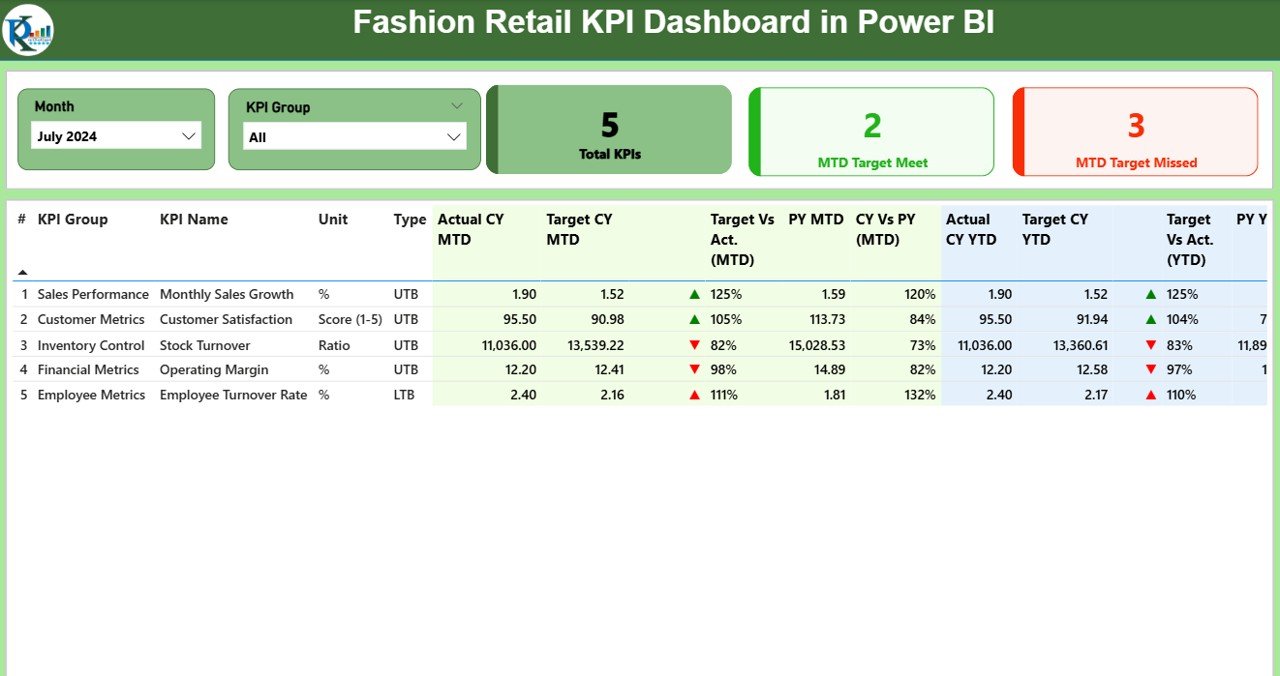
This is the primary view of the dashboard where users can:
- Use Month and KPI Group slicers to filter data dynamically.
View summary cards showing:
- Total KPI Count
- MTD Target Met Count
- MTD Target Missed Count
Analyze a detailed KPI table with these columns:
- KPI Number: Unique identifier for each KPI
- KPI Group: KPI Category (e.g., Sales, Inventory, Customer Experience)
- KPI Name: The actual name of the performance metric
- Unit: Measurement unit (e.g., %, Units, USD)
- Type: LTB (Lower the Better) or UTB (Upper the Better)
- Actual CY MTD: Current Year Month-To-Date actual value
- Target CY MTD: Current Year MTD target
- MTD Icon: Green ▲ or Red ▼ to show status
- Target vs Actual (MTD): Percentage = Actual / Target
- PY MTD: Previous Year MTD value
- CY vs PY (MTD): Comparison percentage = CY MTD / PY MTD
- Actual CY YTD: Year-To-Date actual
- Target CY YTD: YTD target
- YTD Icon: Green ▲ or Red ▼ to show status
- Target vs Actual (YTD): YTD comparison = Actual / Target
- PY YTD: Previous Year YTD
- CY vs PY (YTD): CY YTD / PY YTD
KPI Trend Page
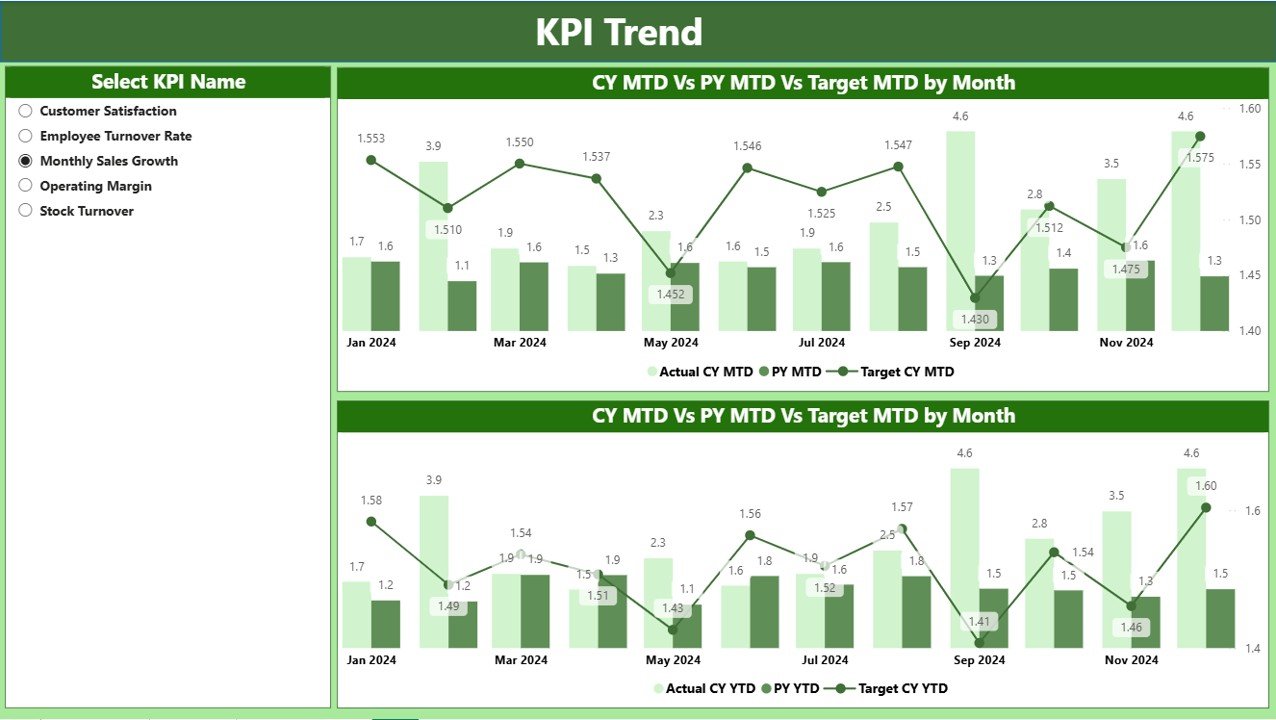
This page displays two combo charts showing:
- Actual numbers for the Current Year (CY), Previous Year (PY), and Targets
- Separate views for MTD and YTD data
- A KPI slicer on the left allows users to select specific KPIs
This page helps to visualize trends over time and spot performance gaps easily.
KPI Definition Page (Drill-through Page)
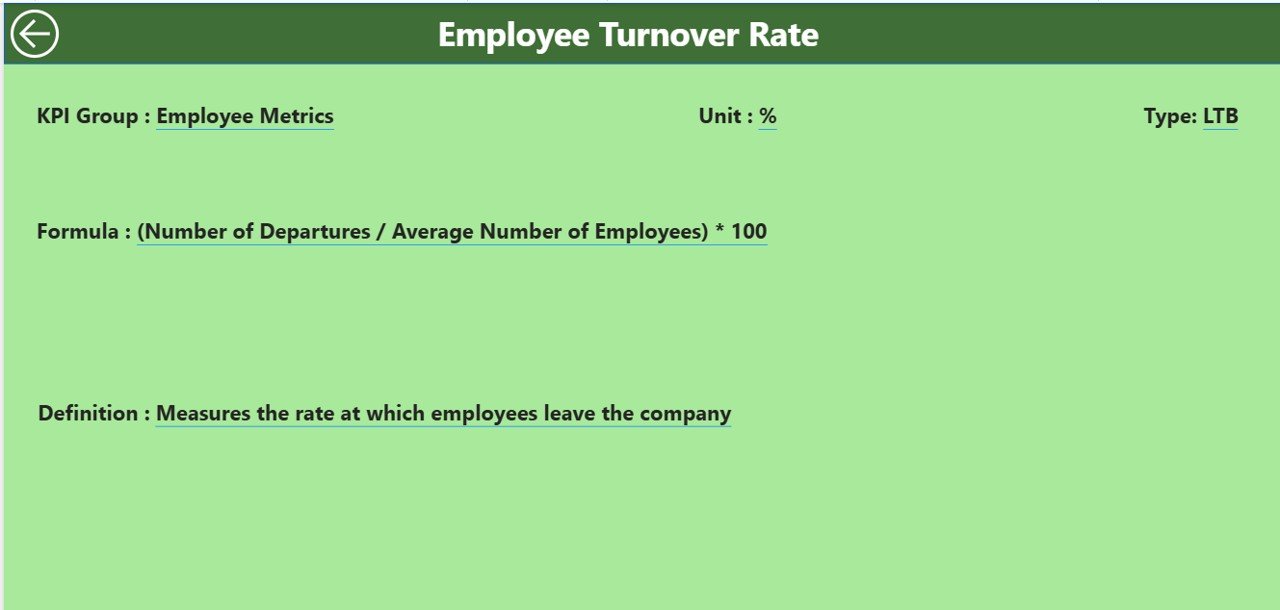
- This hidden page contains detailed information on each KPI.
Users can right-click on any KPI in the summary table and drill through to view:
- KPI Formula
- KPI Definition
- To return, click the Back button in the top-left corner.
Click to Purchases Fashion Retail KPI Dashboard in Power BI
Excel-Based Data Source
The Power BI dashboard connects to an Excel file that includes three essential worksheet tabs:
1. Input_Actual Sheet
- Columns: KPI Name, Month (first date of the month), MTD, and YTD actual numbers
2. Input_Target Sheet
- Columns: KPI Name, Month (first date of the month), MTD, and YTD target numbers
3. KPI Definition Sheet
- Columns: KPI Number, KPI Group, KPI Name, Unit, Formula, Definition, Type (LTB/UTB)
This format ensures seamless integration with Power BI and allows easy updates.
Why Use a Fashion Retail KPI Dashboard?
Tracking KPIs in the retail fashion sector can be complex. You deal with multiple categories, stores, seasons, and customer segments. This dashboard helps simplify and optimize performance monitoring.
Common KPIs Tracked
- Sales Revenue
- Gross Margin %
- Inventory Turnover
- Customer Return Rate
- Average Transaction Value (ATV)
- Conversion Rate
- Sell-Through %
- Online vs In-store Sales Split
Advantages of Fashion Retail KPI Dashboard in Power BI
Here are the major benefits of adopting this dashboard:
🔢 Centralized Data Access: Integrate and view all KPIs in one place.
🌐 Interactive Visuals: Drill through charts, slicers, and icons simplify data exploration.
🌟 MTD & YTD Insights: Quickly compare month-to-date and year-to-date numbers.
🔄 Historical Comparisons: Evaluate progress against past performance.
⏳ Time-Saving: Eliminate manual report generation.
📈 Performance Monitoring: Instantly spot which KPIs are on track and which need attention.
📋 Excel Integration: Easy data entry and flexibility with Excel inputs.
Opportunities for Improvement
Even the best dashboards need periodic tuning. Consider these areas to enhance performance:
- ✏️ Automate Data Refresh: Use scheduled refresh for real-time data.
- 🔄 Include Forecasting Models: Add linear regression or moving average charts.
- 🔢 Expand KPI Groups: Include Marketing, Staffing, and Supplier KPIs.
- 🔀 Responsive Layout: Optimize visuals for mobile/tablet viewing.
- ⚖️ Benchmarking Options: Compare performance against industry standards.
Best Practices for Fashion Retail KPI Dashboard
To make the most of your dashboard, follow these actionable best practices:
- 📅 Update Monthly: Ensure Actual and Target data are current.
- ✅ Use Clear KPI Names: Avoid vague or unclear metrics.
- 🔗 Maintain Consistency: Keep formatting, date ranges, and units uniform.
- ⬆️ Prioritize High-Impact KPIs: Focus on metrics that influence revenue and customer satisfaction.
- 📃 Train Users: Conduct short training sessions to help teams use the dashboard effectively.
- 💡 Highlight Trends: Use conditional formatting or icons to visualize upward/downward trends.
How to Get Started with the Dashboard
Here is a simple step-by-step process:
📁 Download the Power BI file and Excel template
🔍 Open the Excel template and input actual, target, and KPI definition data
📈 Open the Power BI file, refresh data connections
✅ Explore the dashboard: Use slicers, view cards, analyze tables
📊 Drill through for insights: Right-click to view KPI definitions
Real-World Use Cases
- Retail Chain Performance: Compare performance across store locations
- Seasonal Sales Tracking: Monitor festive season sales vs targets
- Inventory Efficiency: Track sell-through and inventory turnover
- E-commerce vs Brick-and-Mortar: Compare digital vs physical store KPIs
Conclusion
The Fashion Retail KPI Dashboard in Power BI gives fashion brands the edge to make faster, smarter decisions. From tracking daily metrics to analyzing long-term trends, this tool converts raw data into actionable intelligence.
With its Excel integration, interactive visuals, and KPI-rich insights, it’s the perfect solution for retail managers who want to elevate their data strategy.
Frequently Asked Questions (FAQs)
Q1. What software do I need to use this dashboard?
You need Microsoft Power BI Desktop and Microsoft Excel.
Q2. Can I customize the KPIs?
Yes. You can add or modify KPIs in the Excel definition sheet.
Q3. Is this dashboard suitable for small retail businesses?
Absolutely. It works for both small boutiques and large retail chains.
Q4. How often should I update the data?
You should update the Excel sheets monthly to maintain accuracy.
Q5. What does LTB and UTB mean?
- LTB (Lower the Better): Lower values indicate better performance (e.g., Return Rate).
- UTB (Upper the Better): Higher values indicate better performance (e.g., Sales).
Q6. Can I view data for previous years?
Yes. The dashboard includes fields for both current and previous year comparisons.
Click to Purchases Fashion Retail KPI Dashboard in Power BI
Visit our YouTube channel to learn step-by-step video tutorials