In today’s fast-moving digital world, cybersecurity threats have become a major concern for every organization — large or small. With a growing number of cyberattacks, ransomware incidents, phishing schemes, and data breaches, businesses need strong systems to monitor and manage security events effectively.
That’s where the Cybersecurity Dashboard in Excel comes in.
This powerful, ready-to-use template provides a clear, visual, and data-driven way to track, analyze, and report cybersecurity performance metrics — all within the familiar and flexible environment of Microsoft Excel.
This article explores everything you need to know about the Cybersecurity Dashboard in Excel — its key features, advantages, design structure, analytical capabilities, and best practices to get the most out of it.
Click to Purchases Cybersecurity Dashboard in Excel
What Is a Cybersecurity Dashboard in Excel?
A Cybersecurity Dashboard in Excel is a comprehensive visual tool designed to monitor an organization’s cybersecurity posture. It compiles key metrics such as incident severity, resolution rate, financial impact, and risk score into interactive visuals and charts.
With it, cybersecurity managers and IT teams can instantly see where risks are rising, which departments face higher vulnerability, and how effectively incidents are being resolved.
Unlike complex BI tools that require licensing or technical expertise, this Excel-based dashboard gives you full control over your data — without needing coding, macros, or external software. It’s efficient, easy to use, and suitable for any business size.
Why Is Cybersecurity Monitoring Important?
Before exploring the dashboard’s features, let’s understand why cybersecurity monitoring is essential:
⚡ Rising Threats: Cyberattacks are increasing in both frequency and complexity.
🧩 Data Protection: Organizations must protect customer, employee, and financial data from leaks.
💰 Financial Losses: Cyber incidents often cause significant revenue and productivity losses.
📊 Regulatory Compliance: Laws like GDPR, HIPAA, and ISO 27001 require continuous security monitoring.
🔒 Reputation Management: A single breach can permanently damage customer trust.
A cybersecurity dashboard helps organizations stay ahead of these risks through real-time tracking and analysis.
Key Features of the Cybersecurity Dashboard in Excel
The Cybersecurity Dashboard in Excel is built with five analytical pages — each designed to provide specific insights. Let’s look at each one in detail.
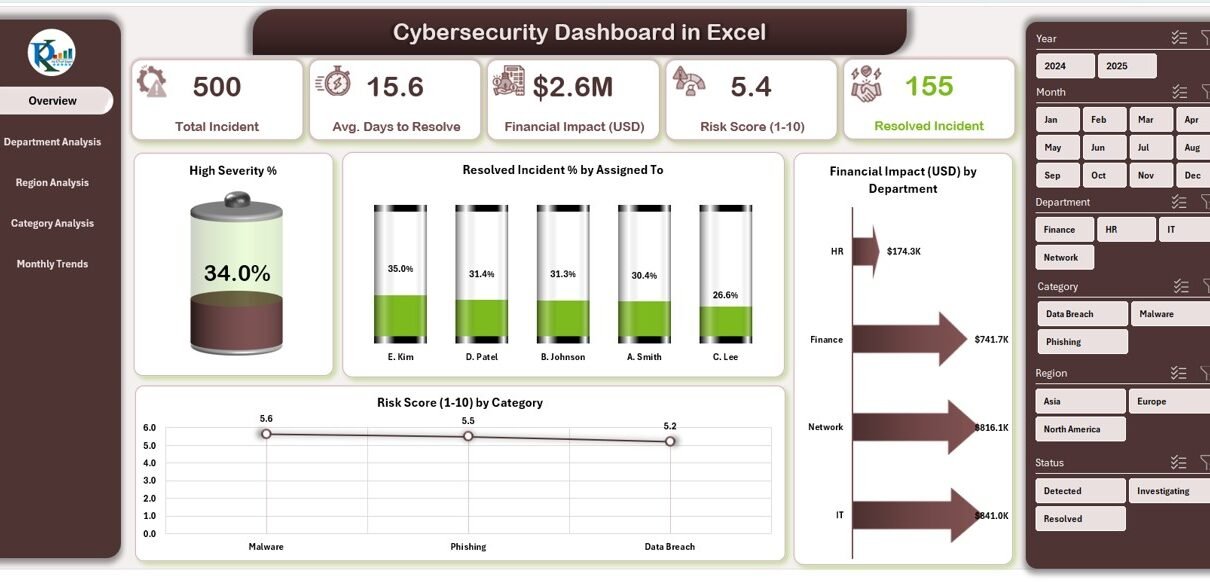
Overview Page
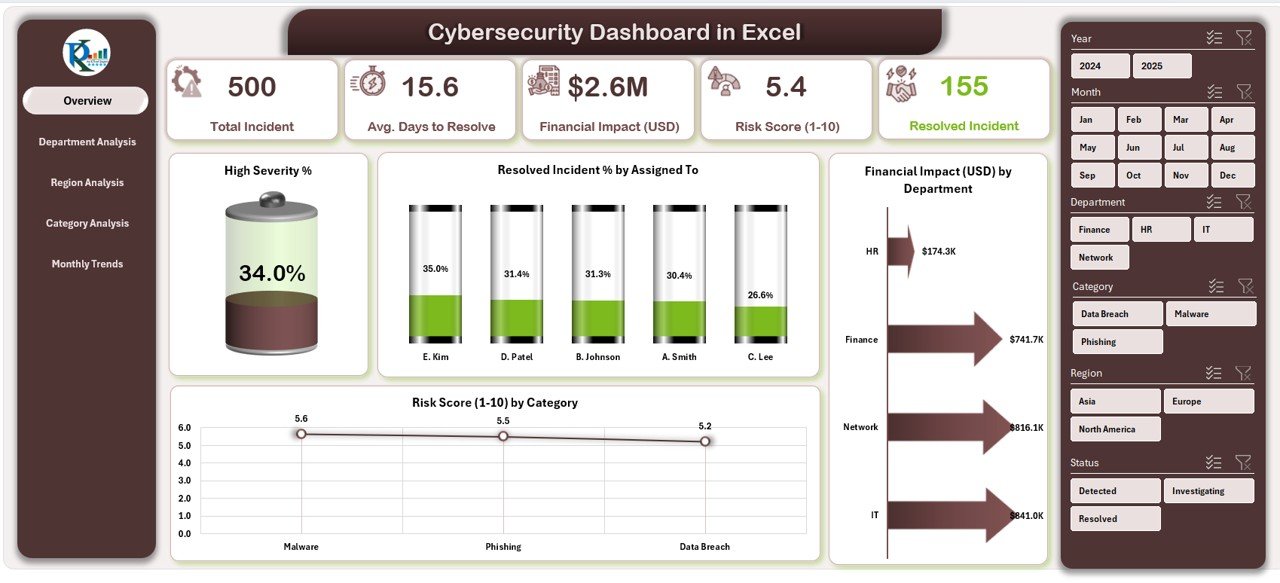
The Overview Page acts as the central hub of the dashboard.
Main Highlights:
-
📍 Page Navigator: Located on the left side, the navigator allows quick movement between pages.
-
💡 Key Metrics: The top section features five summary cards that show high-level KPIs such as total incidents, resolved percentage, financial losses, average resolution time, and overall risk score.
📊 Visual Insights: Four main charts present:
- High Severity %
- Resolved Incident % by Assigned To
- Financial Impact (USD) by Department
- Risk Score (1–10) by Category
These visuals allow management to identify problem areas and measure team efficiency instantly.
Department Analysis
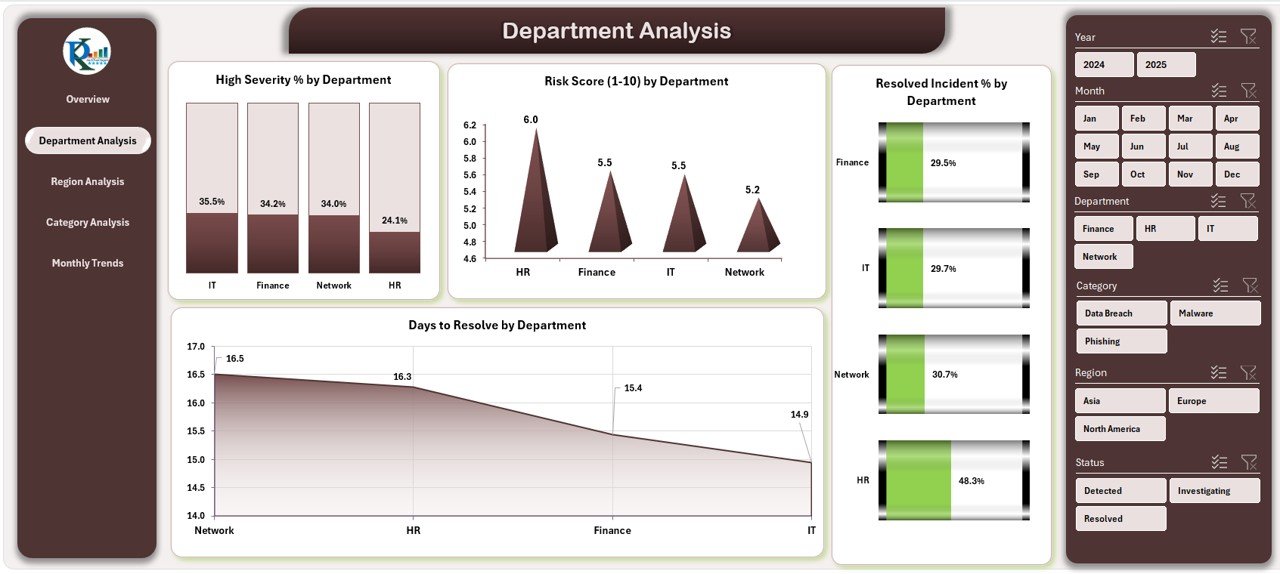
The Department Analysis Page gives a detailed view of cybersecurity performance across different departments.
What You’ll Find Here:
📈 Charts Included:
- High Severity % by Department
- Risk Score (1–10) by Department
- Resolved Incident % by Department
- Days to Resolve by Department
-
🎯 Purpose: Helps leaders identify departments with the highest risks or longest resolution times.
-
🔁 Slicers on Right Side: These dynamic filters make it easy to focus on specific departments, timelines, or risk types.
This view ensures accountability and enables focused mitigation actions.
Region Analysis
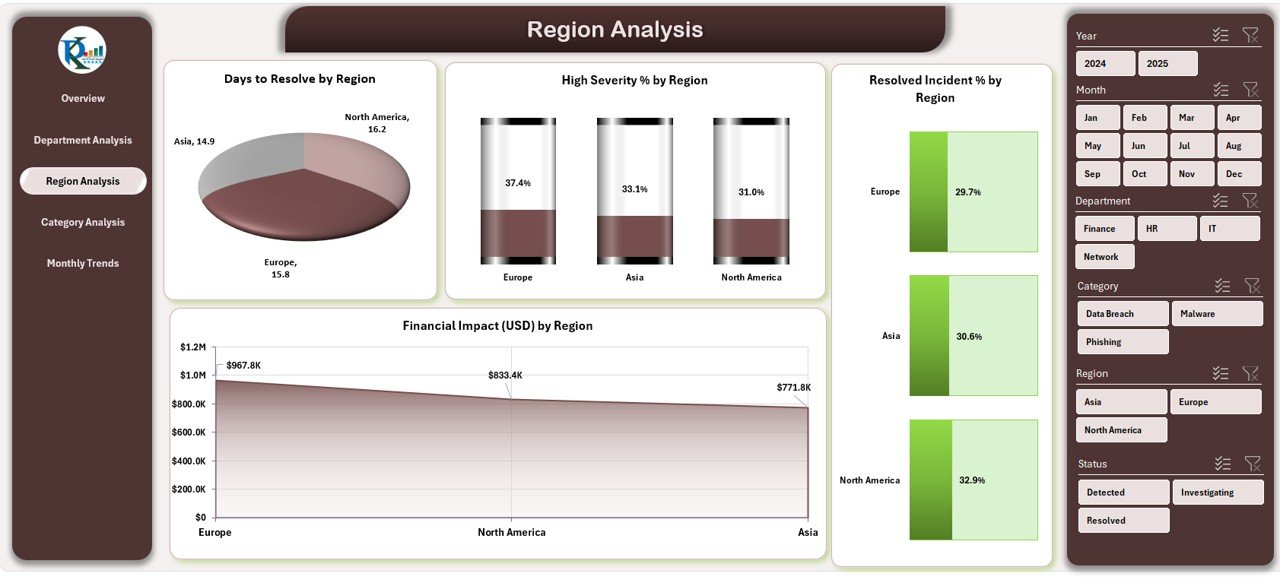
Cyber threats vary across regions due to infrastructure, compliance, and user behavior differences.
The Region Analysis Page visualizes:
-
Days to Resolve by Region
-
High Severity % by Region
-
Resolved Incident % by Region
-
Financial Impact (USD) by Region
Benefits:
-
Compare performance among different locations.
-
Understand regional risk concentration.
-
Optimize training or resources where needed most.
The slicers allow easy filtering to isolate performance metrics for each region.
Click to Purchases Cybersecurity Dashboard in Excel
Category Analysis
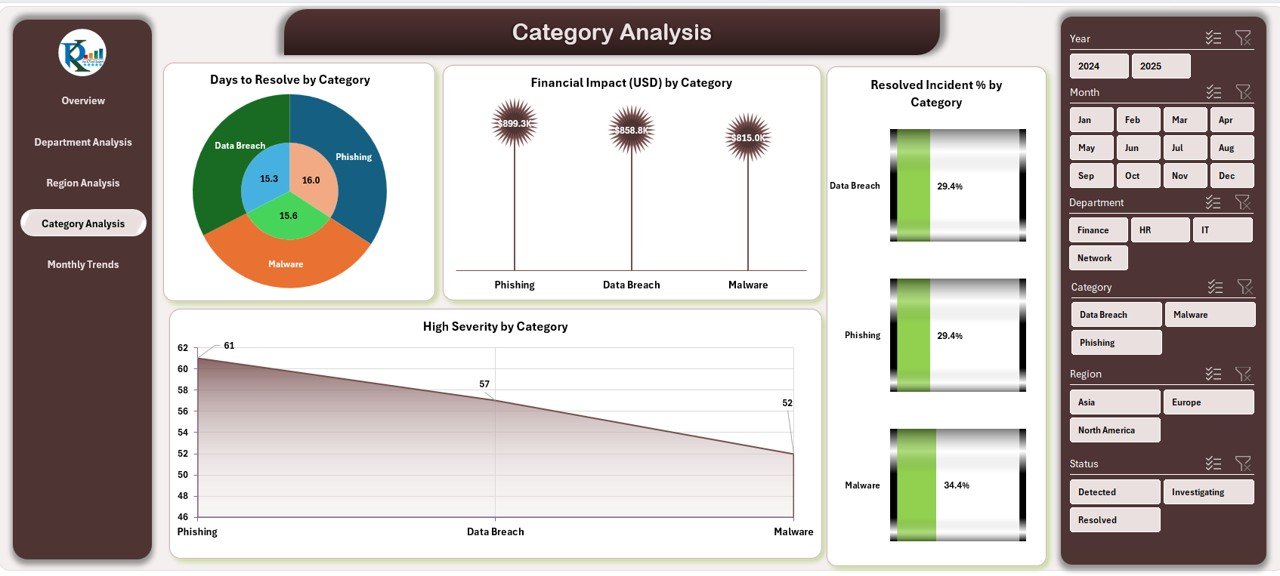
The Category Analysis Page focuses on types of cybersecurity incidents — such as phishing, malware, ransomware, insider threats, and data leakage.
Charts Displayed:
-
Days to Resolve by Category
-
High Severity % by Category
-
Resolved Incident % by Category
-
Financial Impact (USD) by Category
This helps in identifying which incident types are recurring or most damaging. For example, if phishing shows high severity and long resolution times, organizations can invest in better email filtering or employee awareness programs.
Monthly Trends
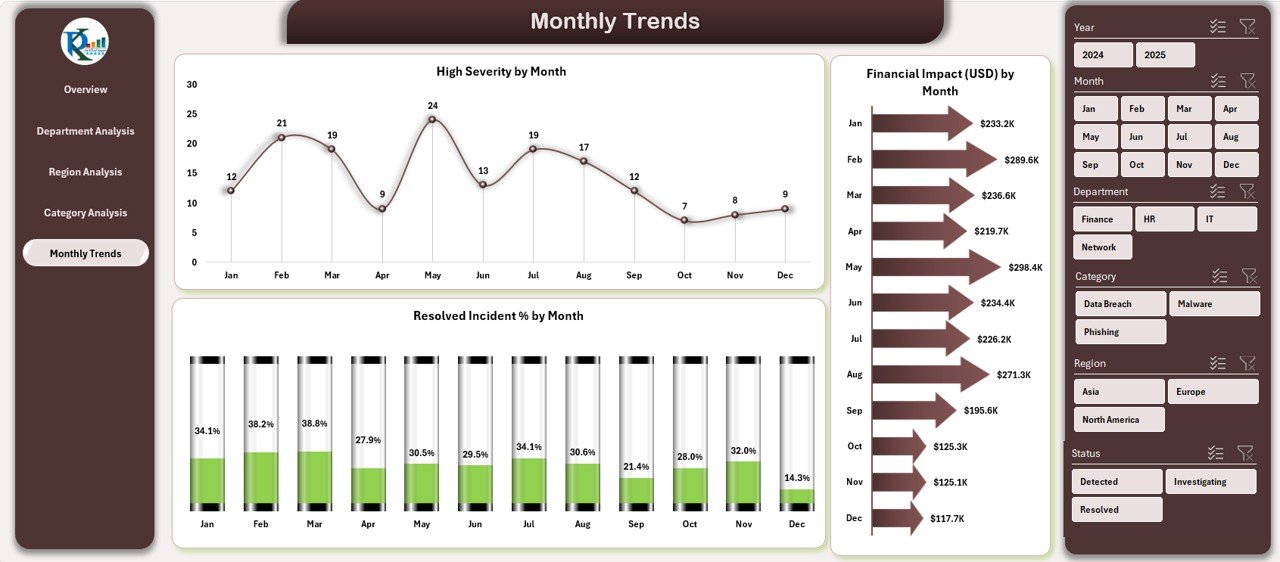
Cybersecurity is a continuous process. The Monthly Trends Page allows you to view how key metrics evolve over time.
Key Charts:
-
High Severity % by Month
-
Resolved Incident % by Month
-
Financial Impact (USD) by Month
These trend charts provide a clear understanding of performance improvements or deterioration month by month — helping teams plan proactive actions for the future.
Support Sheet and Data Sheet
-
🧾 Data Sheet: This is the backbone of the dashboard. It contains all raw incident data including date, category, department, region, severity, assigned person, status, financial loss, and resolution time.
-
⚙️ Support Sheet: This includes reference lists, dropdown data, and formulas that ensure the dashboard runs smoothly without errors.
How Does the Cybersecurity Dashboard Work?
The dashboard uses Excel’s built-in tools such as PivotTables, PivotCharts, slicers, and conditional formatting to generate real-time analytics.
Here’s how it functions step by step:
-
Data Input: Enter or import cybersecurity incident records into the Data Sheet.
-
Automatic Refresh: PivotTables pull and summarize the data.
-
Visual Display: Charts and cards automatically update across all pages.
-
User Control: Use slicers to filter by date, department, severity, or incident category.
The entire process is automated within Excel — making it both powerful and user-friendly.
Who Can Use the Cybersecurity Dashboard?
This template is suitable for a wide range of users:
🖥️ IT Security Managers: To track team efficiency and incident trends.
🧑💼 CIOs and Executives: To monitor overall risk exposure and financial impact.
🏢 Department Heads: To view departmental vulnerabilities and performance.
💼 SMEs: To maintain cybersecurity visibility without expensive software.
📈 Consultants: To present audit findings and client cybersecurity summaries.
The simplicity of Excel makes it accessible for anyone familiar with spreadsheets.
Benefits of Using a Cybersecurity Dashboard in Excel
Let’s look at how this dashboard simplifies complex cybersecurity operations:
📊 Centralized Monitoring: Combines all metrics in one location for a holistic view.
⏱️ Quick Decision-Making: Real-time data helps prioritize immediate threats.
💰 Cost-Effective: No need for external BI tools or costly subscriptions.
🧠 Data-Driven Strategy: Enables informed planning and resource allocation.
🔄 Automation Ready: Easily connects with Power Query or Power BI for advanced users.
📉 Reduced Response Time: Quick visualization helps detect and resolve incidents faster.
🔐 Improved Compliance: Keeps track of data protection performance for audits.
Advantages of the Cybersecurity Dashboard in Excel
Here are the key advantages explained in detail:
1. Simple Yet Powerful
Excel is a tool everyone knows. The dashboard combines that simplicity with analytics strength, allowing even non-technical users to gain valuable cybersecurity insights.
2. Fully Customizable
You can easily adjust color themes, charts, or KPIs according to your organization’s needs. Each page supports new visual additions without breaking formulas.
3. Instant Visibility
From the overview cards to detailed trend charts, you can instantly identify critical threats, delayed responses, or financial hotspots.
4. Smart Decision Support
The dashboard highlights performance gaps visually, enabling smarter decisions about budget allocation, training, and resource planning.
5. Seamless Integration
For advanced analytics, you can connect this Excel dashboard with Power BI, SQL databases, or incident-management tools to expand your cybersecurity analytics ecosystem.
How to Create and Customize Your Cybersecurity Dashboard
If you want to build or modify the template, here’s a quick roadmap:
-
Define Your KPIs: Decide what you want to measure — incident count, resolution time, cost, etc.
-
Prepare Data: Collect data in a structured format (date, category, department, region).
-
Insert PivotTables: Summarize your data across relevant dimensions.
-
Add Charts: Use column, pie, and line charts to visualize trends.
-
Add Slicers: Provide interactivity to filter by department, region, or category.
-
Apply Conditional Formatting: Highlight high severity or overdue cases in red.
-
Add Navigation Buttons: Simplify movement between sheets.
-
Protect Worksheets: Lock formula cells to prevent accidental edits.
These steps will help you build a professional, functional, and visually engaging dashboard.
Best Practices for the Cybersecurity Dashboard in Excel
To make the most of this dashboard, follow these best practices:
✅ Keep Data Updated: Refresh the data regularly to ensure accurate results.
✅ Use Consistent Labels: Standardize incident categories and department names.
✅ Maintain Data Security: Store the Excel file securely, as it may contain sensitive data.
✅ Review Monthly Trends: Analyze MTD (Month-to-Date) and YTD (Year-to-Date) changes.
✅ Integrate Alerts: Add conditional formatting to flag incidents with high severity.
✅ Perform Periodic Backups: Save versioned backups to prevent data loss.
✅ Document KPIs: Include KPI definitions in a separate sheet for transparency.
✅ Share Insights: Use the dashboard during security meetings to guide decision-making.
These practices will keep your dashboard efficient, secure, and insightful.
Click to Purchases Cybersecurity Dashboard in Excel
Conclusion
The Cybersecurity Dashboard in Excel is a game-changer for organizations seeking clarity, speed, and accuracy in security monitoring.
With its intuitive design, detailed analytical pages, and visual storytelling, this dashboard empowers IT and management teams to make data-driven decisions and strengthen cybersecurity resilience.
Whether you’re a small business or a global enterprise, this Excel-based tool helps you stay one step ahead of cyber threats — without complex software or coding.
Frequently Asked Questions (FAQs)
1. What is the main purpose of a Cybersecurity Dashboard in Excel?
The main goal is to visualize and track cybersecurity incidents, risks, and financial impacts, helping organizations make faster and smarter decisions.
2. Can I customize this dashboard for my company’s KPIs?
Yes. You can easily modify the KPIs, colors, charts, and data structure to align with your organization’s unique security metrics.
3. Does it require advanced Excel skills?
No. The dashboard is designed for all user levels. If you can work with PivotTables and filters, you can use it efficiently.
4. How often should I update the data?
Ideally, update your data weekly or after every major incident. Frequent updates ensure that charts and KPIs remain accurate.
5. Can I connect it to Power BI or databases?
Absolutely. Advanced users can connect the Excel data to Power BI, SQL, or other tools for enhanced visual analytics and reporting.
6. Is the dashboard suitable for small businesses?
Yes. It’s ideal for small and medium-sized enterprises that want cost-effective cybersecurity visibility without expensive software.
7. What kind of data is needed for this dashboard?
Incident date, category, department, assigned person, resolution time, severity level, and financial impact are essential data points.
8. How does this dashboard help improve security?
By highlighting patterns in severity, response time, and financial loss, the dashboard helps management prioritize areas that need immediate attention.
9. Can multiple users access it simultaneously?
Yes, if it’s stored in a shared environment like OneDrive or SharePoint, multiple users can collaborate while maintaining version control.
10. Is it safe to store cybersecurity data in Excel?
As long as the file is password-protected and access is restricted, Excel remains a safe platform for operational dashboards.
Visit our YouTube channel to learn step-by-step video tutorials