In today’s competitive market, every organization needs to track its business development activities effectively. Managing sales leads, monitoring conversions, evaluating team performance, and analyzing growth trends are essential for sustainable success. However, handling all this data manually can be time-consuming and error-prone.
That’s where the Business Development KPI Dashboard in Excel comes into play. This smart and interactive Excel-based tool simplifies performance tracking by providing a structured and visual way to monitor key metrics. With dynamic visuals, drop-down selections, and automated calculations, it allows managers to focus on decision-making rather than data crunching.
In this article, you will learn everything about this dashboard — from its features and structure to its benefits, applications, and best practices.
Click to buy Business Development KPI Dashboard in Excel
What Is a Business Development KPI Dashboard in Excel?
A Business Development KPI Dashboard in Excel is a prebuilt performance monitoring system designed to track the effectiveness of sales and business development efforts. It consolidates essential KPIs (Key Performance Indicators) into a single, easy-to-navigate dashboard, helping teams measure progress against goals.
This dashboard provides insights into:
- Revenue generation trends
- Lead conversion performance
- Customer acquisition and retention rates
- Monthly and yearly progress
- Comparison between actual, target, and previous year numbers
By using Excel’s formulas, charts, and conditional formatting, it creates an interactive, data-driven environment without needing advanced software.
Key Features of the Business Development KPI Dashboard
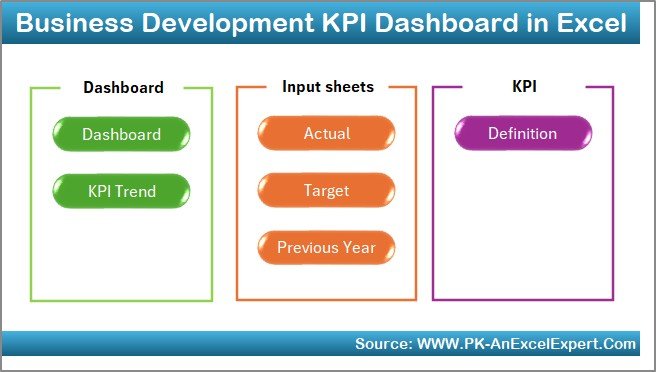
This dashboard consists of seven well-structured worksheets, each serving a unique purpose. Let’s explore them in detail.
Home Sheet (Navigation Page)
The Home sheet acts as the command center. It includes six buttons that allow users to jump directly to other sheets. This eliminates confusion and saves time when navigating between different sections of the workbook.
It also gives a quick overview of what each sheet contains, making it user-friendly even for non-technical users.
Click to buy Business Development KPI Dashboard in Excel
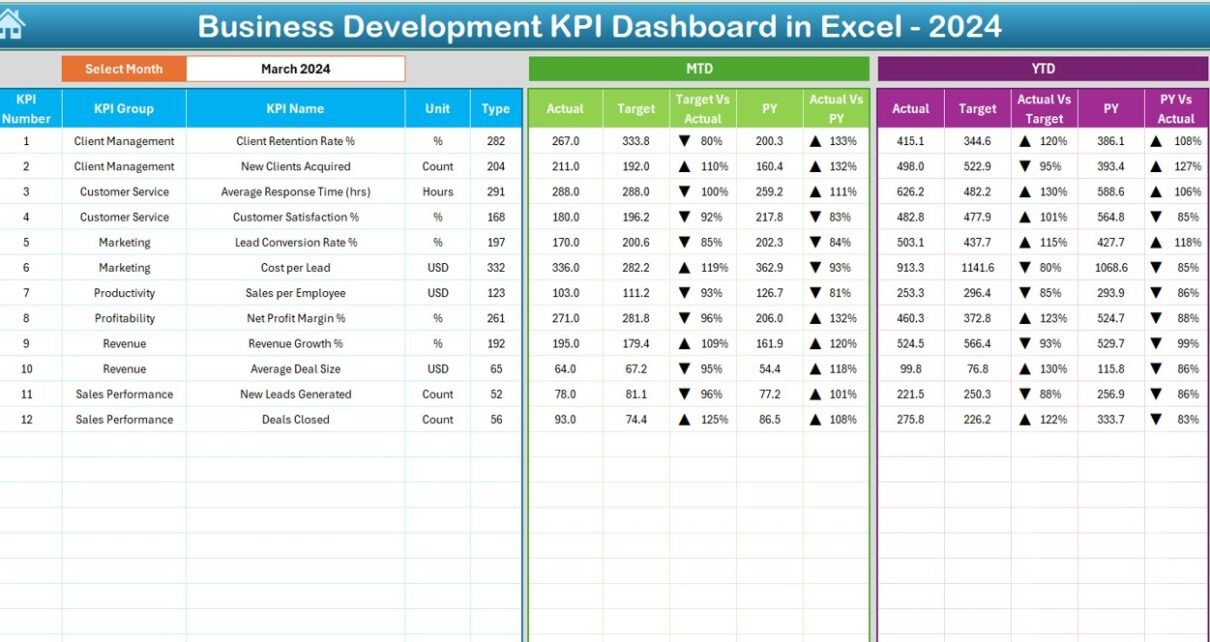
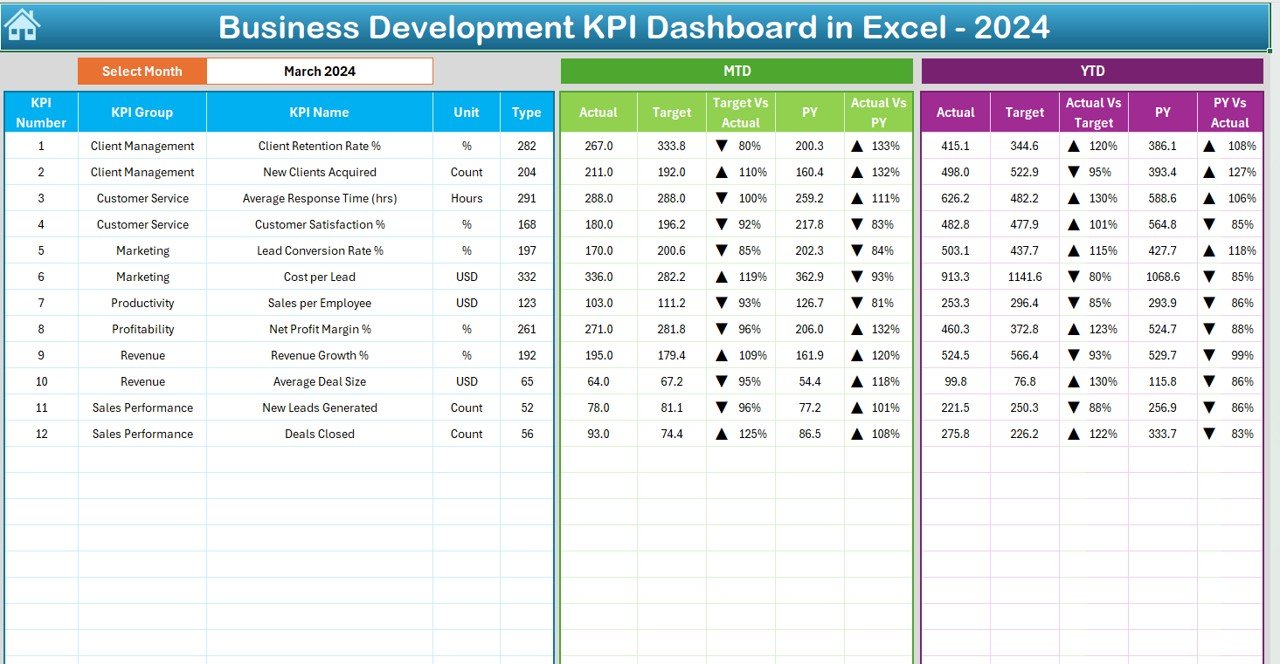
Dashboard Sheet (Main View)
The Dashboard sheet is the heart of this system. Here, all KPI results are visualized and compared. You can select the Month from a drop-down menu located at cell D3. Once the month is chosen, all metrics update automatically.
This page displays:
- MTD (Month-to-Date) and YTD (Year-to-Date) results
- Actual vs Target performance
- Actual vs Previous Year comparisons
- Conditional formatting using up/down arrows to show performance direction
This visualization helps managers quickly identify whether goals are being met and which areas require attention.
Click to buy Business Development KPI Dashboard in Excel
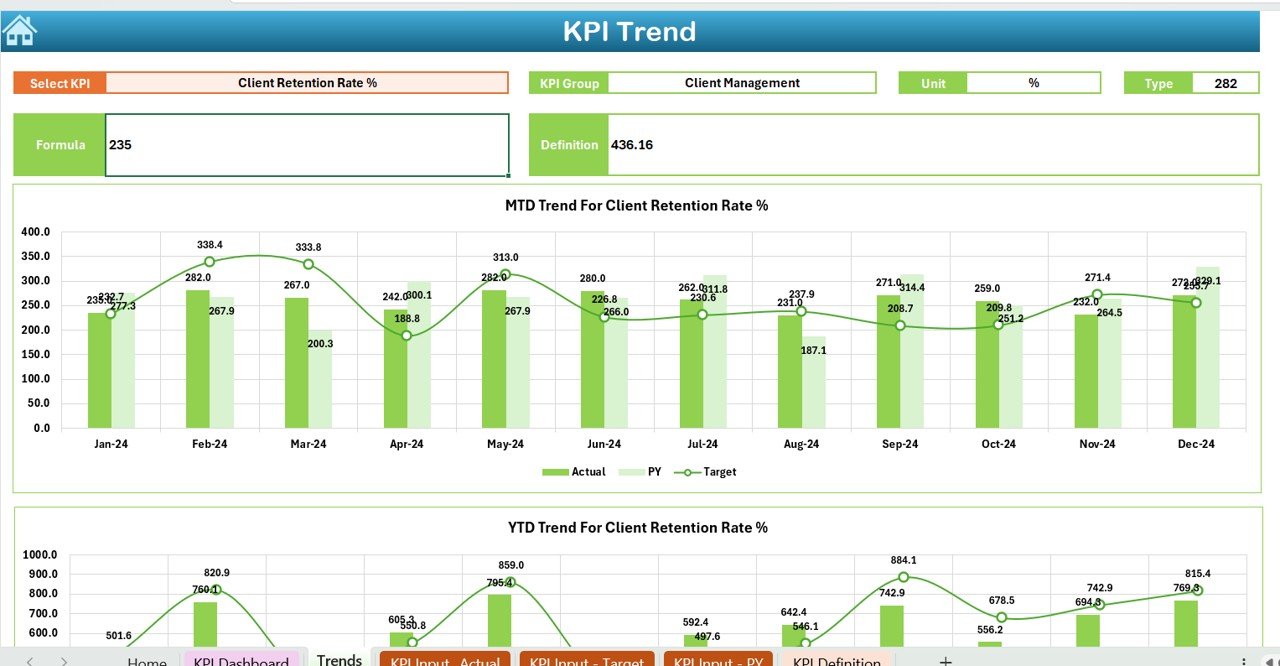
KPI Trend Sheet
The KPI Trend sheet focuses on analyzing performance over time. Users can select a specific KPI from the drop-down in cell C3. Once selected, it shows:
- KPI Group and Unit of Measurement
- Type of KPI (Lower the Better or Upper the Better)
- Formula used to calculate the KPI
- Definition for easy understanding
Additionally, it includes two trend charts — one for MTD and one for YTD values — showcasing Actual, Target, and Previous Year trends. This makes it easier to identify performance patterns and deviations.
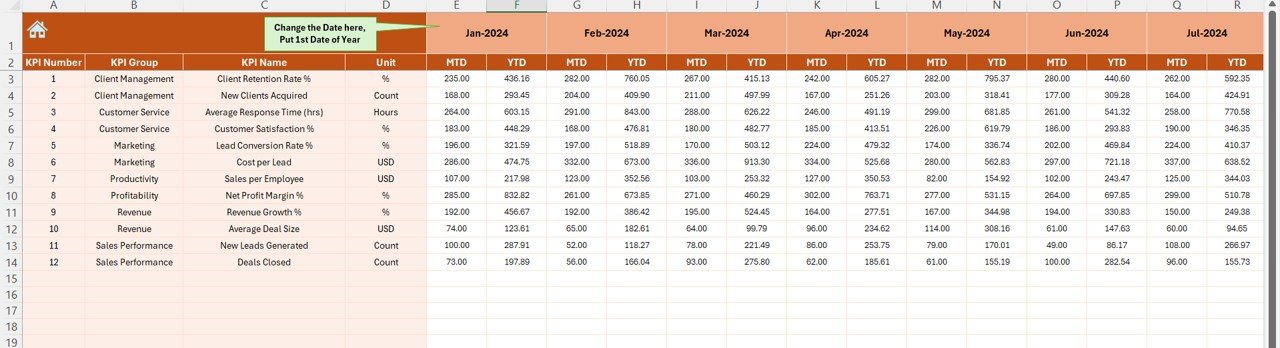
Actual Numbers Input Sheet
This sheet is where users enter their actual data. Both MTD and YTD figures are recorded for each month. You can change the month by editing the value in cell E1 — once the first month of the year is entered, the sheet automatically adjusts accordingly.
This structured input design ensures consistent data entry across all months and KPIs.
Click to buy Business Development KPI Dashboard in Excel
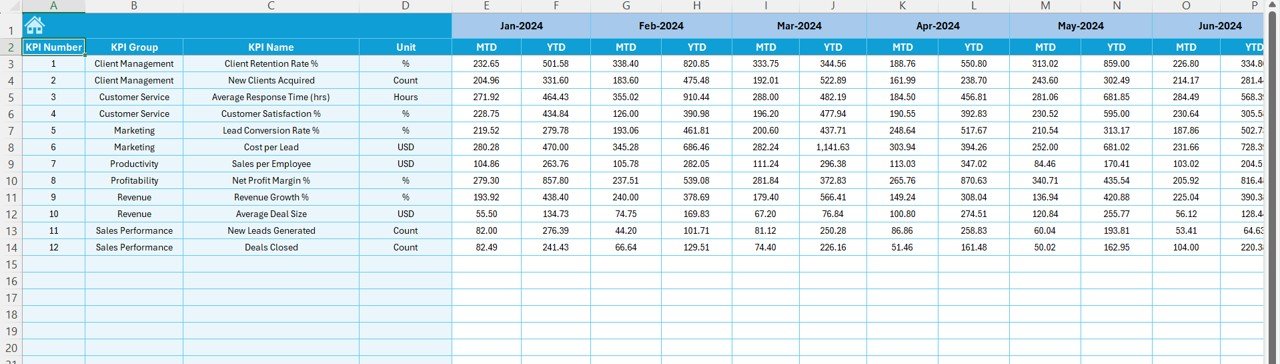
Target Sheet
The Target Sheet allows teams to set monthly and yearly performance goals for each KPI. It captures both MTD and YTD target values, which serve as benchmarks against actual performance.
This clear distinction between targets and actuals helps in identifying underperforming areas and setting realistic future goals.
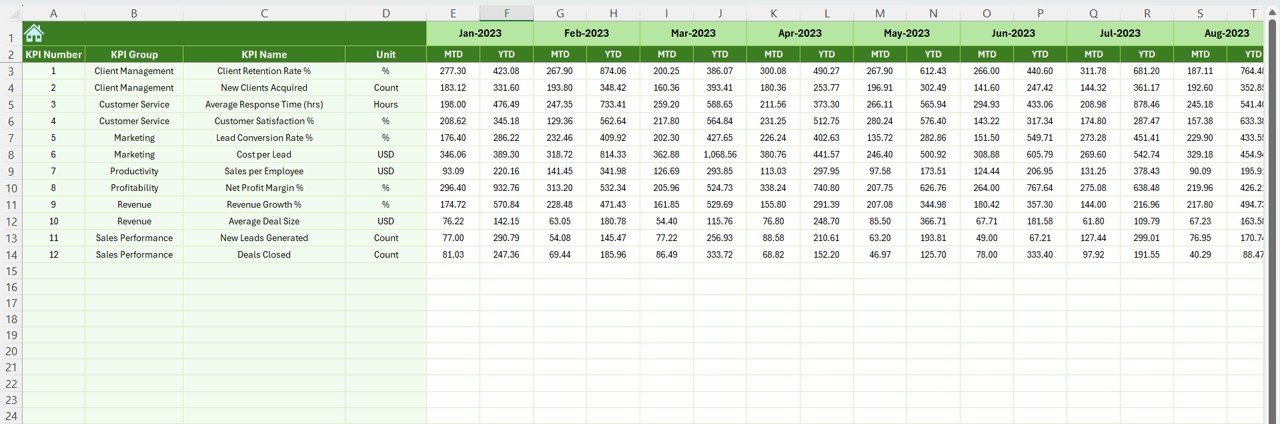
Previous Year Numbers Sheet
Historical data plays a vital role in understanding trends. In this sheet, users enter the previous year’s performance numbers for each KPI. The dashboard then uses this information to compare current progress with last year’s outcomes — providing a complete view of growth and improvement.
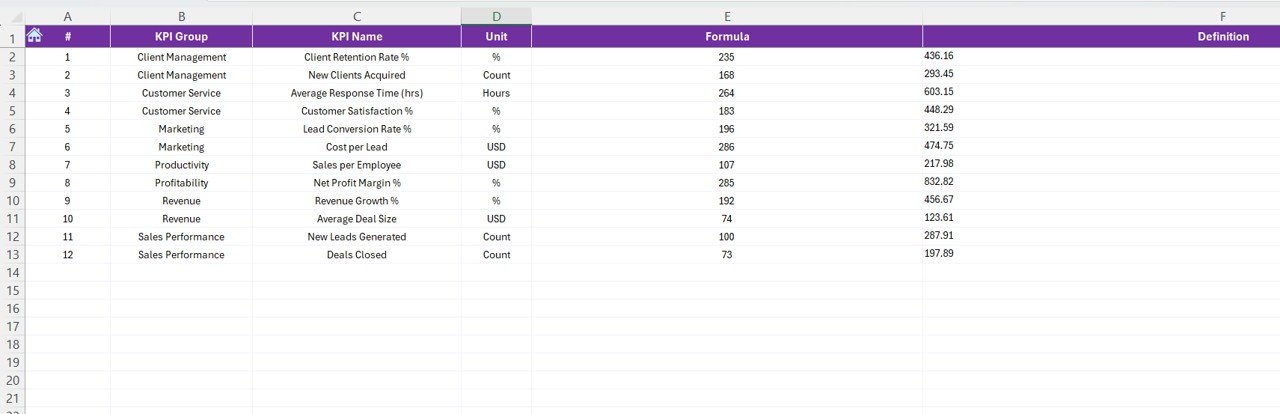
KPI Definition Sheet
This sheet documents essential details about each KPI, including:
- KPI Name
- KPI Group
- Unit of Measurement
- Formula used
- Brief Definition
Having a well-maintained KPI definition list ensures that every team member understands how each metric is calculated and interpreted. It promotes consistency and clarity in performance evaluation.
Why Businesses Need a KPI Dashboard in Excel
A business development dashboard in Excel offers flexibility, accessibility, and cost-effectiveness. Unlike expensive BI tools, it runs entirely within Microsoft Excel — a tool familiar to most professionals.
It empowers organizations to:
- Track sales and growth performance with ease
- Align team efforts with company goals
- Visualize business progress in real time
- Simplify monthly and yearly reporting
- Identify opportunities and bottlenecks quickly
The combination of Excel formulas, pivot tables, and charts makes it a powerful yet affordable solution for any business size.
Advantages of the Business Development KPI Dashboard
Implementing this Excel-based dashboard can bring several benefits to your organization. Let’s explore them one by one.
- Centralized Data Tracking
- Instead of scattered spreadsheets, this dashboard consolidates all data into one place. It ensures that decision-makers always access accurate and up-to-date information.
- Quick Decision-Making
- With automatic calculations and visuals, managers can interpret performance at a glance. The conditional formatting and KPI trends highlight problem areas instantly.
- Enhanced Accountability
- Each KPI can be assigned to a responsible person or department, making performance tracking transparent and measurable.
- Historical Performance Comparison
- Comparing current results with previous year numbers helps identify long-term improvements and trends.
- Cost-Effective Solution
- Unlike advanced analytics software, this Excel dashboard requires no additional licensing costs or complex setup. It’s a one-time investment that delivers continuous insights.
- Easy Customization
- You can easily add, modify, or remove KPIs as your business evolves. The modular structure ensures that customization doesn’t disrupt the workflow.
How to Use the Business Development KPI Dashboard Effectively
To make the most out of this Excel tool, follow these step-by-step usage instructions:
- Open the “Home” Sheet – Use the navigation buttons to explore different sections.
- Go to the “Target Sheet” – Set up monthly and yearly targets for all KPIs.
- Enter Actual Data – Input monthly and YTD figures in the “Actual Numbers” sheet.
- Add Previous Year Data – Populate the previous year sheet to enable comparative analysis.
- Review KPI Definitions – Ensure all formulas and KPI explanations are accurate.
- Analyze the Dashboard Page – Use the drop-down in D3 to change the month and review updated visuals.
- Monitor Trends – Check the KPI Trend page to understand long-term performance movement.
By following these steps, you’ll have a powerful and automated reporting system ready to guide your business development strategy.
What Insights Can You Get from the Dashboard?
Using this dashboard, you can extract several actionable insights, such as:
- Which KPIs consistently miss their targets
- Month-over-month growth trends
- Departmental strengths and weaknesses
- Top-performing regions, products, or sales reps
- Seasonal variations in performance
- Improvement areas compared to the previous year
These insights help managers set realistic targets and plan growth strategies more effectively.
Advantages of Tracking KPIs in Excel Instead of Other Tools
While many companies adopt specialized BI platforms, Excel remains a powerful contender due to its simplicity and accessibility. Some key reasons include:
- No Learning Curve: Most employees already know Excel.
- Customizable Layout: You can tailor dashboards to your exact needs.
- Offline Accessibility: No internet connection is required.
- Low Cost: Zero additional software fees.
- Integration: Works easily with CSVs, ERP exports, and CRM data.
Thus, Excel provides a practical balance of power and simplicity for small and mid-sized organizations.
Best Practices for the Business Development KPI Dashboard
Follow these best practices to ensure maximum efficiency and accuracy:
- Keep Your Data Clean
Ensure all numbers are formatted consistently and updated regularly. Avoid duplicate or missing records.
- Define KPIs Clearly
Every KPI should have a clear formula and definition. Maintain these in the KPI Definition sheet for team alignment.
- Review Monthly
Use the drop-down in D3 to review performance every month. This helps you stay proactive rather than reactive.
- Automate Where Possible
Use Excel formulas, lookup functions, and conditional formatting to automate repetitive calculations.
- Visualize Smartly
Avoid overcrowded charts. Use bar, line, and combo charts to present your data clearly.
- Compare with Previous Year
Always analyze your performance against the previous year’s data to understand real growth.
- Involve the Team
Share dashboard results with the sales and marketing teams to promote accountability and motivation.
Conclusion
The Business Development KPI Dashboard in Excel is more than just a spreadsheet — it’s a complete performance management system. It enables businesses to measure, monitor, and improve their development activities without investing in complex software.
With its 7-sheet structured format, dynamic drop-downs, and automated charts, it empowers decision-makers with the clarity they need. Whether you’re a startup or a large enterprise, this dashboard can transform the way you track and achieve business goals.
If you want to stay competitive, start implementing this tool today and watch your business growth become more measurable, strategic, and result-driven.
Frequently Asked Questions (FAQs)
- What is the purpose of a Business Development KPI Dashboard?
The purpose of this dashboard is to track and evaluate key performance indicators related to sales, marketing, and customer growth. It helps businesses measure success and make data-backed decisions.
- Can I customize the KPIs in this dashboard?
Yes, you can easily add, edit, or remove KPIs in the KPI Definition sheet to align with your company’s specific objectives.
- Does this dashboard require advanced Excel skills?
No. It’s designed to be user-friendly. You only need basic Excel knowledge to navigate and input data.
- How often should I update the data?
It’s best to update MTD and YTD values monthly. Regular updates ensure accurate trend analysis and timely decision-making.
- Can this dashboard handle large datasets?
Yes, Excel can efficiently handle thousands of records. However, using structured tables and clean data helps maintain optimal performance.
- Is this dashboard suitable for small businesses?
Absolutely! Small businesses can use it to manage goals, monitor progress, and make better strategic choices — all at zero extra software cost.
- Can I visualize the data in charts?
Yes, the dashboard includes prebuilt charts for MTD and YTD trends. You can also customize chart types according to your needs.
Visit our YouTube channel to learn step-by-step video tutorials
Watch the step-by-step video tutorial:
Click to buy Business Development KPI Dashboard in Excel