In today’s unpredictable world, organizations face many emergencies—natural disasters, workplace accidents, public health crises, or system failures. Managing these incidents efficiently requires real-time data visibility, coordinated decision-making, and fast response times.
That’s where the Emergency Management Dashboard in Power BI becomes a game-changer.
This article explains everything you need to know about the Emergency Management Dashboard in Power BI—its structure, features, benefits, best practices, and how it helps businesses respond smarter and faster when emergencies strike.
Click to Purchases Emergency Management Dashboard in Power BI
What Is an Emergency Management Dashboard in Power BI?
An Emergency Management Dashboard in Power BI is a dynamic analytics solution designed to collect, visualize, and analyze emergency-related data.
It transforms complex spreadsheets into clear visual insights, helping organizations understand the severity, response time, cost, and overall performance during emergency situations.
Power BI acts as the intelligence layer—turning raw Excel data into actionable reports that support informed decision-making. Whether you manage crisis response, safety compliance, or disaster recovery, this dashboard ensures you stay one step ahead.
Why Organizations Need an Emergency Management Dashboard
Emergencies demand immediate action and coordination across departments. Traditional reporting methods—like manual Excel summaries or email updates—cause delays and confusion. A Power BI dashboard solves these issues by offering:
-
Centralized Monitoring: All emergency data in one place.
-
Real-Time Updates: Automatic refresh and live tracking of incidents.
-
Visual Insights: Charts, KPIs, and trend lines for instant understanding.
-
Faster Decision-Making: Quick identification of high-severity cases.
-
Accountability: Department-wise and team-wise performance tracking.
In short, Power BI provides both the speed and clarity required for effective emergency management.
Dashboard Structure Overview
The Emergency Management Dashboard in Power BI includes five structured analytical pages—each designed to highlight different perspectives of emergency performance. These pages create a complete picture of your organization’s readiness and response efficiency.
1️⃣ Overview Page
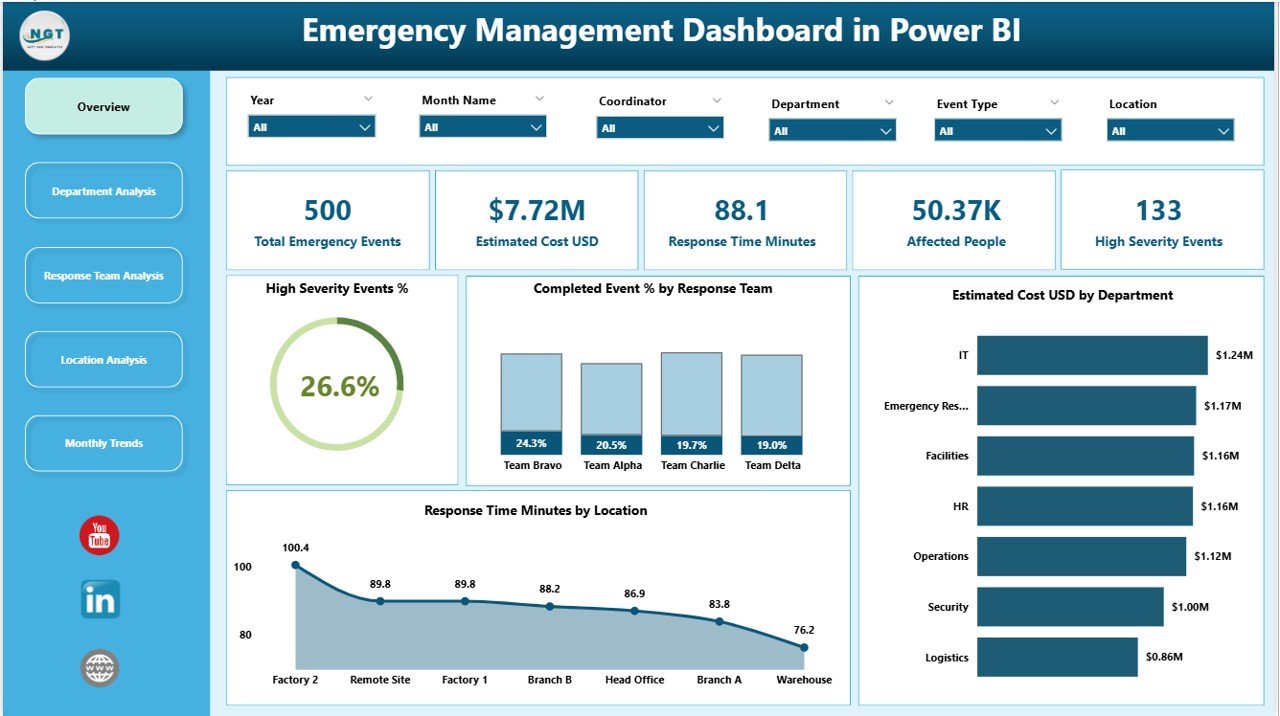
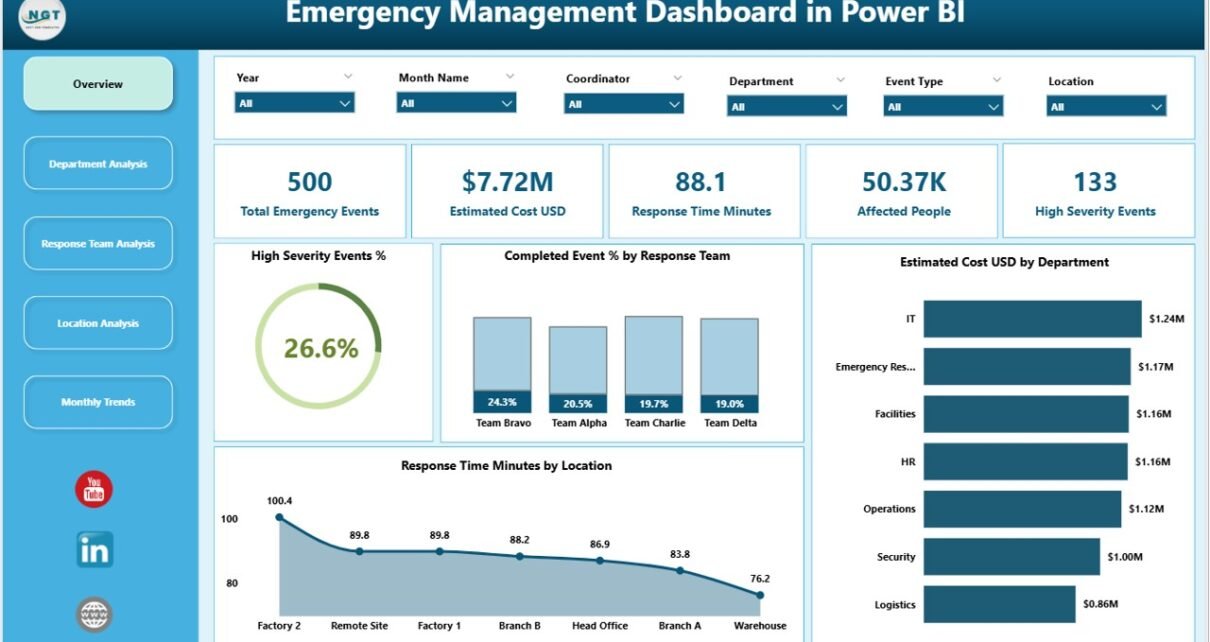
The Overview Page is the main control center of the dashboard.
It gives leadership a snapshot of all critical metrics and performance indicators related to ongoing or past emergencies.
Key Features:
Cards Display:
- Total Emergency Events
- High-Severity Event %
- Completed Event %
- Average Response Time (Minutes)
- Total Estimated Cost (USD)
Charts Included:
- High Severity Event % by Response Team – Identifies which teams face the most critical events.
- Completed Event % by Response Team – Tracks team performance in closing emergency cases.
- Estimated Cost (USD) by Department – Highlights cost distribution across departments.
- Response Time (Minutes) by Location – Helps evaluate how quickly each location handles emergencies.
The Overview Page acts as a strategic command panel—offering insights at a glance.
2️⃣ Department Analysis Page
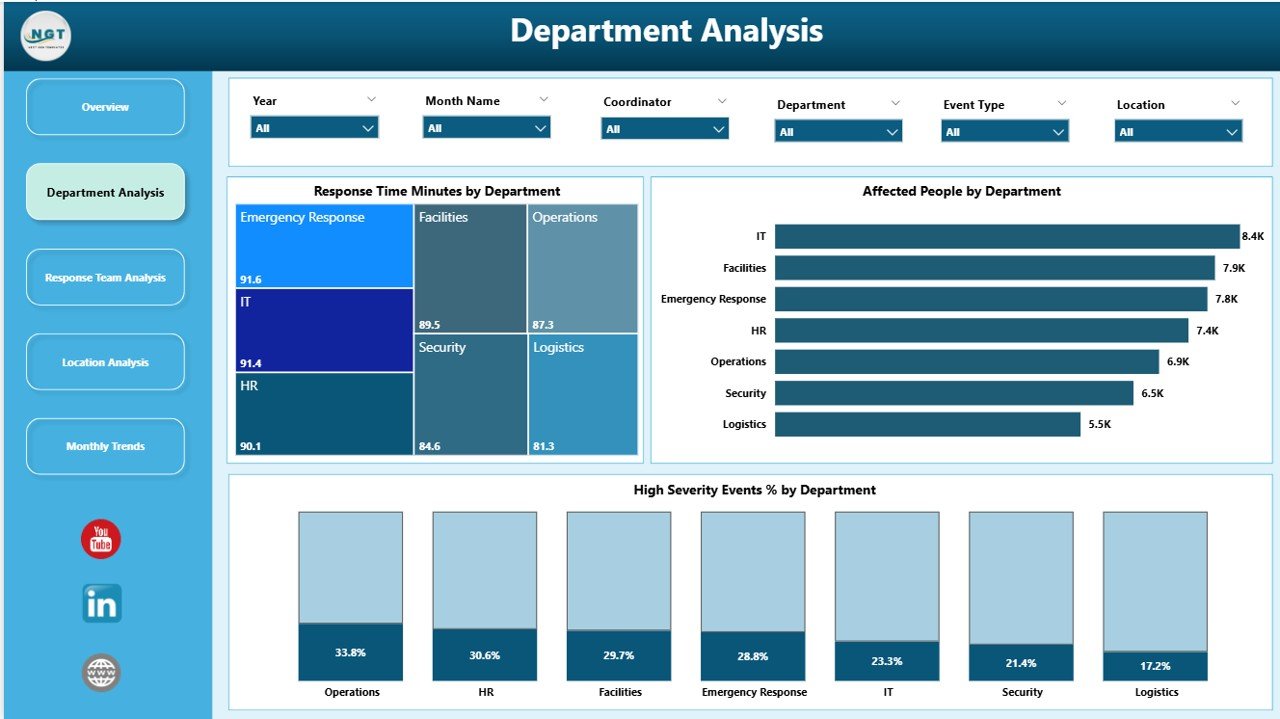
The Department Analysis Page provides a detailed view of emergency performance across departments.
Charts Displayed:
-
Response Time (Minutes) by Department – Compares departmental agility.
-
Affected People by Department – Shows the human impact per department.
-
High Severity Event % by Department – Helps identify risk-prone departments.
This page helps management allocate resources better and prioritize training or safety measures in departments showing frequent or severe incidents.
3️⃣ Response Team Analysis Page
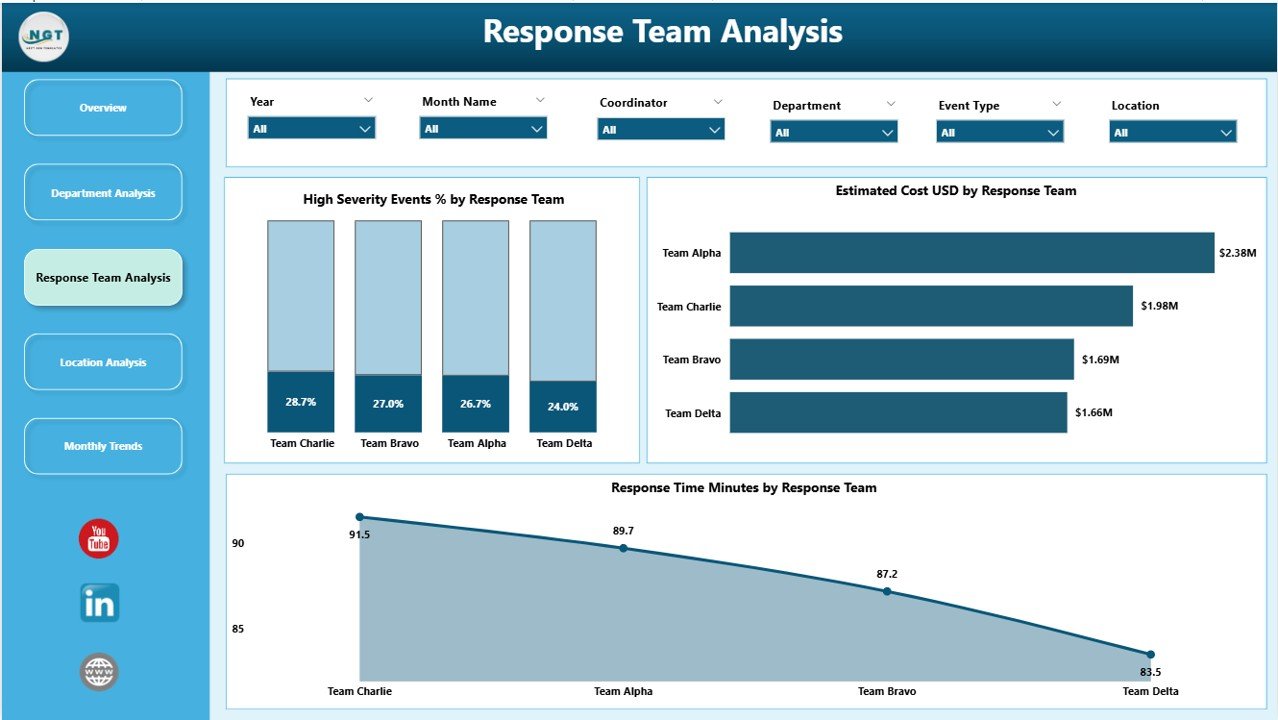
This page focuses on how each response team performs during emergencies.
It evaluates their efficiency, accuracy, and overall contribution to managing incidents effectively.
Charts Displayed:
-
High Severity Event % by Response Team
-
Completed Event % by Response Team
-
Response Time (Minutes) by Response Team
Click to Purchases Emergency Management Dashboard in Power BI
Through these visuals, organizations can easily identify top-performing teams, recognize improvement areas, and balance workloads across teams for faster response.
4️⃣ Location Analysis Page
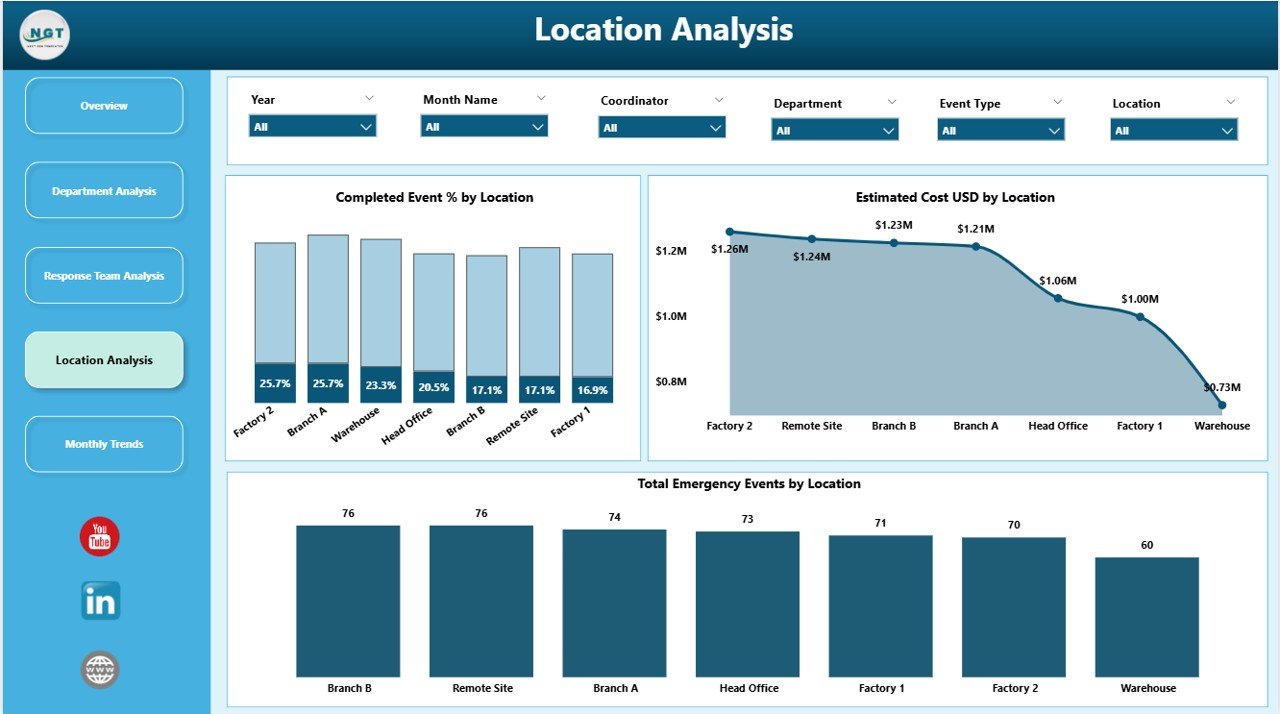
The Location Analysis Page compares emergency data across different branches, offices, or sites.
Charts Displayed:
-
Completed Event % by Location – Monitors the success rate of incident handling.
-
Estimated Cost (USD) by Location – Tracks financial impact region-wise.
-
Total Emergency Events by Location – Reveals locations with the highest frequency of emergencies.
This analysis enables site managers to strengthen preparedness and implement targeted mitigation measures.
5️⃣ Monthly Trends Page
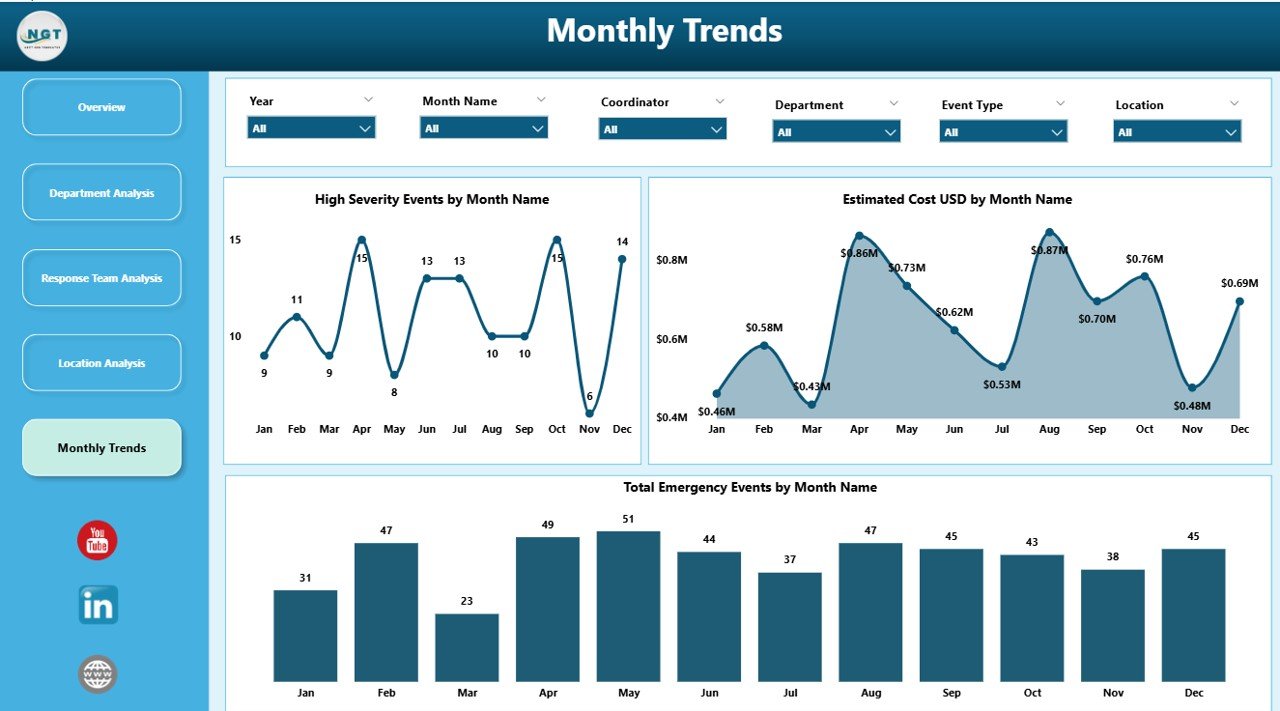
The Monthly Trends Page shows time-based insights—helping teams identify seasonal patterns or recurring risks.
Charts Displayed:
-
High Severity Event % by Month Name
-
Estimated Cost (USD) by Month Name
-
Total Emergency Events by Month Name
This trend view allows organizations to forecast potential risks and plan proactive strategies for upcoming months.
📊 Key Performance Indicators (KPIs)
The dashboard tracks several KPIs that reflect the success of emergency management operations. Some crucial metrics include:
-
High-Severity Event % – Percentage of severe incidents in total events.
-
Response Time (Minutes) – Average time taken to respond to emergencies.
-
Completed Event % – Proportion of emergencies successfully closed.
-
Estimated Cost (USD) – Total financial impact of all incidents.
-
Affected People Count – Number of individuals impacted by emergencies.
Monitoring these KPIs provides actionable insights into both operational efficiency and financial exposure.
🚀 Advantages of Emergency Management Dashboard in Power BI
Implementing this dashboard delivers multiple organizational benefits. Below are the key advantages explained in detail.
✅ 1. Real-Time Situation Awareness
The dashboard connects with live data sources, allowing teams to monitor evolving emergencies as they happen. Real-time visuals empower quick decision-making without waiting for manual reports.
✅ 2. Data-Driven Decision-Making
With dynamic visuals and drill-through analysis, decision-makers gain deep insights into where resources should go and which departments or locations need attention.
✅ 3. Enhanced Collaboration
Different teams—response units, HR, facilities, and finance—can access the same data simultaneously in Power BI Service, improving coordination and accountability.
✅ 4. Cost and Resource Optimization
By visualizing cost per event, organizations can spot inefficiencies, reduce unnecessary expenses, and allocate budgets where they matter most.
✅ 5. Historical and Predictive Insights
Trend analysis allows for comparing current emergencies with historical data to predict future risks. Power BI’s forecasting tools make this process even smarter.
✅ 6. Easy Integration and Customization
Power BI easily connects to Excel, SharePoint, SQL Server, or any cloud database. Users can customize visuals, filters, or KPIs according to business needs.
✅ 7. Improved Transparency and Reporting
Visual dashboards improve transparency across the organization. Stakeholders can view accurate, up-to-date performance metrics at any time.
🛠️ Building the Dashboard in Power BI
To build an Emergency Management Dashboard, follow these practical steps:
-
Prepare Your Data:
Gather emergency records in Excel or a database, including columns such as Event Date, Department, Response Team, Severity Level, Estimated Cost, Response Time, and Location. -
Connect to Power BI:
Import the data into Power BI Desktop using the “Get Data” option. -
Data Modeling:
Define relationships, calculate measures (like High Severity Event %), and create DAX formulas for metrics such as Average Response Time. -
Design Visuals:
Use cards for KPIs and visuals like column charts, pie charts, and trend lines for performance indicators. -
Add Filters and Slicers:
Enable interactive analysis by adding filters for Department, Location, Month, or Response Team. -
Publish and Share:
Publish the report to Power BI Service for collaboration and automated refresh.
💡 Use Cases Across Industries
The Emergency Management Dashboard isn’t limited to one sector—it’s widely useful across industries:
-
Healthcare: Track hospital emergency cases and response efficiency.
-
Manufacturing: Monitor workplace accidents and machine breakdowns.
-
Government: Manage disaster response, rescue operations, and costs.
-
Transportation: Handle accidents or disruptions in real time.
-
Energy and Utilities: Control plant incidents or power failures.
-
Education: Ensure campus safety and incident tracking.
Every organization dealing with safety, operations, or compliance can benefit from such a dashboard.
🏗️ Example Insights You Can Derive
Using this dashboard, users can answer important questions like:
-
Which department faces the highest emergency costs?
-
Which response team handles incidents fastest?
-
What is the monthly trend of high-severity events?
-
Which locations have the longest average response times?
-
How many events were resolved within SLA limits?
These insights translate directly into improved preparedness and operational excellence.
💎 Best Practices for the Emergency Management Dashboard in Power BI
To get maximum value from your dashboard, follow these best practices:
🧠 1. Keep Data Clean and Consistent
Ensure your data sources use standard formats for dates, departments, and response teams. Consistent data allows accurate calculations and better visuals.
🔄 2. Automate Data Refresh
Schedule automatic data refreshes in Power BI Service to maintain real-time accuracy without manual updates.
🎯 3. Use Clear and Simple Visuals
Avoid clutter. Choose meaningful charts—bar, line, and KPI cards—that quickly communicate insights.
⚙️ 4. Apply Conditional Formatting
Use color coding (like red for high severity or green for completed events) to make interpretation faster.
🧩 5. Secure Sensitive Information
Use Power BI’s Row-Level Security (RLS) to limit access based on user roles.
📈 6. Benchmark and Compare
Create comparison metrics like Current Month vs Previous Month or Target vs Actual to measure progress continuously.
📊 7. Engage Stakeholders
Share the dashboard through Power BI Apps or Teams so that everyone stays informed and aligned.
Following these practices ensures your Emergency Management Dashboard becomes a powerful operational command tool rather than just a report.
🧠 Challenges You Can Solve Using Power BI Emergency Dashboard
-
Delayed Response Times: Detect delays instantly using average response time visuals.
-
Budget Overruns: Monitor department-wise cost spikes in real time.
-
Lack of Accountability: Assign ownership through department and team metrics.
-
Communication Gaps: Enable all teams to access one version of the truth.
-
Data Fragmentation: Integrate multiple Excel sheets or systems into one unified dashboard.
These improvements directly translate into lives saved, costs reduced, and faster recovery times.
Click to Purchases Emergency Management Dashboard in Power BI
🏁 Conclusion
The Emergency Management Dashboard in Power BI is more than just a reporting tool—it’s a command center for crisis management.
By integrating data, visualizing performance, and automating insights, organizations can transform their emergency response from reactive to proactive.
Whether you are tracking emergency events, analyzing costs, or managing team performance, Power BI provides the flexibility, clarity, and real-time power to keep your operations resilient.
When every second counts, this dashboard ensures your organization acts fast, smart, and effectively.
❓ Frequently Asked Questions (FAQs)
1. What is an Emergency Management Dashboard used for?
It helps organizations monitor and analyze emergencies like accidents, natural disasters, or system failures in real time. It tracks response times, costs, and performance to improve decision-making.
2. Can Power BI connect directly to live emergency systems?
Yes. Power BI can integrate with databases, Excel sheets, APIs, or live IoT feeds to provide up-to-date data automatically.
3. Who can benefit from this dashboard?
Emergency response managers, safety officers, executives, and analysts in industries such as healthcare, manufacturing, government, and education can all benefit.
4. How often should I update my emergency data?
Ideally, data should refresh daily or even hourly during ongoing crises to maintain accuracy and reliability.
5. What KPIs should I track in an emergency management dashboard?
Focus on KPIs like High Severity Event %, Response Time (Minutes), Completed Event %, Estimated Cost (USD), and Affected People Count for comprehensive tracking.
6. Can I customize the visuals in Power BI?
Absolutely. Power BI allows you to customize every chart, color, and filter according to your organization’s requirements.
7. How does this dashboard improve decision-making?
It provides real-time, visual insights, helping leaders act quickly, allocate resources efficiently, and measure performance accurately.
8. Is Power BI suitable for small organizations?
Yes. Power BI is scalable—small teams can start with Excel integration, while larger organizations can connect complex data systems.
9. How secure is the data in Power BI?
Power BI uses Microsoft-level encryption, access control, and Row-Level Security (RLS) to protect sensitive data.
10. What’s the biggest advantage of using Power BI for emergency management?
The biggest advantage is speed—decisions that once took hours can now be made instantly based on live, visualized data.
Visit our YouTube channel to learn step-by-step video tutorials