Aviation maintenance directly impacts flight safety, operational efficiency, regulatory compliance, and airline profitability. Even small maintenance delays or missed inspections can lead to costly aircraft groundings and schedule disruptions. Therefore, aviation organizations must track maintenance performance accurately and consistently.
That is why an Aviation Maintenance KPI Dashboard in Power BI becomes a critical tool for modern aviation operations.
In this detailed guide, you will learn what an Aviation Maintenance KPI Dashboard in Power BI is, why aviation organizations need it, how it works, its page-wise structure, key KPIs, advantages, best practices, and frequently asked questions. Moreover, the article uses clear language, strong transitions, and practical explanations to ensure easy understanding and strong SEO performance.
Click to Purchases Aviation Maintenance KPI Dashboard in Power BI
What Is an Aviation Maintenance KPI Dashboard in Power BI?
An Aviation Maintenance KPI Dashboard in Power BI is a ready-to-use, interactive reporting solution that helps aviation teams monitor, analyze, and improve aircraft maintenance performance using key performance indicators (KPIs).
Instead of relying on scattered Excel sheets, manual logs, and static reports, this dashboard consolidates all maintenance-related data into one structured Power BI file. As a result, maintenance managers, engineers, and leadership teams gain instant visibility into performance trends, target achievement, and maintenance efficiency.
Moreover, because the dashboard uses Excel as the data source and Power BI for visualization, teams can update data easily without advanced technical skills. Consequently, the dashboard remains flexible, scalable, and easy to maintain.
Why Do Aviation Organizations Need a Maintenance KPI Dashboard?
Aviation maintenance operations involve scheduled checks, unscheduled repairs, component replacements, compliance tracking, and workforce planning. Therefore, monitoring performance manually becomes time-consuming and error-prone.
An Aviation Maintenance KPI Dashboard in Power BI solves these challenges effectively.
Key reasons aviation organizations need this dashboard:
-
Aircraft maintenance data comes from multiple sources
-
Manual reporting delays decision-making
-
Performance gaps remain hidden without visuals
-
Target tracking lacks consistency across teams
-
Regulatory compliance requires accurate reporting
As a result, this dashboard acts as a single source of truth for maintenance performance.
Click to Purchases Aviation Maintenance KPI Dashboard in Power BI
How Does an Aviation Maintenance KPI Dashboard in Power BI Work?
The dashboard follows a simple and structured workflow.
First, users capture maintenance data in predefined Excel sheets. Then, Power BI connects to this Excel file and transforms raw data into interactive KPIs, tables, and trend charts.
Overall workflow:
-
Enter actual maintenance performance data in Excel
-
Enter target maintenance values in Excel
-
Define KPIs with formulas and performance type
-
Refresh the Power BI dashboard
-
Analyze maintenance KPIs using filters and visuals
Because of this approach, teams can focus on insights instead of manual calculations.
Excel as the Data Source: Simple and Flexible Design
The Aviation Maintenance KPI Dashboard in Power BI uses Excel as its data source. This design ensures ease of use and minimal training requirements.
Excel File Structure
The Excel file contains three essential worksheets:
1) Input_Actual Sheet: Capturing Real Maintenance Performance
This sheet captures actual maintenance performance data.
Fields to update:
-
KPI Name
-
Month (use the first date of the month)
-
MTD (Month-to-Date) value
-
YTD (Year-to-Date) value
Here, users only need to update numeric values. Therefore, data entry remains quick and consistent.
2) Input_Target Sheet: Defining Maintenance Goals
This sheet captures target maintenance values.
Fields to update:
-
KPI Name
-
Month (use the first date of the month)
-
MTD target
-
YTD target
As a result, the dashboard automatically calculates performance against targets.
3) KPI Definition Sheet: Standardizing Maintenance KPIs
This sheet defines what each KPI represents.
Fields included:
-
KPI Number
-
KPI Group
-
KPI Name
-
Unit
-
Formula
-
Definition
-
Type (LTB or UTB)
This sheet improves clarity, alignment, and governance across maintenance teams.
Click to Purchases Aviation Maintenance KPI Dashboard in Power BI
Page-Wise Structure of the Aviation Maintenance KPI Dashboard in Power BI
The dashboard contains three well-designed pages, each serving a unique analytical purpose.
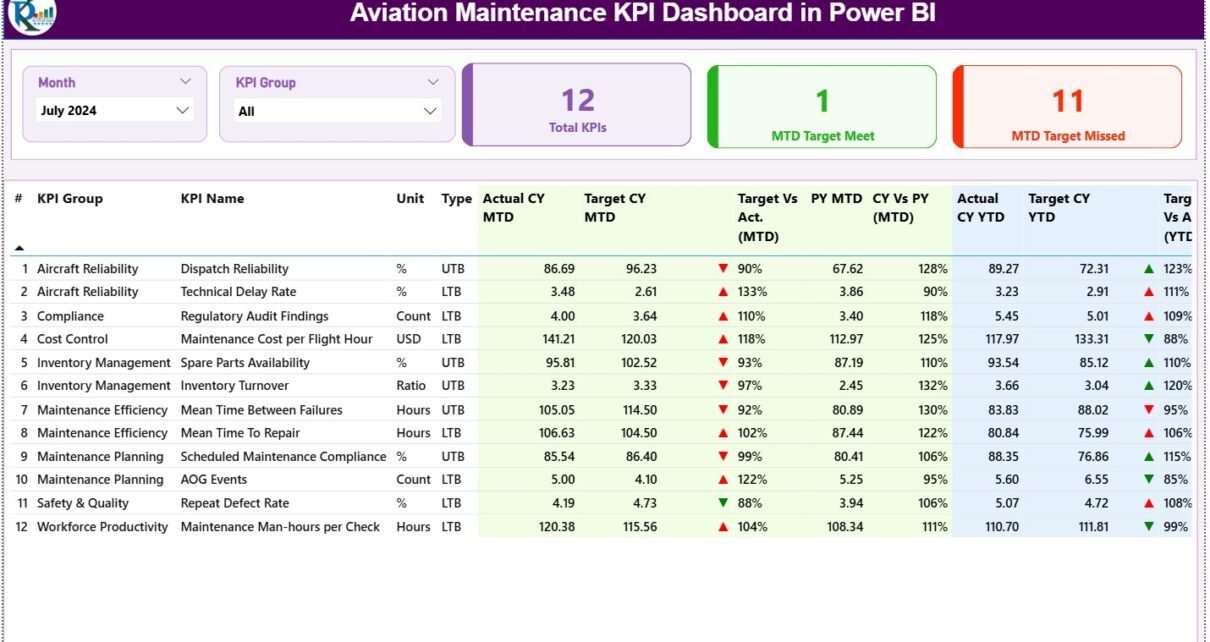
1) Summary Page: How Does the Maintenance Overview Work?
The Summary Page acts as the main control panel for aviation maintenance performance.
Top Filters and Slicers
At the top of the page, users see:
-
Month slicer
-
KPI Group slicer
These slicers allow users to filter maintenance data instantly. As a result, analysis becomes fast and focused.
KPI Cards: Quick Maintenance Status Check
Below the slicers, three KPI cards provide a quick snapshot:
-
Total KPIs Count
-
MTD Target Met Count
-
MTD Target Missed Count
These cards help managers instantly understand maintenance health without scrolling through detailed tables.
Detailed KPI Performance Table
The detailed table provides KPI-level insights.
Columns included:
-
KPI Number – Sequential identifier
-
KPI Group – Maintenance category
-
KPI Name – KPI description
-
Unit – Measurement unit
-
Type –
-
LTB (Lower the Better)
-
UTB (Upper the Better)
-
MTD Performance Metrics Explained
-
Actual CY MTD – Current year actual MTD value
-
Target CY MTD – Current year target MTD value
-
MTD Icon –
-
▲ Green indicates target met
-
▼ Red indicates target missed
-
-
Target vs Actual (MTD)
-
Formula:
Actual MTD / Target MTD
-
-
PY MTD – Previous year MTD value
-
CY vs PY (MTD)
-
Formula:
Current Year MTD / Previous Year MTD
-
These metrics highlight short-term maintenance performance.
YTD Performance Metrics Explained
-
Actual CY YTD – Current year actual YTD value
-
Target CY YTD – Current year target YTD value
-
YTD Icon –
-
▲ Green for target achieved
-
▼ Red for target missed
-
-
Target vs Actual (YTD)
-
Formula:
Actual YTD / Target YTD
-
-
PY YTD – Previous year YTD value
-
CY vs PY (YTD)
-
Formula:
Current Year YTD / Previous Year YTD
-
As a result, teams can track long-term maintenance efficiency.
Click to Purchases Aviation Maintenance KPI Dashboard in Power BI
2) KPI Trend Page: How Can You Track Maintenance Trends?
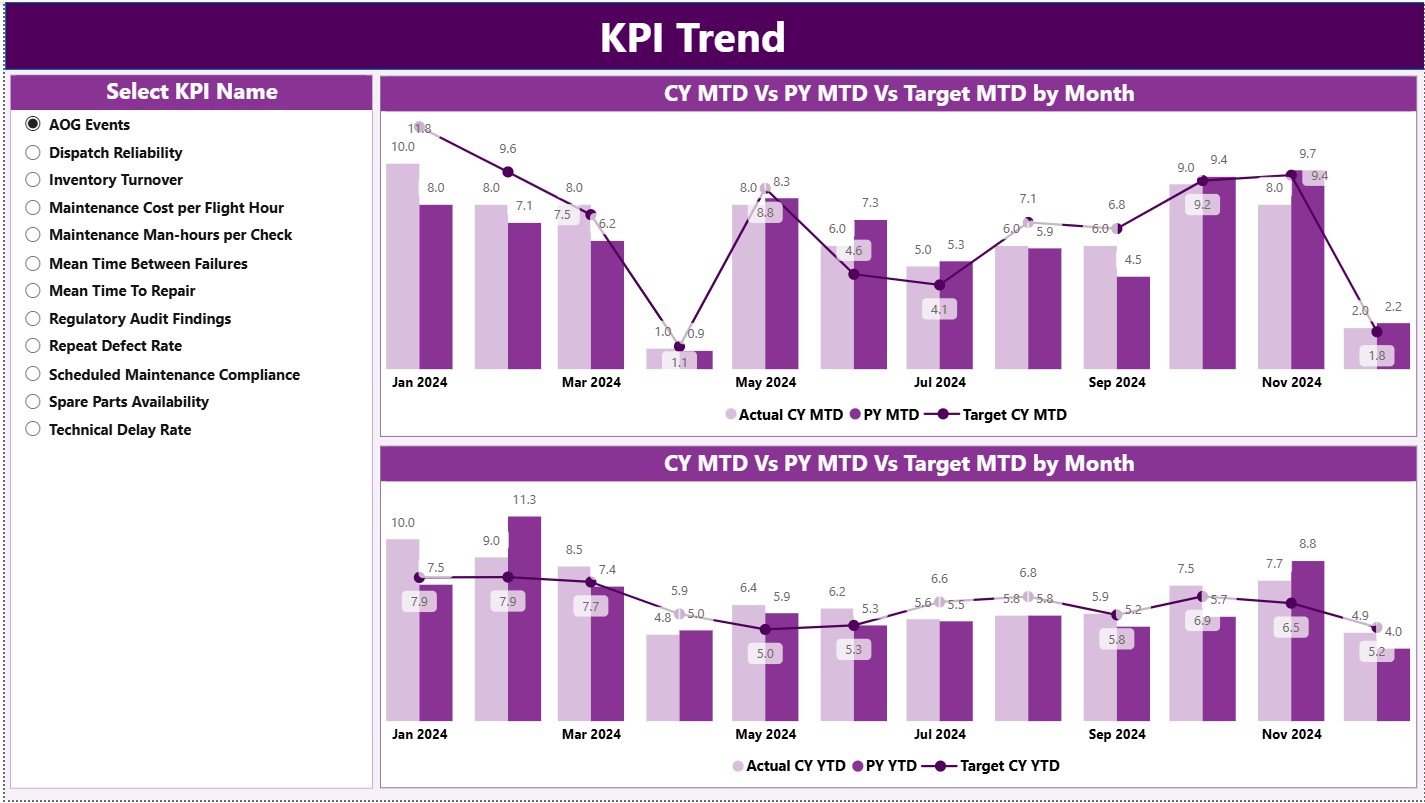
The KPI Trend Page focuses on performance movement over time.
Visuals on the Trend Page
This page includes two combo charts:
-
MTD Trend Chart
-
YTD Trend Chart
Each chart displays:
-
Current Year Actual values
-
Previous Year Actual values
-
Target values
KPI Selection Slicer
A slicer on the left allows users to select a specific KPI. Consequently, both charts update instantly to reflect trends for that KPI.
This feature helps users:
-
Identify recurring maintenance issues
-
Compare year-over-year performance
-
Evaluate target accuracy
3) KPI Definition Page: Why Is Drill-Through Important?
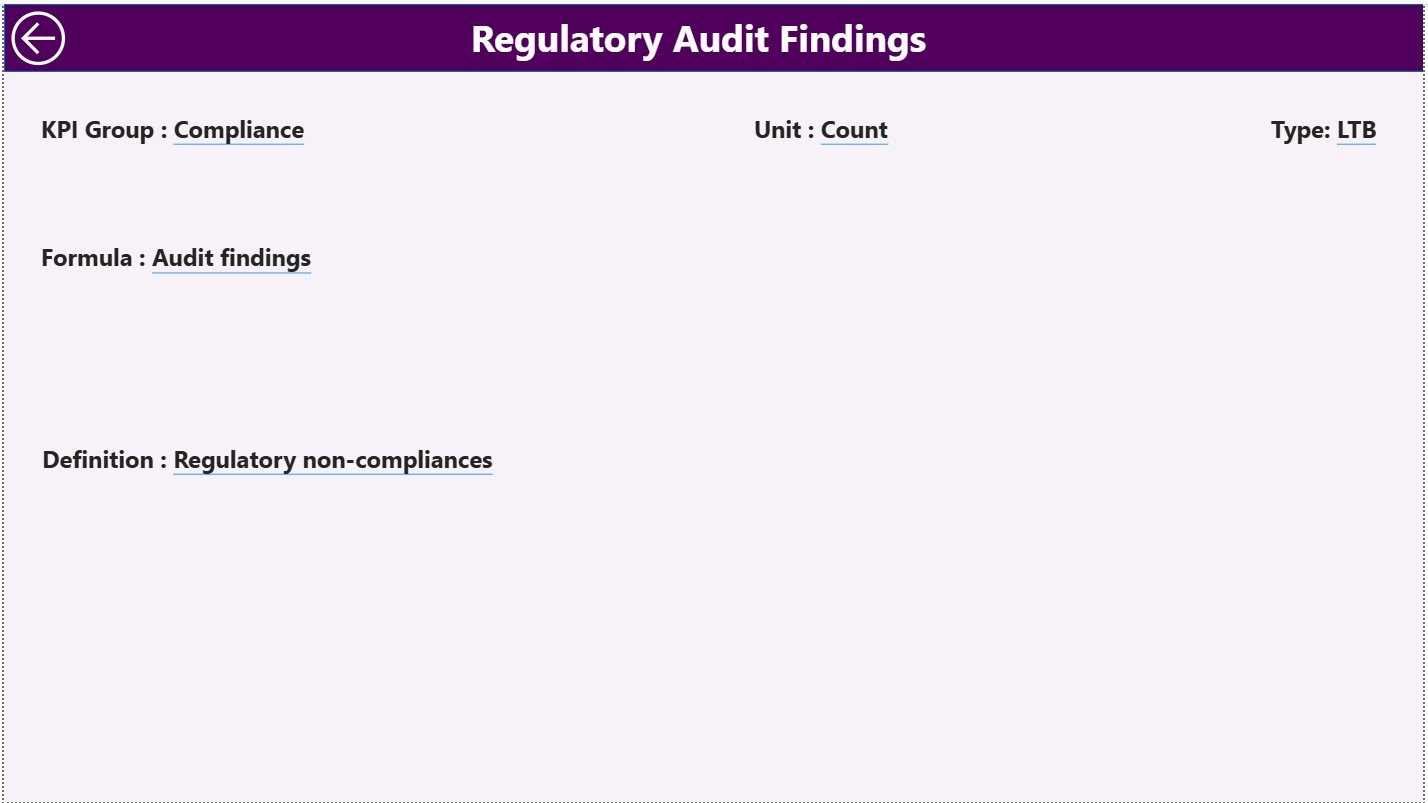
The KPI Definition Page serves as a drill-through reference page.
This page remains hidden from direct navigation. However, users can drill through from the Summary Page to access it.
Information Available on This Page
-
KPI Formula
-
KPI Definition
-
KPI Type (LTB or UTB)
This page ensures transparency and prevents misinterpretation of KPIs.
Navigation Tip
To return to the Summary Page, simply click the Back button at the top-left corner.
Advantages of Aviation Maintenance KPI Dashboard in Power BI
Implementing this dashboard delivers significant operational and strategic benefits.
Key Advantages
✈️ Centralized maintenance performance tracking
✈️ Faster decision-making
✈️ Improved aircraft availability
✈️ Reduced downtime and delays
✈️ Clear visibility into target achievement
✈️ Easy Excel-based data updates
✈️ Interactive and intuitive visuals
As a result, aviation teams gain better control over maintenance operations.
Click to Purchases Aviation Maintenance KPI Dashboard in Power BI
How Does This Dashboard Improve Maintenance Decision-Making?
The dashboard converts raw maintenance data into actionable insights.
Decision-Making Benefits
-
Identify underperforming maintenance KPIs early
-
Prioritize corrective maintenance actions
-
Monitor compliance with maintenance schedules
-
Improve workforce and resource planning
-
Align maintenance goals with operational strategy
Therefore, management moves from reactive fixes to proactive planning.
Best Practices for the Aviation Maintenance KPI Dashboard in Power BI
To maximize the dashboard’s effectiveness, follow these best practices.
Data Management Best Practices
-
Update Excel data regularly
-
Use consistent KPI names across sheets
-
Always use the first date of the month
-
Validate data before refreshing Power BI
Dashboard Usage Best Practices
-
Review MTD KPIs weekly
-
Analyze YTD trends monthly
-
Use KPI groups for focused analysis
-
Drill through definitions when needed
Governance Best Practices
-
Standardize KPI definitions
-
Document formulas clearly
-
Limit manual overrides
-
Train users on KPI interpretation
By following these practices, organizations ensure long-term dashboard success.
Click to Purchases Aviation Maintenance KPI Dashboard in Power BI
Who Should Use an Aviation Maintenance KPI Dashboard in Power BI?
This dashboard serves multiple aviation stakeholders.
Ideal Users
-
Aviation Maintenance Managers
-
Aircraft Engineers
-
Maintenance Planners
-
Operations Analysts
-
Airline Leadership Teams
Each group benefits from data-driven insights without technical complexity.
Conclusion: Why Is an Aviation Maintenance KPI Dashboard in Power BI Essential?
An Aviation Maintenance KPI Dashboard in Power BI helps aviation organizations monitor performance with clarity, speed, and confidence.
Instead of relying on manual reports and delayed insights, this dashboard provides real-time visibility into maintenance efficiency, target achievement, and trends. Moreover, its Excel-based data structure ensures ease of use, while Power BI visuals deliver powerful insights.
Therefore, if your goal is to improve aircraft availability, reduce maintenance delays, and strengthen safety and compliance, this dashboard becomes an essential tool.
Click to Purchases Aviation Maintenance KPI Dashboard in Power BI
Frequently Asked Questions (FAQs)
What is an Aviation Maintenance KPI Dashboard in Power BI used for?
It helps track maintenance KPIs, compare actual vs target performance, and analyze trends for better decision-making.
Do I need advanced Power BI knowledge to use this dashboard?
No. You only need basic Excel skills to update data and refresh the dashboard.
Can I customize KPIs in this dashboard?
Yes. You can add or modify KPIs by updating the Excel data and KPI definition sheet.
How often should maintenance data be updated?
You should update data weekly or monthly, depending on reporting needs.
Is this dashboard suitable for airlines and MROs?
Yes. It works for airlines, MRO providers, and aviation maintenance teams of all sizes.
Click to Purchases Aviation Maintenance KPI Dashboard in Power BI
Visit our YouTube channel to learn step-by-step video tutorials


