Managing celebrity contracts, endorsements, sponsored posts, and agency relationships becomes complex very quickly. Moreover, when data stays scattered across emails, PDFs, and multiple spreadsheets, tracking performance turns stressful and time-consuming. That is exactly why a Celebrity Management Dashboard in Excel becomes an essential business tool.
In this detailed, SEO-friendly article, you will learn what a Celebrity Management Dashboard in Excel is, why it is important, how it works, its page-wise structure, key features, advantages, best practices, and frequently asked questions. Additionally, the language remains clear, active, and easy to understand so that talent managers, agencies, finance teams, and analysts can use it without technical complexity.
Click to Purchases Celebrity Management Dashboard in Excel
What Is a Celebrity Management Dashboard in Excel?
A Celebrity Management Dashboard in Excel is a ready-to-use analytical template designed to track, analyze, and manage celebrity-related business activities in one centralized file.
Instead of manually reviewing contracts, invoices, and performance reports, this dashboard converts raw data into meaningful insights. As a result, decision-makers gain instant visibility into fees, expenses, commissions, net revenue, reach, engagement, and content performance.
Because the dashboard runs in Excel, it remains affordable, flexible, and easy to customize. Furthermore, users can apply filters, slicers, and charts without advanced technical skills.
Why Do You Need a Celebrity Management Dashboard in Excel?
Celebrity management involves multiple stakeholders, including talent managers, agencies, brands, and finance teams. Therefore, maintaining clarity becomes critical.
Here is why organizations increasingly rely on this dashboard:
-
Because it centralizes all celebrity data in one place
-
Because it simplifies revenue and expense tracking
-
Because it improves transparency across agencies and regions
-
Because it supports faster, data-driven decisions
-
Because it eliminates repetitive manual reporting
Without a structured dashboard, teams often miss trends, overlook costs, and lose revenue opportunities. However, with this Excel-based solution, everything stays visible and controlled.
How Does the Celebrity Management Dashboard in Excel Work?
The dashboard works by pulling structured data from a Data Sheet and transforming it into interactive visuals across multiple analysis pages.
Here is how the process flows:
-
First, users enter or update celebrity data in the Data Sheet
-
Next, Excel formulas and pivot tables process the information
-
Then, charts, cards, and KPIs update automatically
-
Finally, slicers allow users to filter results by category, agency, region, or time
As a result, users analyze performance instantly without manual calculations.
Click to Purchases Celebrity Management Dashboard in Excel
What Are the Key Features of the Celebrity Management Dashboard in Excel?
This dashboard includes powerful features that improve usability, analysis, and presentation.
Page Navigator for Easy Navigation
The Page Navigator, located on the left side, allows users to move seamlessly across all analytical pages. Instead of scrolling through tabs, users jump directly to the required analysis view.
This feature saves time and improves the overall user experience.
What Is Included in the Overview Page?
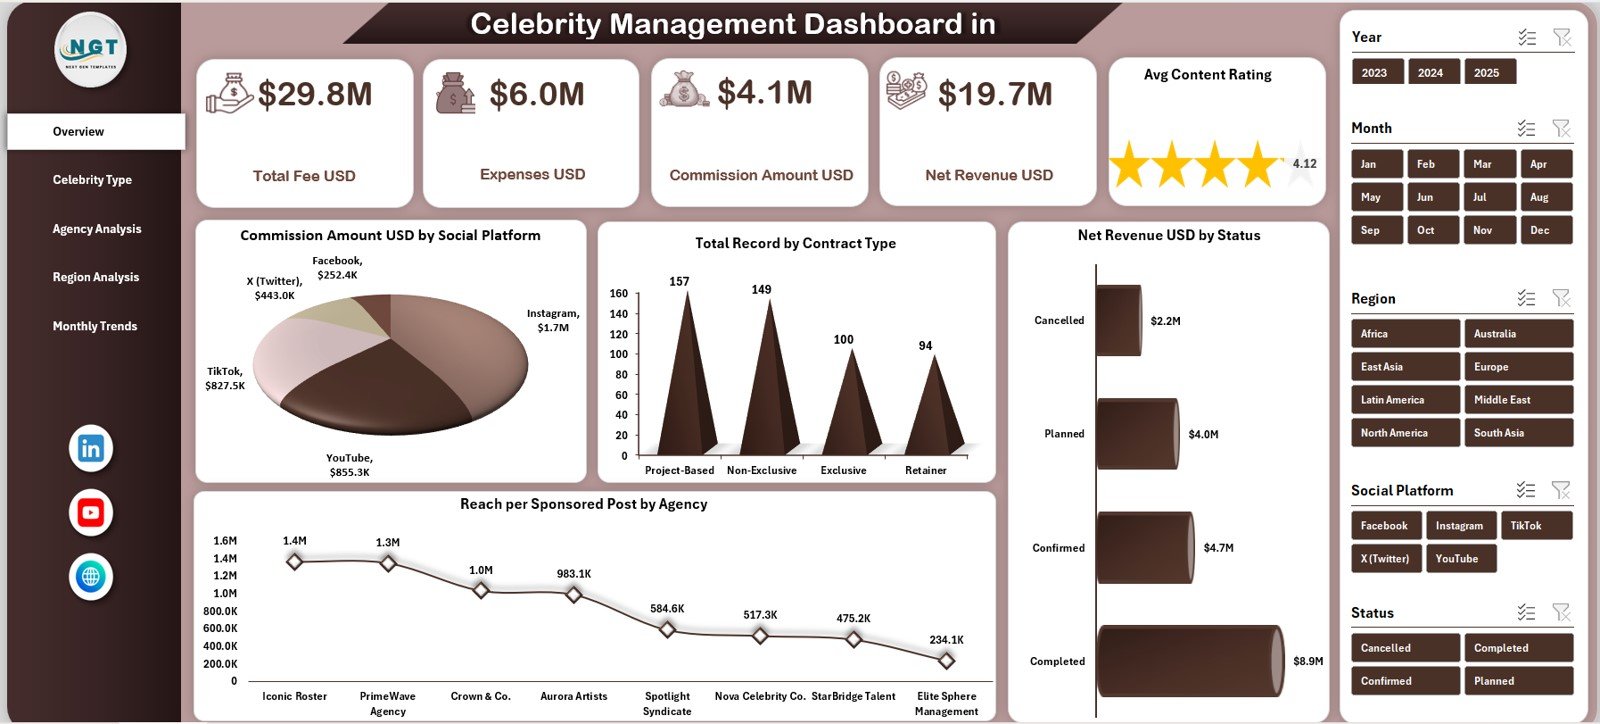
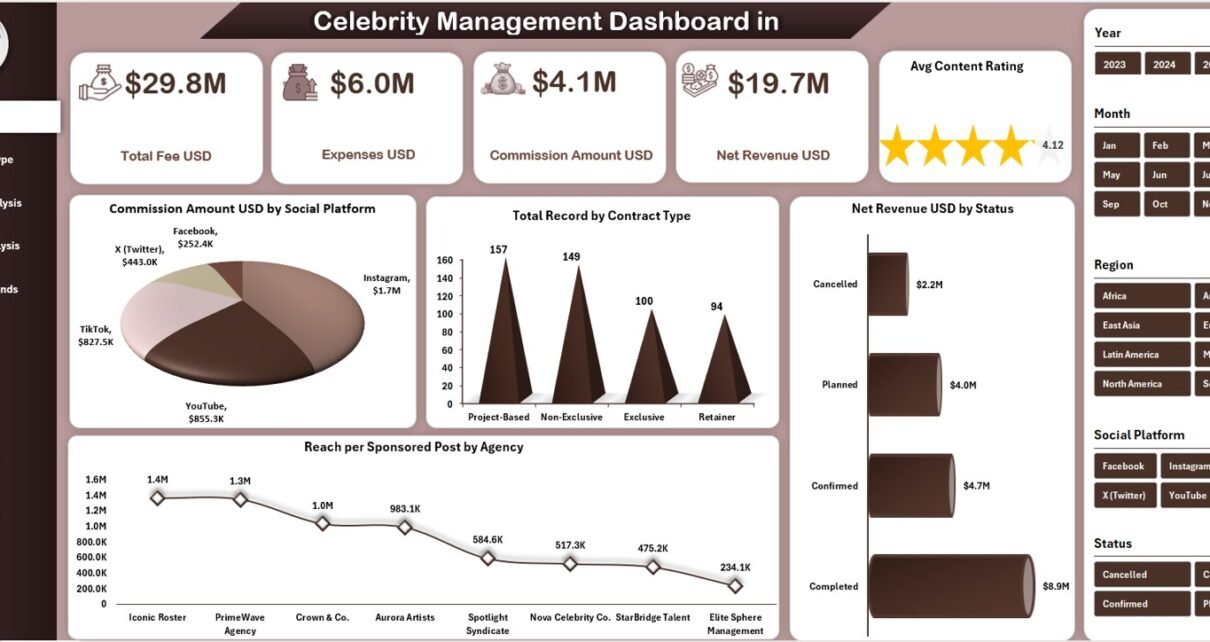
The Overview Page acts as the control center of the dashboard. It provides a high-level snapshot of financial and performance metrics.
KPI Cards on the Overview Page
The dashboard displays five key cards that summarize performance instantly:
-
Total Fee (USD) – Shows total contract fees earned
-
Expenses (USD) – Displays total costs incurred
-
Commission Amount (USD) – Highlights agency commissions
-
Net Revenue (USD) – Calculates profit after expenses and commission
-
Average Content Rating – Measures content quality and performance
Because these KPIs appear at the top, decision-makers understand overall health within seconds.
Charts on the Overview Page
The Overview Page also includes four insightful charts:
-
Commission Amount (USD) by Social Platform
-
Total Records by Contract Type
-
Net Revenue (USD) by Status
-
Reach per Sponsored Post by Agency
Together, these visuals provide clarity on revenue sources, deal types, and agency effectiveness.
Click to Purchases Celebrity Management Dashboard in Excel
How Does Celebrity Type Analysis Improve Insights?
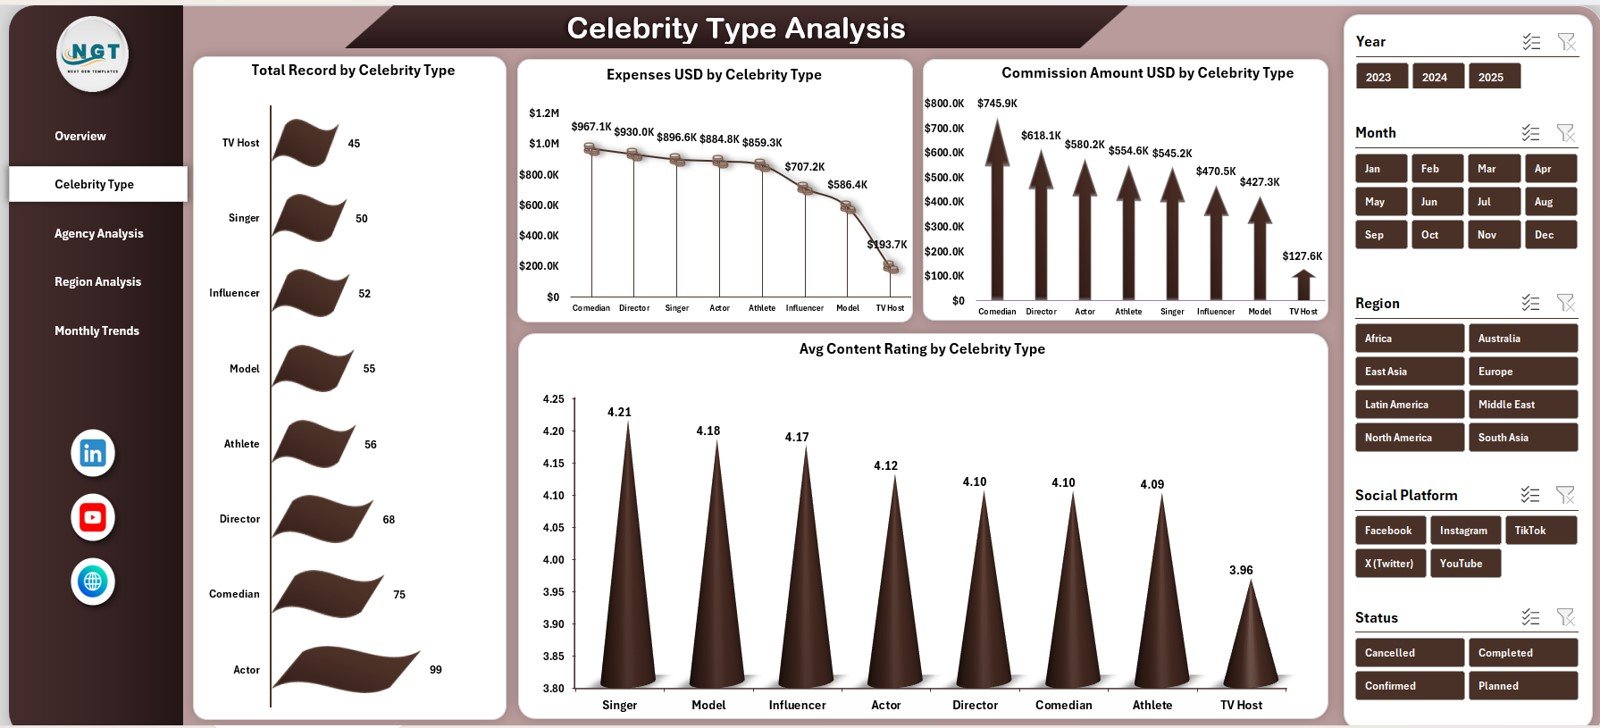
The Celebrity Type Analysis page focuses on performance based on celebrity categories such as actors, influencers, athletes, or musicians.
Charts on Celebrity Type Analysis Page
This page includes four charts:
-
Total Records by Celebrity Type
-
Expenses (USD) by Celebrity Type
-
Commission Amount (USD) by Celebrity Type
-
Average Content Rating by Celebrity Type
Because of this breakdown, managers easily identify which celebrity categories deliver higher value and better engagement.
Why Is Agency Analysis Important?
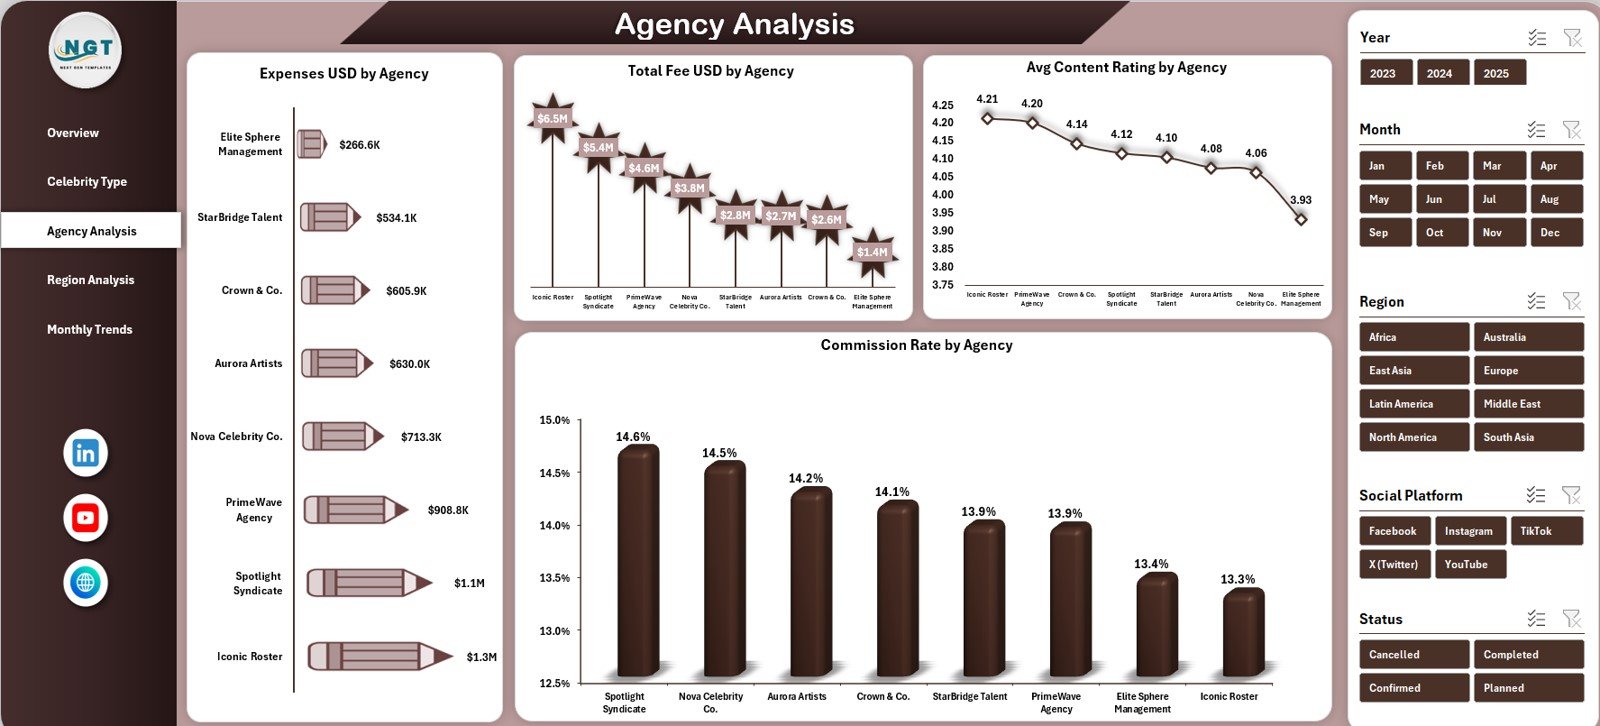
Agencies play a critical role in celebrity management. Therefore, understanding agency performance becomes essential.
Charts on the Agency Analysis Page
The Agency Analysis page includes four focused charts:
-
Expenses (USD) by Agency
-
Total Fee (USD) by Agency
-
Average Content Rating by Agency
-
Commission Rate by Agency
With this view, teams evaluate agency efficiency, negotiate better contracts, and strengthen partnerships.
Click to Purchases Celebrity Management Dashboard in Excel
What Insights Does Region Analysis Provide?
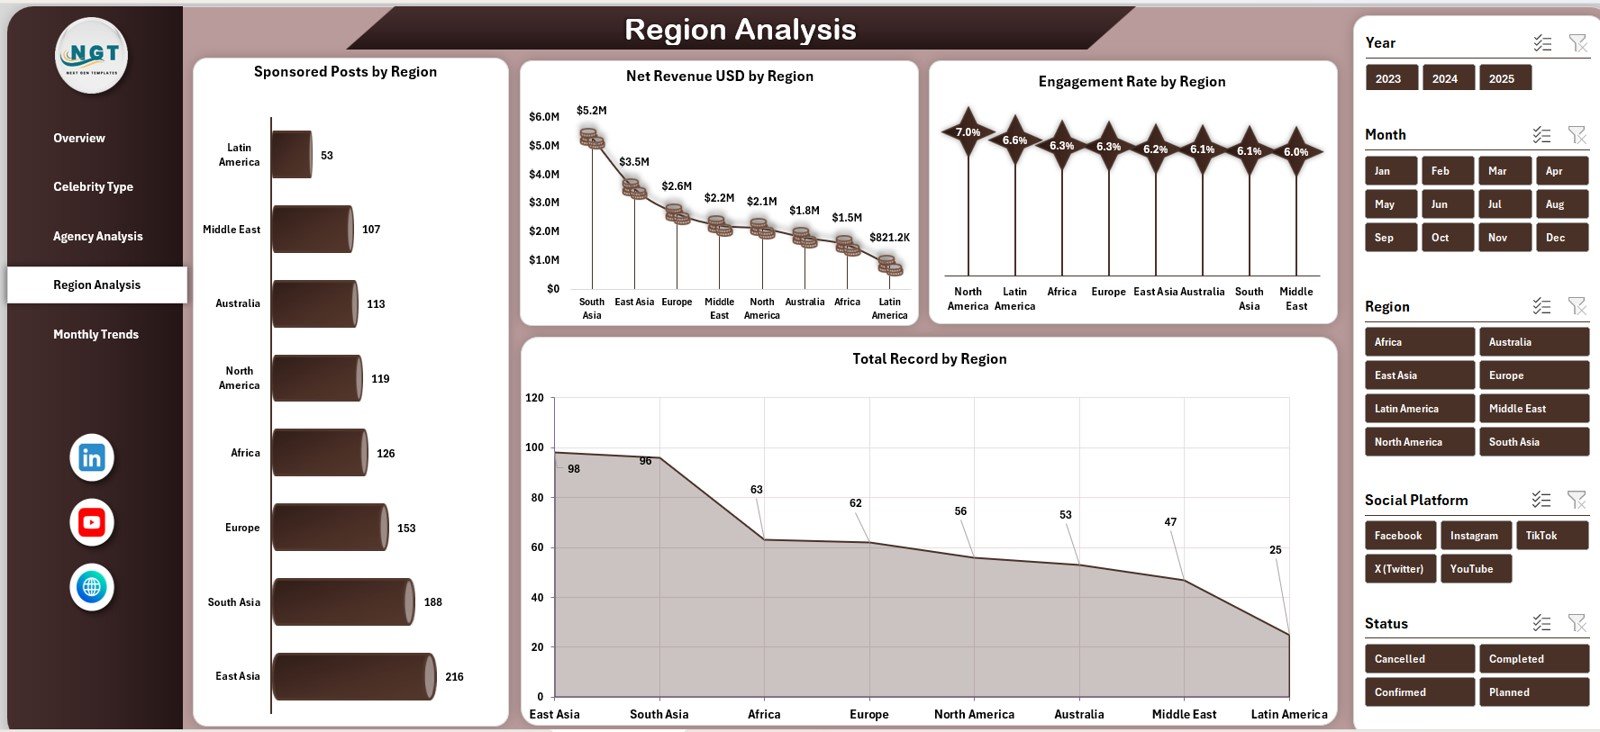
Celebrity campaigns often span multiple regions. Hence, regional analysis helps optimize marketing strategies.
Charts on the Region Analysis Page
This page includes four charts:
-
Sponsored Posts by Region
-
Net Revenue (USD) by Region
-
Engagement Rate by Region
-
Total Records by Region
As a result, managers understand where campaigns perform best and where improvement is required.
How Do Monthly Trends Help Strategic Planning?
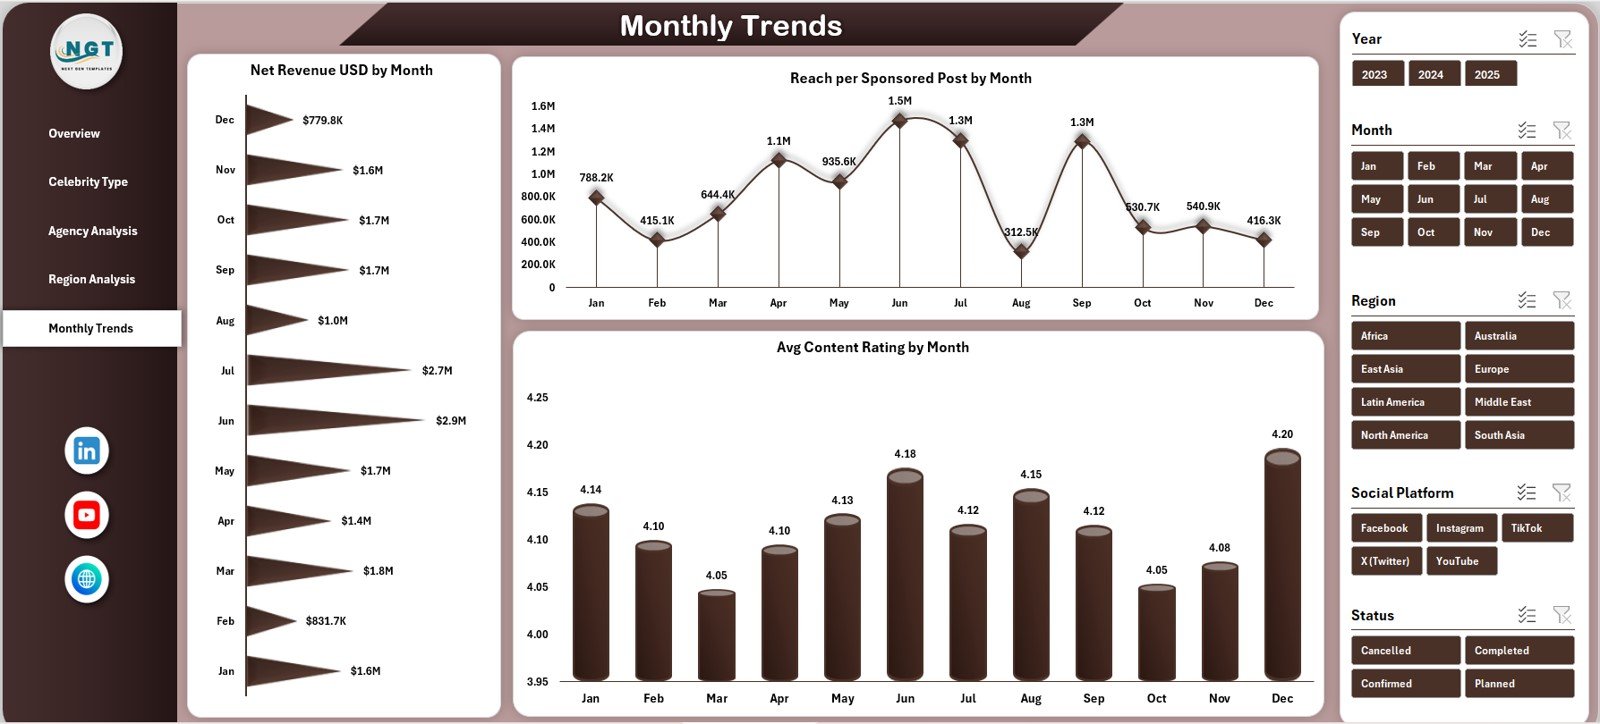
Trends reveal patterns that static reports cannot show. Therefore, the Monthly Trends page becomes extremely valuable.
Charts on the Monthly Trends Page
This page includes three time-based charts:
-
Net Revenue (USD) by Month
-
Reach per Sponsored Post by Month
-
Average Content Rating by Month
Because of these visuals, teams spot growth patterns, seasonal spikes, and performance dips early.
Click to Purchases Celebrity Management Dashboard in Excel
What Is the Role of the Data Sheet?
The Data Sheet acts as the backbone of the dashboard.
It stores all raw information such as:
-
Celebrity name and type
-
Agency name
-
Contract type and status
-
Fees, expenses, and commission rates
-
Region and social platform
-
Sponsored post reach and engagement
-
Content ratings and dates
Once users update this sheet, all dashboards refresh automatically.
Advantages of Celebrity Management Dashboard in Excel
Using a Celebrity Management Dashboard in Excel delivers several practical advantages.
Key Advantages
-
Centralizes all celebrity-related data
-
Improves visibility into revenue and costs
-
Reduces manual reporting effort
-
Enhances decision-making accuracy
-
Supports performance comparison across agencies and regions
-
Saves time with automated calculations
-
Works without expensive software
Because Excel remains widely used, teams adopt this dashboard quickly without training challenges.
Who Can Use This Dashboard?
This dashboard benefits a wide range of professionals, including:
-
Celebrity managers and talent agencies
-
Brand partnerships and influencer marketing teams
-
Finance and accounting departments
-
Marketing analysts and consultants
-
Media and entertainment companies
Each role gains clear insights tailored to their needs.
Click to Purchases Celebrity Management Dashboard in Excel
Best Practices for the Celebrity Management Dashboard in Excel
To get the best results, follow these proven best practices.
Best Practices
-
Update the Data Sheet regularly to maintain accuracy
-
Standardize contract types and statuses
-
Use slicers before drawing conclusions
-
Review Monthly Trends consistently
-
Compare agencies using multiple KPIs, not one metric
-
Validate expense and commission entries carefully
-
Archive old data to keep the file lightweight
By following these practices, the dashboard remains reliable and effective.
How Does This Dashboard Support Better Decision-Making?
The dashboard turns raw numbers into actionable insights. Therefore, leaders identify profitable partnerships, control costs, and improve content strategies.
Moreover, because visuals update instantly, teams respond faster to performance changes. As a result, business outcomes improve consistently.
Conclusion
The Celebrity Management Dashboard in Excel provides a structured, visual, and powerful solution for managing celebrity deals, revenue, and performance. Instead of struggling with scattered data, teams gain clarity, control, and confidence.
Because it combines financial tracking, performance analysis, and trend monitoring in one file, this dashboard becomes an essential tool for modern celebrity management. With proper data input and best practices, organizations unlock smarter decisions and sustainable growth.
Click to Purchases Celebrity Management Dashboard in Excel
Frequently Asked Questions (FAQs)
What is a Celebrity Management Dashboard in Excel?
It is a ready-to-use Excel dashboard that tracks celebrity contracts, fees, expenses, commissions, revenue, and performance metrics.
Who should use this dashboard?
Talent managers, agencies, finance teams, marketing professionals, and entertainment companies benefit the most.
Do I need advanced Excel skills to use it?
No. The dashboard uses standard Excel features like slicers, charts, and pivot tables.
Can I customize the dashboard?
Yes. Users can modify charts, KPIs, and layouts based on business needs.
How often should I update the data?
You should update the Data Sheet regularly, preferably weekly or monthly.
Does the dashboard support multiple regions and agencies?
Yes. It includes dedicated analysis for regions and agencies.
Is this dashboard suitable for influencer marketing?
Absolutely. It works well for influencers, celebrities, and brand partnerships.
Click to Purchases Celebrity Management Dashboard in Excel
Visit our YouTube channel to learn step-by-step video tutorials