Home>Blogs>Dashboard>Comparative Analysis Dashboard in Excel>Comparative Analysis Dashboard in Excel-4
Comparative Analysis Dashboard in Excel-4
20
Jun 2021
158Comments Off on Comparative Analysis Dashboard in Excel-4
PK
Meet PK, the founder of PK-AnExcelExpert.com! With over 15 years of experience in Data Visualization, Excel Automation, and dashboard creation. PK is a Microsoft Certified Professional who has a passion for all things in Excel. PK loves to explore new and innovative ways to use Excel and is always eager to share his knowledge with others. With an eye for detail and a commitment to excellence, PK has become a go-to expert in the world of Excel. Whether you're looking to create stunning visualizations or streamline your workflow with automation, PK has the skills and expertise to help you succeed. Join the many satisfied clients who have benefited from PK's services and see how he can take your Excel skills to the next level!
https://www.pk-anexcelexpert.com
Related Articles
Sales and Marketing Resource Allocation KPI Dashboard in Excel
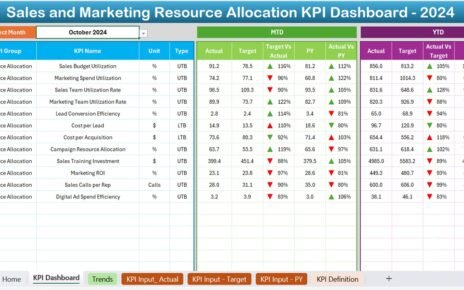
In today's competitive business world, optimizing your sales and marketing resources is no longer optional—it's essential. Every decision, campaign, or
SEO Performance KPI Dashboard in Power BI
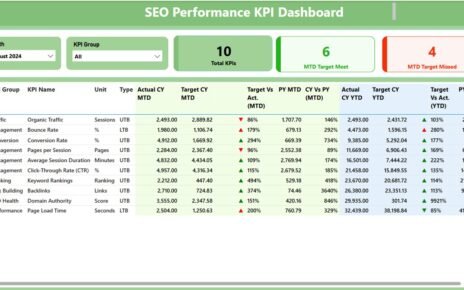
As digital marketing continues to evolve, businesses are increasingly relying on data-driven insights to optimize their online presence. One of
Food Service KPI Dashboard in Excel
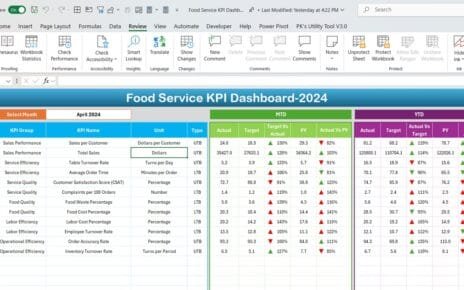
In the Food Service KPI Dashboard in Excel industry, keeping a close eye on performance is essential to stay competitive.