In the construction industry, safety isn’t just a compliance requirement—it’s a matter of life and death. While traditional methods for tracking safety metrics often fall short, modern tools like Power BI offer a powerful, visual, and data-driven approach. Enter the Construction Safety KPI Dashboard in Power BI – a ready-to-use, highly interactive dashboard that allows construction teams to track and analyze safety performance in real time.
This article explores everything you need to know about this dashboard, from key features and benefits to best practices and frequently asked questions.
Click to Purchases Construction Safety KPI Dashboard in Power BI
What Is a Construction Safety KPI Dashboard in Power BI?
A Construction Safety KPI Dashboard in Power BI is a digital tool used to monitor and evaluate key performance indicators (KPIs) related to safety in construction projects. This dashboard connects to an Excel data source, pulls in actuals and targets, and visually displays performance trends, comparisons, and status indicators to help safety managers and decision-makers stay proactive.
Key Features of the Construction Safety KPI Dashboard
The dashboard includes three main pages, each serving a specific purpose:
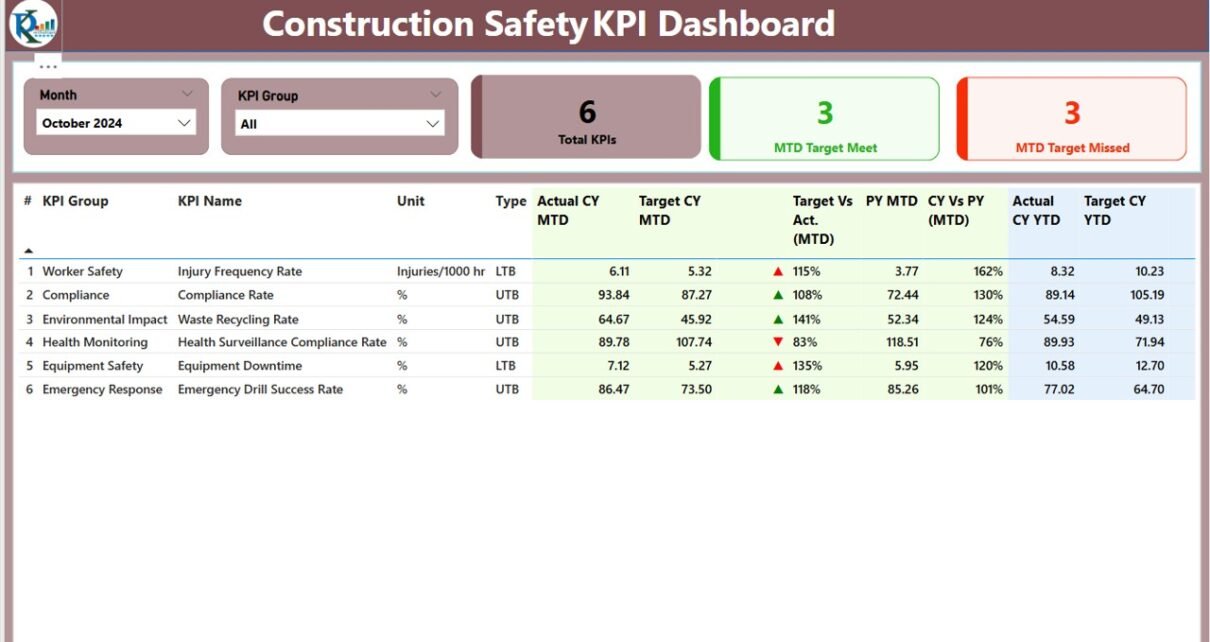
Summary Page
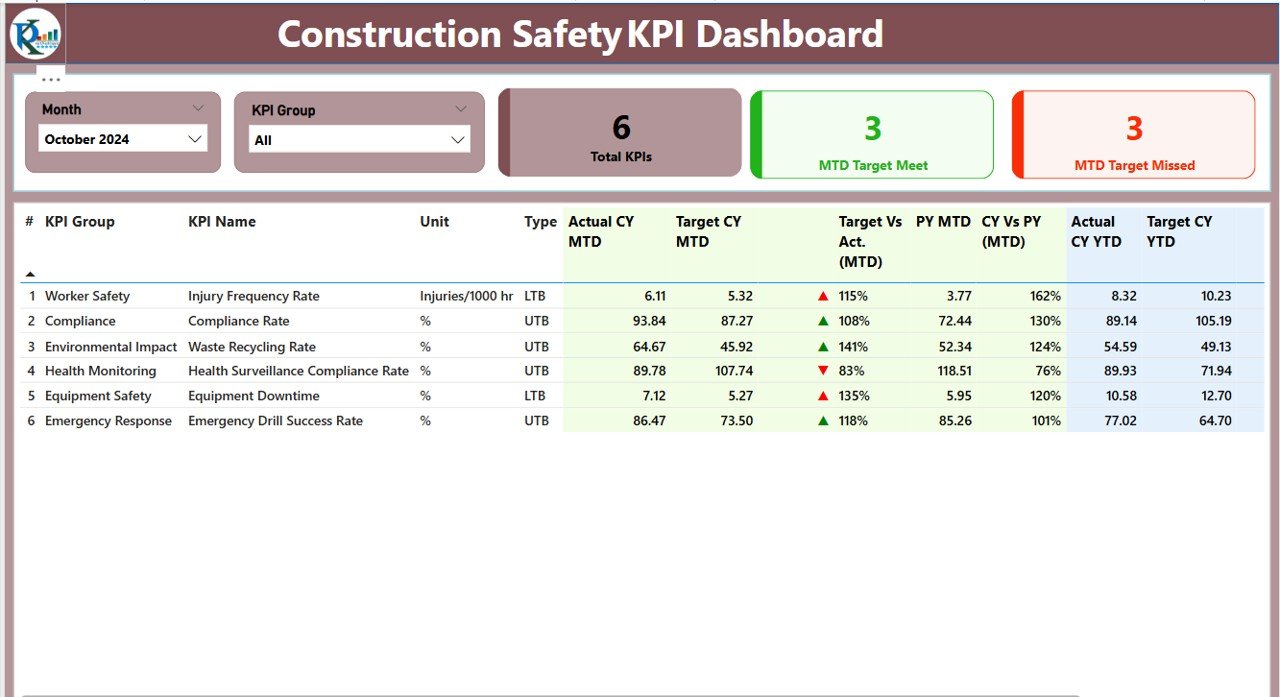
This is the main page where you’ll see an overall picture of safety performance.
- Top Slicers: Easily filter by Month and KPI Group.
Cards Display:
- Total KPIs Count
- MTD Target Met Count
- MTD Target Missed Count
Detailed Table Includes:
- KPI Number: Sequential identifier.
- KPI Group: Category or group of KPI.
- KPI Name: Descriptive name of the KPI.
- Unit: Measurement unit (e.g., incidents, days).
- Type: LTB (Lower the Better) or UTB (Upper the Better).
- Actual CY MTD: Current Month-to-Date actual value.
- Target CY MTD: Target for the current MTD.
- MTD Icon: Green/Red arrow indicating performance status.
- Target Vs Actual (MTD): (Actual / Target) * 100%
- PY MTD: Last year’s MTD actuals.
- CY Vs PY (MTD): (CY MTD / PY MTD) * 100%
- Actual CY YTD: Current Year-to-Date actual value.
- Target CY YTD: YTD target value.
- YTD Icon: Green/Red arrow indicating status.
- Target Vs Actual (YTD): (Actual / Target) * 100%
- PY YTD: Previous Year YTD value.
- CY Vs PY (YTD): (CY YTD / PY YTD) * 100%
KPI Trend Page
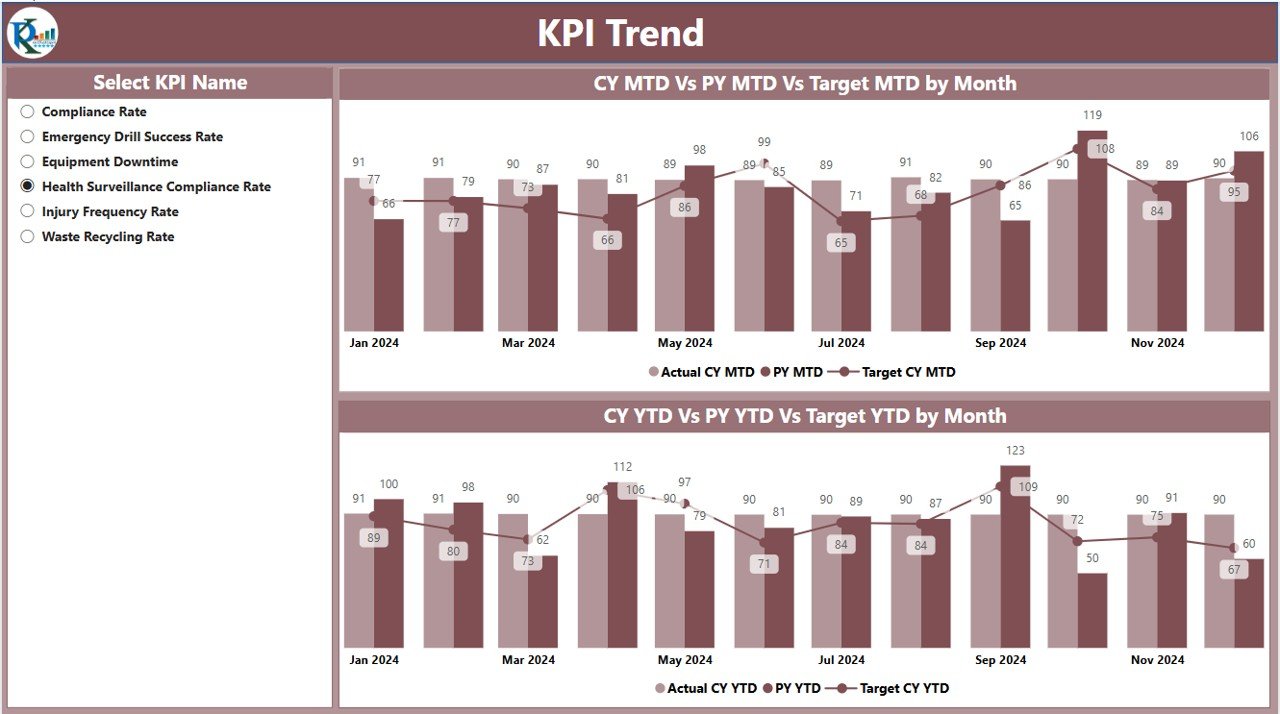
Two Combo Charts:
- One for MTD Actual, PY, and Target
- Another for YTD Actual, PY, and Target
- KPI Slicer: Lets users drill down to specific KPIs for detailed trend analysis.
KPI Definition Page
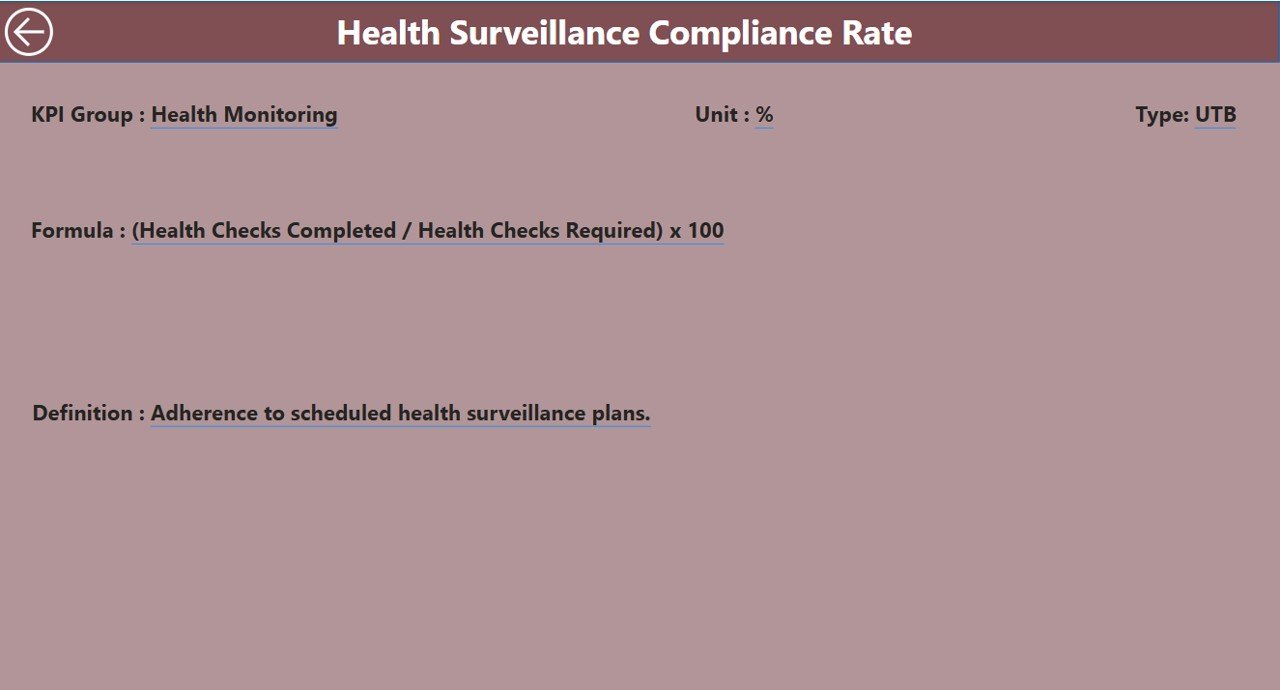
This hidden drill-through page provides the background context and definitions of each KPI:
- Formula: Explains how the KPI is calculated.
- Definition: Clear explanation of what the KPI represents.
- Type: Whether lower or higher values are preferred.
Click to Purchases Construction Safety KPI Dashboard in Power BI
How Excel Data Powers the Dashboard
The dashboard reads data from a structured Excel file with three sheets:
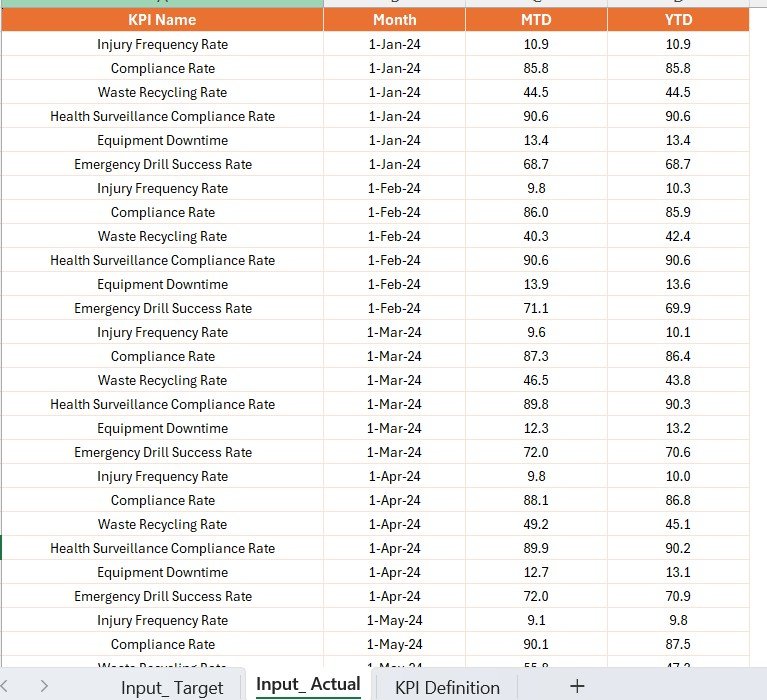
1. Input_Actual Sheet
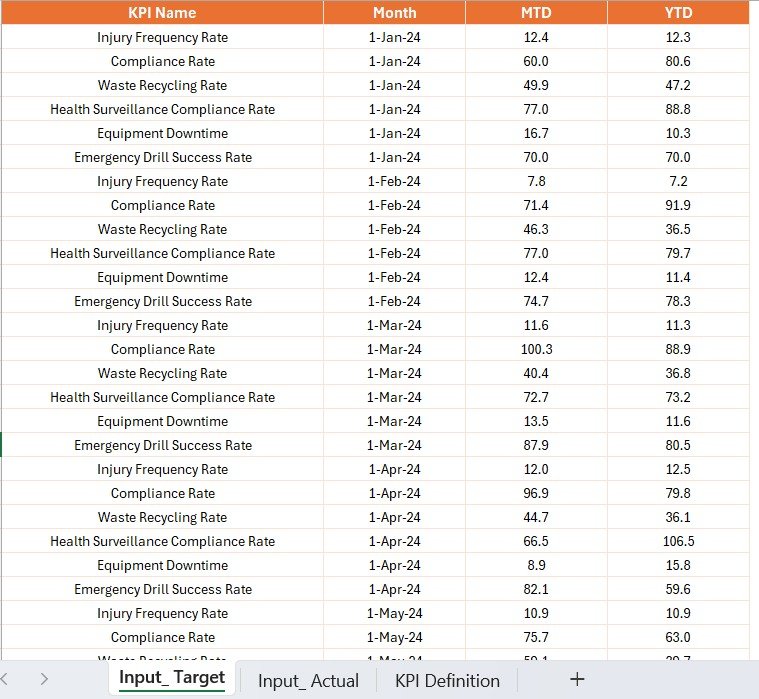
- Fields: KPI Name, Month (first date of the month), MTD Number, YTD Number
- Purpose: Records actual performance data
2. Input_Target Sheet
- Fields: KPI Name, Month (first date), MTD Target, YTD Target
- Purpose: Sets benchmark goals for comparison
3. KPI Definition Sheet

- Fields: KPI Number, KPI Group, KPI Name, Unit, Formula, Definition, Type (LTB/UTB)
- Purpose: Provides context and classification
Why Use a Construction Safety Dashboard?
Click to Purchases Construction Safety KPI Dashboard in Power BI
Monitoring safety KPIs manually can be inefficient and prone to error. This dashboard solves that by offering:
- Real-time visibility
- Instant trend analysis
- Immediate identification of underperforming areas
- Better team accountability
- A central, standardized reporting tool
Advantages of Using a Construction Safety KPI Dashboard
📊 Improved Decision Making
Quickly identify which safety metrics are off-track and take timely corrective actions.
📅 Time Efficiency
Automates reporting, reducing the time spent on manual data entry and analysis.
📈 Historical Trend Analysis
Easily compare current metrics with previous periods to evaluate progress.
🔄 Real-Time Collaboration
Multiple users can view and interact with the dashboard simultaneously, ensuring alignment.
🌐 Accessible & User-Friendly
Even non-technical users can filter, sort, and interpret the data with ease.
Best Practices for Building and Using the Dashboard
To get the most out of your Construction Safety KPI Dashboard in Power BI, follow these tips:
1. Keep Your Data Clean and Updated
Ensure the Excel sheets are updated regularly. Use consistent date formats and avoid duplicates.
2. Use Consistent KPI Naming
Standardize names and formats across the input sheets and KPI definition sheet.
3. Limit Manual Edits in Power BI
Use Power BI for visualization only. Keep all data input and definitions in Excel.
4. Use Clear Color Coding
Use green and red arrows for quick performance insights—green for meeting/exceeding targets, red for missing them.
5. Schedule Automatic Refreshes
Set up Power BI to refresh the dashboard at regular intervals, especially if the Excel source updates frequently.
6. Protect Data Integrity
Restrict editing access to Excel files to avoid data errors.
How to Navigate the Dashboard
The dashboard is designed to be simple and intuitive. Here’s how to make the most of it:
- Filter by Month and KPI Group using the slicers on the Summary Page.
- Click on a KPI row in the table to drill through to its definition.
- Use the Back button (top-left corner) to return to the Summary Page.
- Check the Combo Charts in the KPI Trend Page for visual comparison over time.
Use Cases Across the Construction Industry
The Construction Safety KPI Dashboard fits a variety of scenarios:
- Large infrastructure projects to track safety across sites
- Contractor management by assessing each vendor’s safety performance
- Regulatory audits with easy-to-export reports
- Management reporting during project review meetings
Conclusion
Safety should never be reactive. With the Construction Safety KPI Dashboard in Power BI, you take control of your safety metrics in a visually powerful, real-time, and structured way. It ensures not just compliance but also commitment to creating a safer work environment for everyone involved.
Whether you’re a project manager, safety officer, or executive, this tool empowers you to monitor, analyze, and improve safety KPIs consistently and confidently.
Frequently Asked Questions (FAQs)
1. What are the most common safety KPIs in construction?
Some of the most important KPIs include:
- Lost Time Injury Frequency Rate (LTIFR)
- Total Recordable Incident Rate (TRIR)
- Near Miss Reporting Rate
- Incident Severity Rate
Click to Purchases Construction Safety KPI Dashboard in Power BI
2. Can I customize this dashboard for my organization?
Yes, the dashboard is built to be flexible. You can edit the Excel data source to add or modify KPIs.
3. Is the Excel data connected in real-time to Power BI?
You can enable scheduled refreshes so Power BI automatically updates the dashboard when Excel data changes.
4. Do I need advanced Power BI skills to use this dashboard?
No. This is a ready-to-use template with intuitive design and simple navigation features.
5. Can this dashboard be shared with others?
Yes. You can publish it to the Power BI Service and share it with your team using access controls.
Click to Purchases Construction Safety KPI Dashboard in Power BI
Visit our YouTube channel to learn step-by-step video tutorials