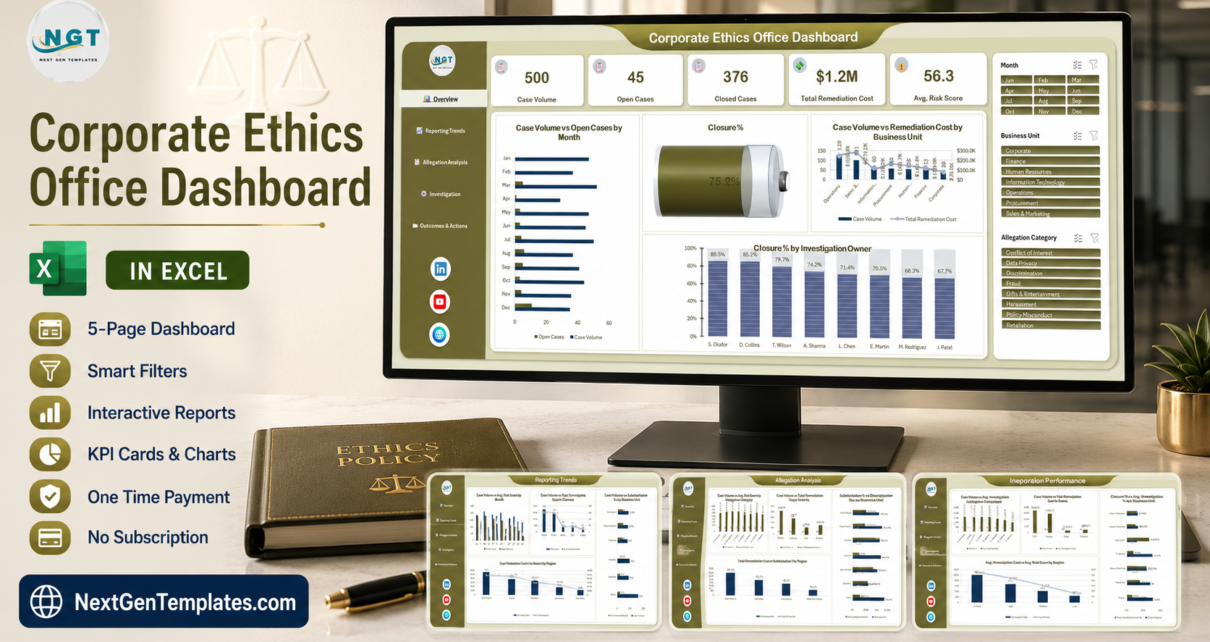
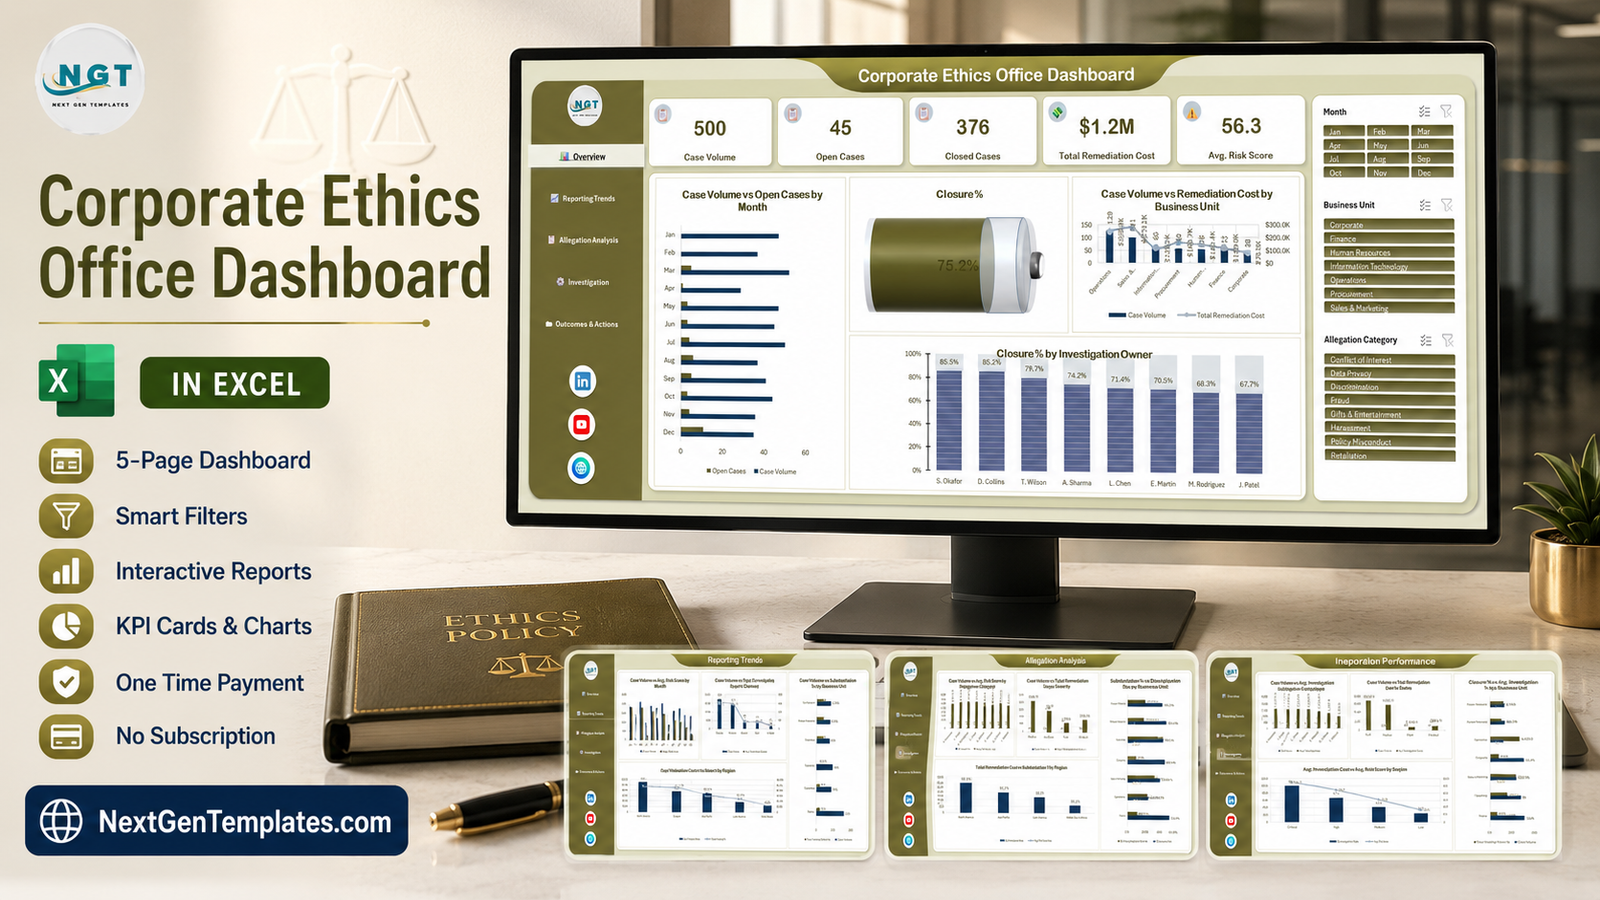
Most ethics and compliance offices already collect the data. The hotline log has every intake, the investigation folder has every close-out date, and finance has every remediation invoice. What is usually missing is a single view that puts them side by side so the board can be told, in one sentence, how big the caseload is and how much of it is finished. The Corporate Ethics Office Dashboard in Excel is that view: five slicer-linked report pages built over a 500-row case log, with 45 cases still open, 376 closed, $1.2M of recorded remediation cost, a 56.3 average risk score and a 75.2% closure rate on the sample data.
It is worth being blunt about what it is not, because this subject deserves it. This workbook analyses data you enter. It is not an ethics hotline, not an intake channel, not a case management system and not a system of record. It offers no confidentiality, no anonymity, no encryption, no access control and no audit trail, and it does not make an organisation compliant with any law, regulation or standard. A real reporting channel needs a purpose-built confidential system with proper access rules. Keep identifying details of reporters and subjects out of this file and paste in coded, summarised rows instead.
One more clarification, because the names in this catalogue run close together: this is the analytical Excel dashboard line – five wide pages driven by a shared slicer rail, built for exploring a whole caseload. It is not a monthly KPI scorecard with a month picker, target-versus-actual columns and traffic lights, and it is not a KPI dashboard. Those are separate templates with a different layout.
Key Features of the Corporate Ethics Office Dashboard in Excel
- Five report pages behind one navigation rail – Overview, Reporting Trends, Allegation Analysis, Investigation Performance and Outcomes & Actions, each one click from the others.
- Five headline KPI cards on the Overview – Case Volume 500, Open Cases 45, Closed Cases 376, Total Remediation Cost $1.2M and Avg. Risk Score 56.3.
- Three slicers repeated on every page – Month, Business Unit (seven units) and Allegation Category (eight categories) – so a filter set once reads the same everywhere.
- A closure gauge that resolves the whole caseload to one number: 75.2% closed on the sample data.
- Nineteen charts across the five pages, every one driven by pivot tables rather than hard-typed numbers.
- A 500-row Data sheet with 17 source columns – Case ID, Report Date, Business Unit, Region, Report Channel, Allegation Category, Severity, Investigation Owner, Reporter Type, Employees Involved, Investigation Days, Remediation Cost, Risk Score, Training Referrals, Status, Outcome and Action Taken.
- No macros, no add-ins, no Power Pivot licence – plain formulas, pivot tables and slicers, so it opens on a locked-down machine running Excel 2016 or later, Excel for Mac and Microsoft 365.
- Seven worksheets in total – the five report pages plus Data and Support – and an unlocked file you can rebrand.
Dashboard Pages Explanation
1. Overview
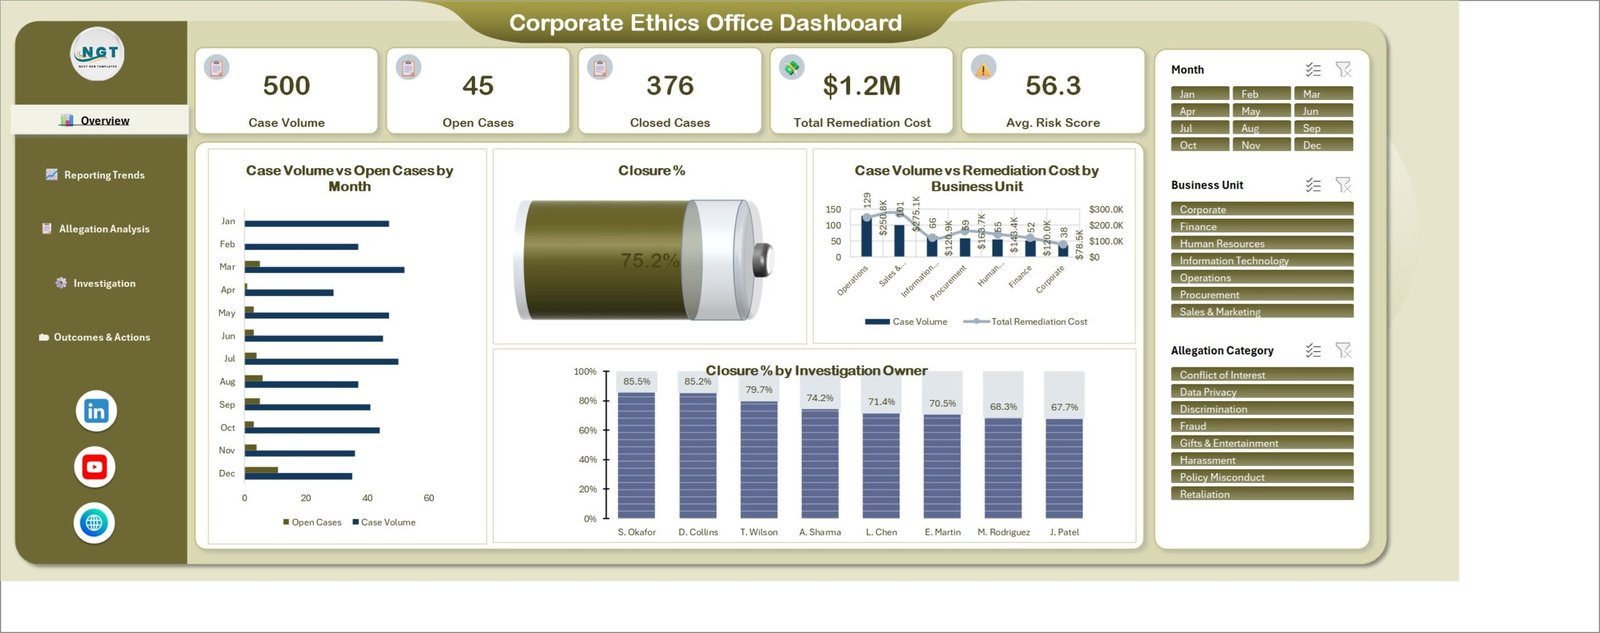
The five KPI cards sit across the top, then three charts do the explaining. Case Volume vs Open Cases by Month puts the open backlog against the intake for each of the twelve months, so a month where reports arrived faster than they were closed is visible immediately. The Closure % gauge gives the single 75.2% figure. Case Volume vs Remediation Cost by Business Unit pairs a bar for caseload with a line for money – Operations carries the highest volume at 129 cases and Corporate the lowest at 38, and the cost line does not follow the bars, which is the point of putting them on one axis. Below, Closure % by Investigation Owner ranks the eight investigators from S. Okafor at 85.5% down to J. Patel at 67.7%.
2. Reporting Trends
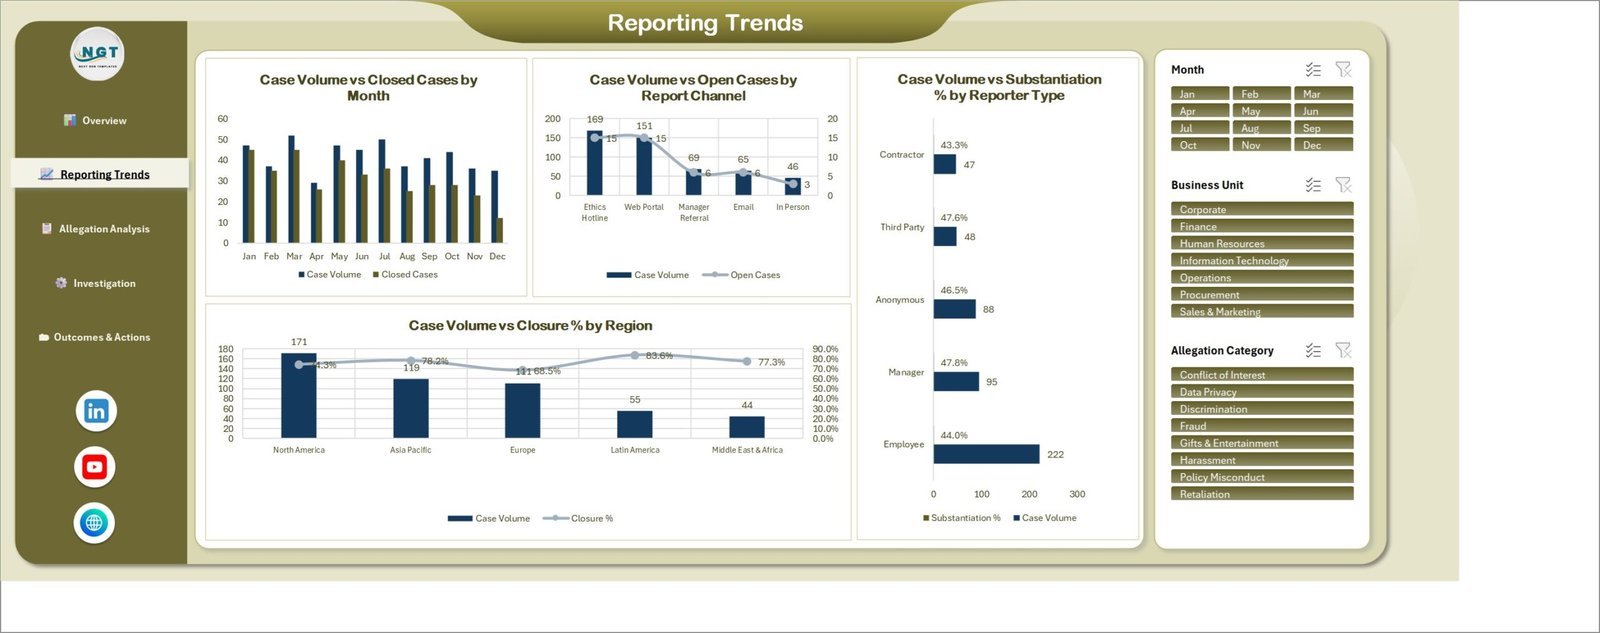
This page answers where reports come from. Case Volume vs Closed Cases by Month tracks intake against closures month by month. Case Volume vs Open Cases by Report Channel shows the Ethics Hotline as the largest single channel at 169 cases, then the Web Portal at 151, Manager Referral at 69, Email at 65 and In Person at 46. Case Volume vs Substantiation % by Reporter Type is the chart most people look at twice: Employee reports dominate at 222, Manager referrals are 95, Anonymous 88, Third Party 48 and Contractor 47 – and the substantiation rates sit within a few points of each other (44.0% for employee reports, 46.5% for anonymous ones), which is a useful counter to the assumption that anonymous reports are less reliable. Case Volume vs Closure % by Region covers five regions, from North America at 171 cases down to Middle East & Africa at 44, with Latin America closing 83.6% against Europe’s 68.5%.
3. Allegation Analysis
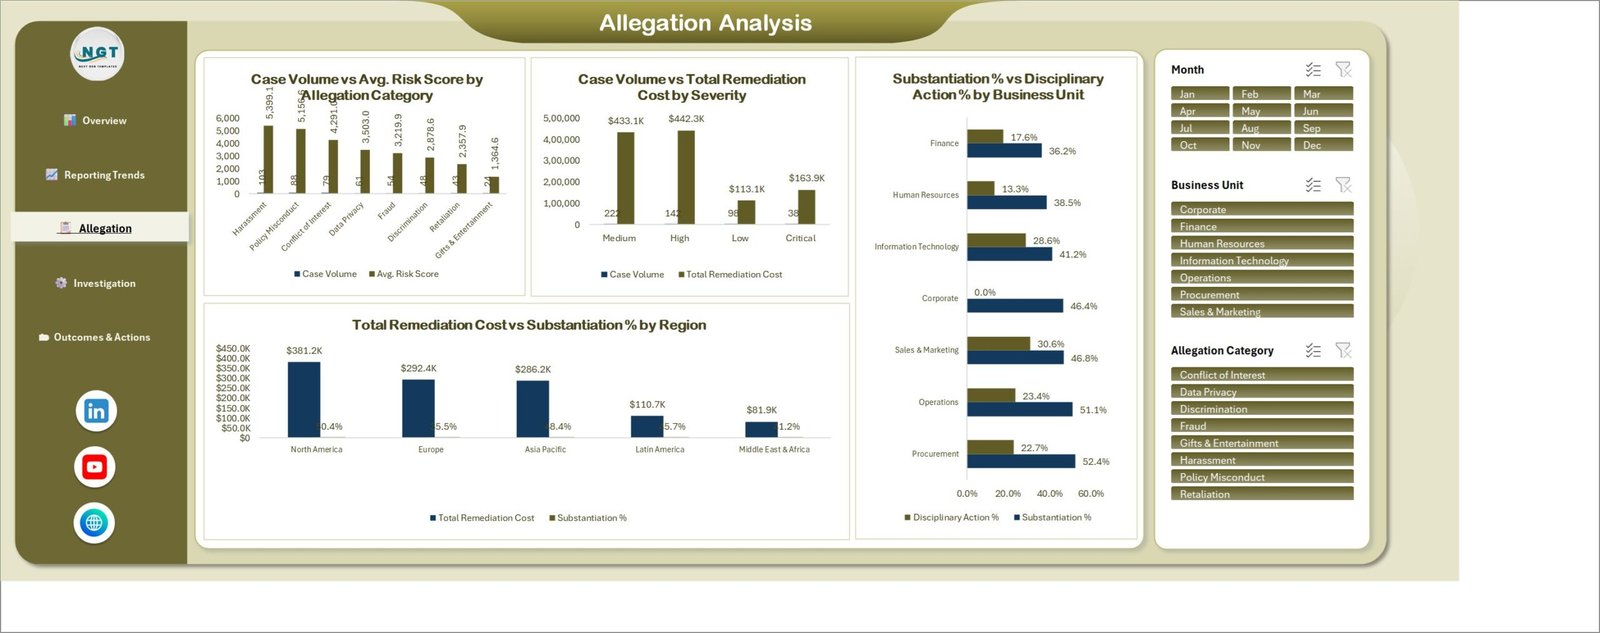
Here the caseload is cut by what was alleged. The category chart ranks Harassment 103, Policy Misconduct 88, Conflict of Interest 79, Data Privacy 61, Fraud 54, Discrimination 48, Retaliation 43 and Gifts & Entertainment 24. Case Volume vs Total Remediation Cost by Severity shows why volume alone misleads: Medium severity carries 222 cases and $433.1K, High carries 142 cases but slightly more money at $442.3K, Low 98 cases at $113.1K, and Critical only 38 cases yet $163.9K. Substantiation % vs Disciplinary Action % by Business Unit puts the two rates side by side per unit, and Total Remediation Cost vs Substantiation % by Region shows North America at $381.2K, Europe $292.4K, Asia Pacific $286.2K, Latin America $110.7K and Middle East & Africa $81.9K – which reconciles to the same $1.15M the severity chart totals.
4. Investigation Performance
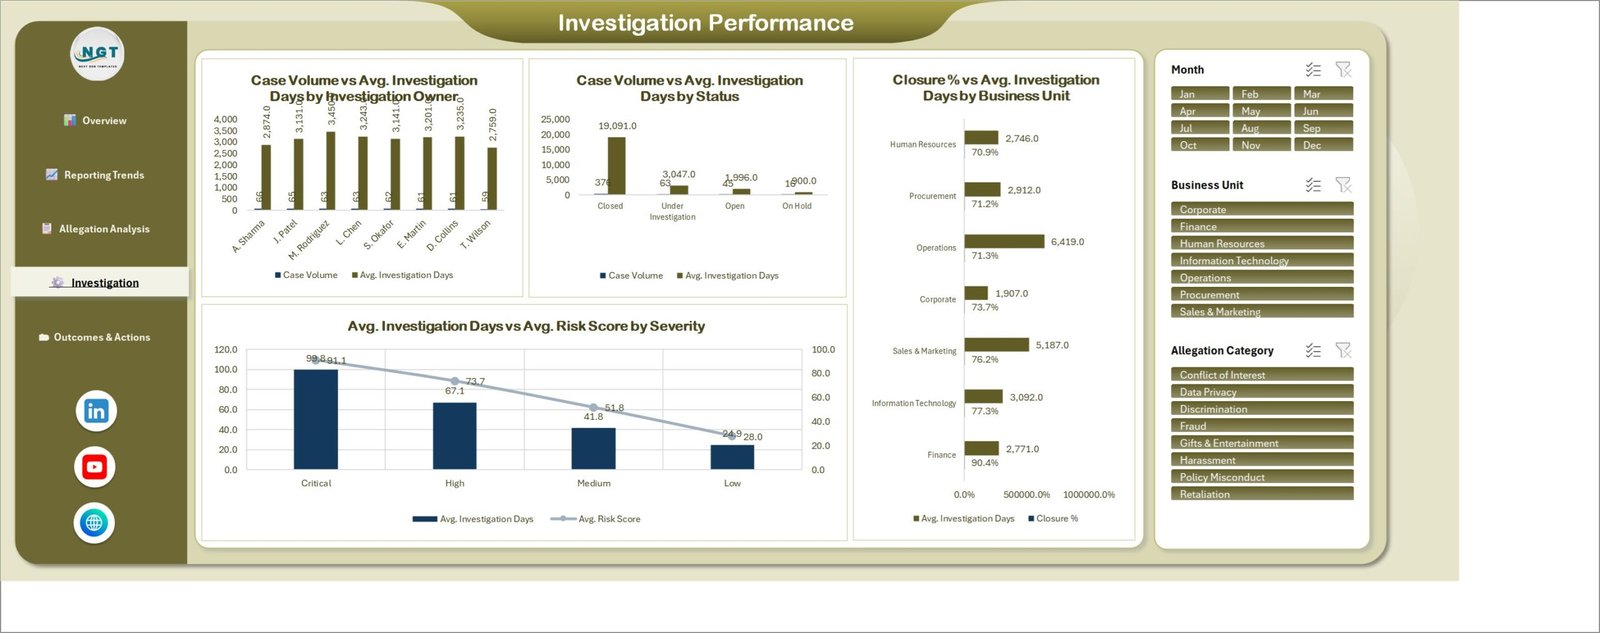
This is the workload page: investigation days by owner, by case status and by business unit, with a fourth chart pairing Avg. Investigation Days vs Avg. Risk Score by Severity. That last one is the cleanest read on the page – Critical cases average 99.8 days at a 91.1 risk score, High 67.1 days at 73.7, Medium 41.8 days at 51.8 and Low 24.9 days at 28.0. The relationship is close to linear, which is what you would hope for: the cases scored as most serious are the ones getting the most time.
5. Outcomes & Actions
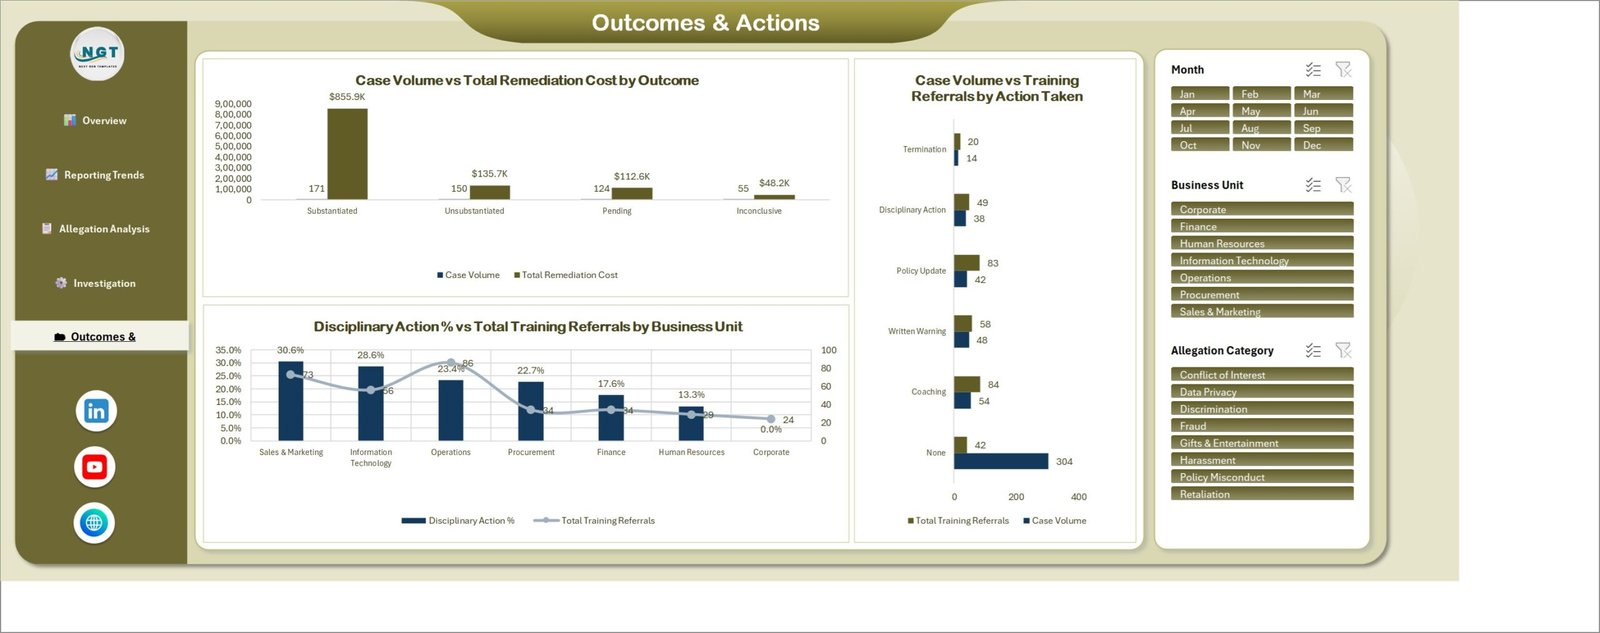
The last page closes the loop. Case Volume vs Total Remediation Cost by Outcome splits the 500 cases into Substantiated 171, Unsubstantiated 150, Pending 124 and Inconclusive 55, and shows that the substantiated group carries $855.9K of the $1.15M – three quarters of the money on a third of the cases. Disciplinary Action % vs Total Training Referrals by Business Unit runs from Sales & Marketing at 30.6% down to Corporate at 0.0%, with training referrals plotted against it. Case Volume vs Training Referrals by Action Taken breaks out what actually happened: 304 cases closed with no action, 54 with Coaching, 48 with a Written Warning, 42 with a Policy Update, 38 with Disciplinary Action and 14 with Termination.
Corporate Ethics Office Dashboard in Excel vs. Google Sheets vs. Paid GRC Case Software – Feature Comparison
| Feature | This Excel dashboard | Google Sheets build | Paid GRC case software |
|---|---|---|---|
| Cost | $17.99 one time | Free tool, your build time | $15,000-$60,000+ per year |
| Platform | Excel 2016+, Mac, Microsoft 365 | Browser | Vendor-hosted web app |
| Setup time | Paste your data, refresh – minutes | Days to build the pivots and charts | Weeks of implementation |
| Real-time team collaboration | Only via OneDrive/SharePoint co-authoring | Yes, native | Yes |
| Mobile access | Read-only in the Excel mobile app | Yes | Yes |
| Customisable fields | Yes – edit the Data sheet columns | Yes | Vendor-defined, some config |
| Share with link | Via your own cloud storage | Yes | Yes, with roles |
| Year-1 cost at 5 users | $17.99 | $0 plus build time | $15,000+ |
| Confidential intake channel | No | No | Yes |
| Access control and audit trail | No | Sheet-level only | Yes, per user and per case |
| System of record for case files | No | No | Yes |
The bottom three rows are the honest ones. If you need intake, confidentiality and a defensible audit trail, buy the software – a spreadsheet cannot give you those and no amount of formatting changes that. What this workbook does is the reporting layer that the software often does badly: a board-ready, five-page read on a caseload you already hold elsewhere.
Who Should Use This Template
- Ethics and compliance managers who have the case data in a log or an export and need a monthly or quarterly pack for the audit committee.
- General counsel and company secretaries who want one page to open before a board meeting rather than a folder of spreadsheets.
- Internal audit teams reviewing how consistently allegations are handled across business units and regions.
- HR directors in organisations where conduct cases sit with HR rather than a separate ethics office.
- Consultants producing a caseload review for a client without provisioning a GRC platform for a six-week engagement.
Who should not: anyone looking for a place to receive reports, anyone who needs per-user permissions on the data, and anyone whose case volumes run to hundreds of thousands of rows a month, where a database belongs.
Real-World Use Cases
Priya, compliance manager at a manufacturing group. She exports the quarter’s closed cases from the hotline provider, strips names down to case references, pastes 400 rows into the Data sheet and refreshes. The Allegation Analysis page shows Harassment leading on volume while Critical severity carries disproportionate cost, which becomes the first slide of the audit committee pack.
Daniel, general counsel at a mid-sized software company. He filters the Business Unit slicer to Sales & Marketing and finds a 30.6% disciplinary action rate against a group average nearer 20%. That does not prove anything on its own, but it is the question he takes into his next meeting with that unit’s leadership.
Aisha, internal audit lead. She uses the Investigation Performance page to compare average investigation days by owner and severity across regions, looking for cases that sat too long relative to their risk score – a consistency check she previously did by hand in a pivot table she rebuilt every quarter.
Advantages of the Corporate Ethics Office Dashboard in Excel
- It runs where the data already is. No IT ticket, no vendor review, no data leaving your network.
- Every figure reconciles. The severity, region and outcome charts all total the same $1.15M, and the status, category, channel and region splits all total 500 cases – the pivots are built off one table, not stitched together.
- One filter, five pages. The Month, Business Unit and Allegation Category slicers are wired to the shared pivot cache, so a selection on the Overview follows you.
- Nothing to enable. No macro warning, no trust prompt, no add-in install – which matters a great deal on a managed corporate laptop.
- Unlocked and rebrandable. Swap the logo, change the colours, rename the categories to match your own code of conduct.
Opportunities for Improvement
Three things are worth knowing before you buy, because they are visible in the screenshots above.
- Some charts labelled “Avg.” plot totals. On the Allegation Analysis page, Avg. Risk Score by Allegation Category shows values like 5,399.1 for Harassment – that is the sum of risk scores across 103 cases, not an average. The same applies to the Avg. Investigation Days series on Investigation Performance, where Closed cases show 19,091 days. The severity chart at the bottom of that page does use real averages. The fix is a two-click change of the pivot field’s summarise-by setting from Sum to Average, but the shipped file is inconsistent.
- One percentage axis is mis-scaled. Closure % vs Avg. Investigation Days by Business Unit carries an axis reading up to 1,000,000.0% because the day totals share the percentage format. The data labels on the bars are correct; the axis is not.
- Long category labels crowd the plots. On the Allegation Analysis page the rotated data labels run through the chart title, and the Overview’s business-unit axis truncates “Information Technology”. Widening the chart or shortening the labels fixes it.
None of these affect the underlying data – the pivots and the source table are sound – but you should know about them rather than discover them in front of a board.
Best Practices
- Anonymise before you paste. Use case references and coded initials. Never put a reporter’s name, a subject’s name or free-text allegation detail in this file.
- Keep the column headers exactly as shipped when you replace the sample rows, or the pivot fields lose their bindings. Rename the values freely – the slicer buttons and chart axes rebuild from whatever you type.
- Refresh after every paste. Ctrl + Alt + F5 refreshes all pivot caches at once; the cards, charts and slicers update together.
- Store it where your case files live, under the same access restrictions – not on a shared drive, and not emailed as an attachment.
- Fix the two aggregation settings first. Right-click the risk-score and investigation-day fields, choose Value Field Settings, and switch Sum to Average before the first board pack goes out. Microsoft’s guide to creating and configuring a PivotTable covers the setting if you have not used it before.
- Date-stamp each pack. Save a copy per reporting period so the numbers behind an old board paper can still be reproduced.
Explore Relevant Templates
- Compliance Monitoring Dashboard in Excel – the control-testing side of the same governance picture.
- Reg Tech Dashboard in Excel – regulatory-technology reporting in the same five-page format.
- Employment Law Services Dashboard in Excel – for teams whose conduct matters escalate into legal ones.
- Employee Grievance Tracker in Excel – a row-level tracker to sit upstream of this dashboard.
- Employee Complaint Resolution Tracker in Excel – complaint intake and resolution logging.
- Audit Findings and CAPA Data Entry System in Excel – corrective and preventive action capture.
- Incident Near Miss Data Entry System in Excel – incident logging for health, safety and conduct events.
Frequently Asked Questions
Is this a whistleblower hotline or a case management system?
No. It is a reporting layer only. It does not receive reports, does not store investigation files, has no user permissions and is not a system of record. Keep intake and case files in a purpose-built confidential system and paste summary rows into this workbook.
Does it make my organisation compliant with any regulation?
No. It makes no claim to any law, directive or standard, and using it proves nothing to a regulator. It is a spreadsheet that charts the data you enter. Compliance advice belongs with your legal counsel, not with a template.
Can I put real reporter and subject names in it?
Please do not. Ethics case data is among the most sensitive an employer holds and this file offers no confidentiality, encryption or access control – anyone who opens it sees every row. Use case references and coded initials.
Does it need macros or an add-in?
No. It is a plain .xlsx with formulas, pivot tables and slicers – no macros, no Power Pivot licence, no add-ins. It opens on Excel 2016 and later, Excel for Mac and Microsoft 365.
Is this the same as your KPI dashboard and KPI scorecard templates?
No. This is the analytical dashboard – five wide pages driven by slicers, built for exploring a whole caseload. The KPI dashboard and KPI scorecard lines use a month picker, target-versus-actual columns and traffic lights. Similar names, different templates.
Can I change the allegation categories and business units?
Yes. Type your own into the Data sheet and refresh. The slicer buttons and every chart axis rebuild from your values, so you are not stuck with the eight sample categories or seven sample units.
How many rows can I load?
The sample carries 500 cases across 17 columns. Pivot tables handle far more – tens of thousands of rows refresh in a couple of seconds on ordinary hardware.
About the Author
Built by PK – Microsoft Certified Professional with 15+ years of Excel, Google Sheets, and Power BI experience. Founder of NextGenTemplates, reaching 300K+ subscribers across YouTube channels. Every template is hand-built and tested before release.
Conclusion
An ethics office is judged on two things: whether it sees the whole caseload, and whether it can explain it. The Corporate Ethics Office Dashboard in Excel handles the second, on data you already hold, for a one-time $17.99 instead of $29.99 – five report pages, three shared slicers, nineteen charts and a 500-row worked example that reconciles end to end. Fix the two aggregation settings noted above, keep names out of the file, and it will carry a quarterly board pack comfortably.
What it will never be is the confidential channel your people report through. Buy the purpose-built system for that, and use this for the part it does well.
Get the Corporate Ethics Office Dashboard in Excel on NextGenTemplates – instant download, unlocked file, lifetime updates.
For step-by-step Excel dashboard tutorials, subscribe at youtube.com/@PKAnExcelExpert.


