In the fast-evolving world of healthcare management, tracking revenue efficiently is more important than ever. Whether you're managing a hospital,
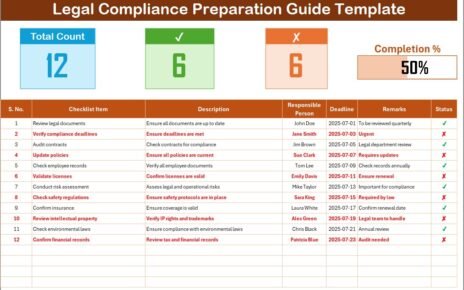
In today’s fast-paced business world, staying on top of legal compliance is not just a necessity—it’s a critical aspect of
In today’s fast-paced manufacturing world, risk management is not just a requirement—it's a competitive edge. However, tracking those risks, measuring