Managing customers is no longer just about acquiring new leads. Instead, modern businesses focus on maximizing the long-term value of each customer. Therefore, organizations need a clear, data-driven way to track, monitor, and improve Customer Lifetime Value (CLV). That is exactly where a Customer Lifetime Value KPI Dashboard in Power BI becomes a powerful and practical solution.
This detailed, SEO-friendly article explains what a Customer Lifetime Value KPI Dashboard in Power BI is, why it matters, how it works, its page-wise structure, Excel data setup, advantages, best practices, and frequently asked questions. Moreover, the language remains simple, clear, and business-friendly so that sales teams, marketing teams, finance teams, and decision-makers can easily understand and implement it.
Click to Purchases Customer Lifetime Value KPI Dashboard in Power BI
What Is a Customer Lifetime Value KPI Dashboard in Power BI?
A Customer Lifetime Value KPI Dashboard in Power BI is a ready-to-use, interactive analytics tool designed to track and analyze customer value-related KPIs from a single centralized dashboard. Instead of working with scattered Excel sheets or static reports, this dashboard provides real-time visibility into customer profitability, retention performance, and long-term revenue trends.
Because the dashboard uses Power BI for visualization and Excel as the data source, it delivers both flexibility and performance. As a result, users can easily update data in Excel while Power BI automatically refreshes insights and visuals.
Moreover, this dashboard helps organizations:
-
Understand which customers generate the highest value
-
Compare actual performance against targets
-
Analyze trends across months and years
-
Make smarter marketing, sales, and retention decisions
Why Is Customer Lifetime Value Important for Businesses?
Customer Lifetime Value plays a crucial role in long-term business success. Therefore, tracking it accurately becomes essential.
Why does CLV matter so much?
-
It helps businesses focus on profitable customers, not just high-volume customers.
-
It supports better marketing budget allocation.
-
It improves customer retention strategies.
-
It strengthens forecasting and revenue planning.
However, manual tracking of CLV often creates errors, delays, and confusion. That is why a Customer Lifetime Value KPI Dashboard in Power BI becomes essential for modern, data-driven organizations.
How Does a Customer Lifetime Value KPI Dashboard in Power BI Work?
The working of this dashboard remains simple, structured, and efficient.
-
First, users enter actual and target KPI data into Excel sheets.
-
Then, Power BI connects directly to these Excel files.
-
After that, Power BI calculates MTD, YTD, target vs actual, and year-over-year comparisons.
-
Finally, interactive visuals display insights instantly using slicers, cards, tables, and charts.
As a result, decision-makers can analyze performance in seconds instead of hours.
What Are the Key Features of the Customer Lifetime Value KPI Dashboard in Power BI?
This dashboard includes several business-ready features that improve clarity and decision-making.
-
📊 Centralized KPI monitoring
-
📅 Month-wise and YTD performance tracking
-
🎯 Target vs Actual comparison
-
🔁 Previous Year vs Current Year analysis
-
🚦 Visual performance indicators (green ▲ and red ▼ icons)
-
🔍 Drill-through KPI definitions
-
📈 Interactive trend charts
-
📁 Excel-based data input for easy updates
What Is the Page-Wise Structure of the Dashboard?
The Customer Lifetime Value KPI Dashboard in Power BI includes three structured pages, each designed for a specific analytical purpose.
Click to Purchases Customer Lifetime Value KPI Dashboard in Power BI
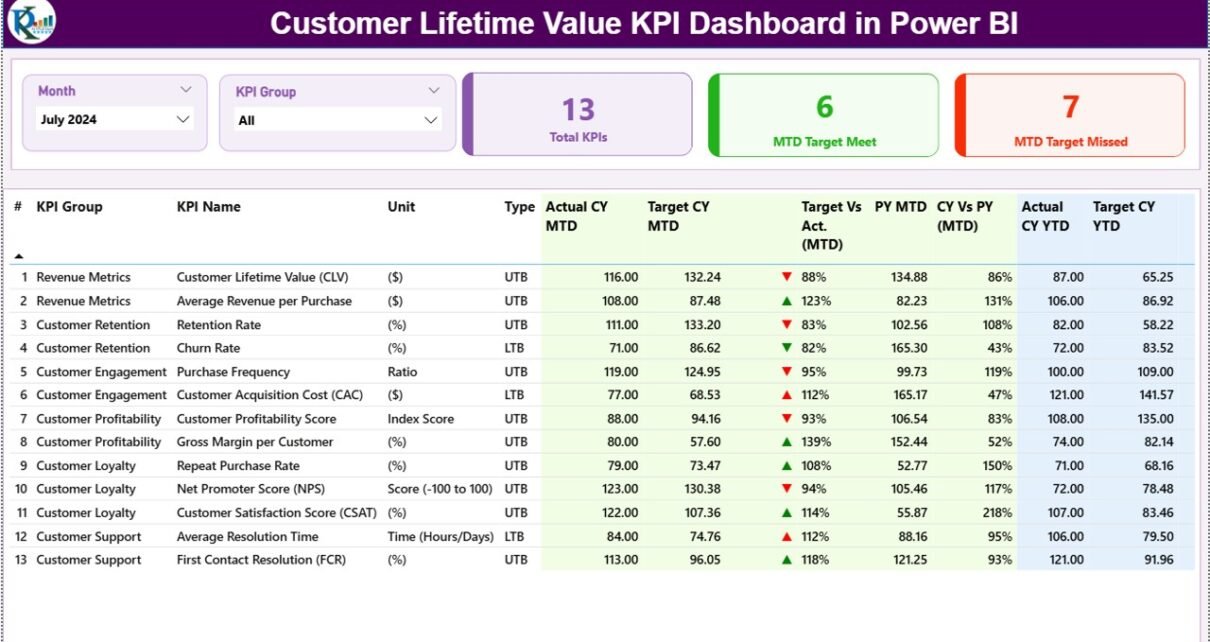
1) What Does the Summary Page Show?
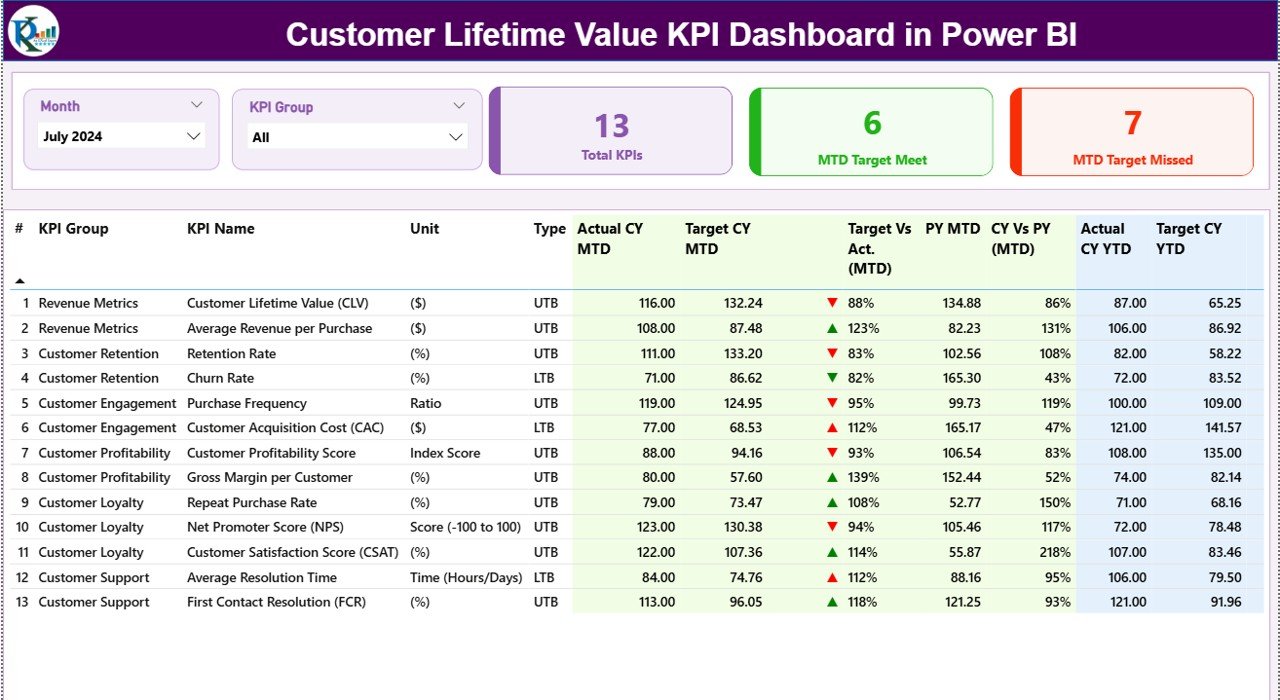
The Summary Page acts as the main landing page of the dashboard. Therefore, it provides a complete overview of all KPIs at a glance.
Top Section – Slicers and KPI Cards
At the top of the page, you will find:
-
Month slicer to select reporting month
-
KPI Group slicer to filter KPI categories
Additionally, three KPI cards display:
-
Total KPIs Count
-
MTD Target Meet Count
-
MTD Target Missed Count
These cards instantly show overall performance health.
Detailed KPI Table – What Columns Are Included?
Below the cards, a detailed KPI table presents structured performance metrics.
-
KPI Number
Displays the unique sequence number of each KPI. -
KPI Group
Represents the category or group of the KPI. -
KPI Name
Shows the specific KPI name related to Customer Lifetime Value. -
Unit
Defines the unit of measurement (Currency, %, Count, etc.). -
Type (LTB / UTB)
Indicates whether the KPI follows:-
LTB (Lower the Better) or
-
UTB (Upper the Better)
-
MTD Performance Metrics
-
Actual CY MTD
Shows the actual current-year Month-to-Date value. -
Target CY MTD
Displays the target value for the current month. -
MTD Icon
Uses ▲ (green) or ▼ (red) icons to show whether the target is met. -
Target vs Actual (MTD)
Displays percentage using the formula:
Actual MTD / Target MTD -
PY MTD
Shows the same month’s value from the previous year. -
CY vs PY (MTD)
Displays growth or decline using the formula:
CY MTD / PY MTD
YTD Performance Metrics
-
Actual CY YTD
-
Target CY YTD
-
YTD Icon
-
Target vs Actual (YTD)
Formula: Actual YTD / Target YTD -
PY YTD
-
CY vs PY (YTD)
Formula: CY YTD / PY YTD
As a result, users can analyze both short-term and long-term performance from one screen.
Click to Purchases Customer Lifetime Value KPI Dashboard in Power BI
2) What Insights Does the KPI Trend Page Provide?
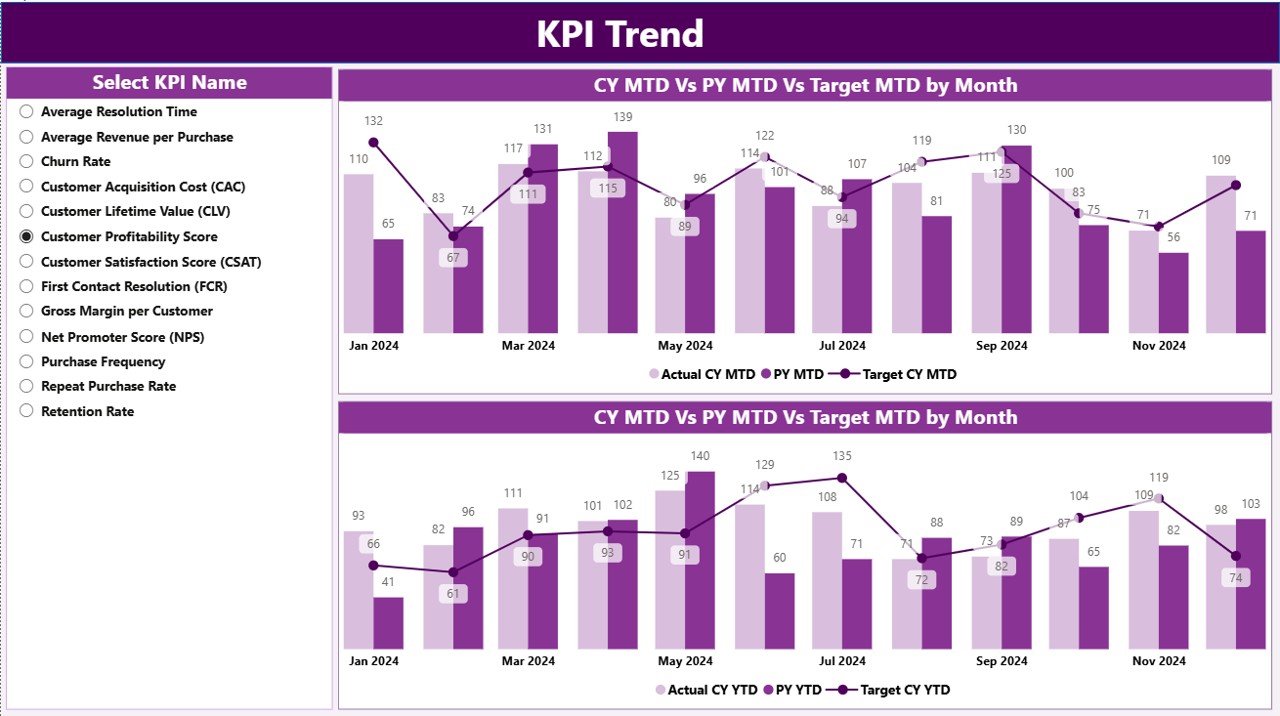
The KPI Trend Page focuses on visual trend analysis.
Key Highlights of This Page
-
Two combo charts display:
-
Actual Current Year values
-
Actual Previous Year values
-
Target values
-
-
Separate charts for:
-
MTD trends
-
YTD trends
-
On the left side, a KPI Name slicer allows users to select a specific KPI. Therefore, trends update instantly for deeper analysis.
This page helps users:
-
Identify growth patterns
-
Detect declining KPIs early
-
Compare targets against historical performance
3) What Is the Purpose of the KPI Definition Page?

The KPI Definition Page acts as a drill-through reference page.
Why Is This Page Important?
-
It explains KPI formulas and definitions
-
It ensures data clarity and consistency
-
It supports new users and stakeholders
This page remains hidden by default. However, users can drill through from the Summary Page to view KPI details. To return, users simply click the Back button located at the top-left corner.
How Is the Excel Data Structured for This Dashboard?
The dashboard uses Excel as its data source, which makes updates simple and user-friendly. The Excel file contains three worksheets.
1) Input_Actual Sheet – How to Fill It?
This sheet captures actual performance data.
You need to fill:
-
KPI Name
-
Month (use the first date of the month)
-
MTD Value
-
YTD Value
This structure ensures accurate time-based calculations in Power BI.
2) Input_Target Sheet – What Data Goes Here?
Click to Purchases Customer Lifetime Value KPI Dashboard in Power BI
This sheet stores target values.
You need to fill:
-
KPI Name
-
Month
-
MTD Target
-
YTD Target
As a result, Power BI can automatically calculate target vs actual performance.
3) KPI Definition Sheet – Why Is It Important?
This sheet defines each KPI clearly.
Columns include:
-
KPI Number
-
KPI Group
-
KPI Name
-
Unit
-
Formula
-
Definition
-
Type (LTB or UTB)
Because of this sheet, the dashboard stays standardized, transparent, and scalable.
Advantages of Customer Lifetime Value KPI Dashboard in Power BI
Using this dashboard delivers several measurable benefits.
-
✅ Centralized customer value analysis
-
✅ Faster and more accurate decision-making
-
✅ Clear comparison of targets vs actuals
-
✅ Improved customer retention strategies
-
✅ Better marketing ROI optimization
-
✅ Reduced manual reporting effort
-
✅ Scalable for future KPIs and growth
How Does This Dashboard Help Different Teams?
Sales Teams
-
Focus on high-value customers
-
Improve upselling and cross-selling strategies
Marketing Teams
-
Optimize acquisition costs
-
Allocate budgets more effectively
Finance Teams
-
Forecast long-term revenue accurately
-
Monitor profitability trends
Leadership Teams
-
Make data-driven strategic decisions
-
Track overall customer health
Best Practices for the Customer Lifetime Value KPI Dashboard in Power BI
To get the maximum value from this dashboard, follow these best practices.
-
📌 Update Excel data regularly
-
📌 Maintain consistent KPI definitions
-
📌 Review MTD and YTD trends together
-
📌 Use slicers to drill into insights
-
📌 Monitor target misses proactively
-
📌 Align KPIs with business objectives
-
📌 Train users on KPI interpretation
Common Challenges and How to Overcome Them
Challenge: Inconsistent Data
Solution: Standardize Excel input formats and validation.
Challenge: Misinterpreting KPIs
Solution: Use the KPI Definition page for clarity.
Challenge: Too Many KPIs
Solution: Focus only on actionable and strategic KPIs.
Conclusion
A Customer Lifetime Value KPI Dashboard in Power BI transforms how organizations track, analyze, and improve customer value. Instead of relying on static reports or fragmented data, this dashboard delivers real-time insights, trend analysis, and performance comparisons from a single interactive platform.
Because it uses Excel for data input and Power BI for visualization, it remains flexible, scalable, and cost-effective. Therefore, businesses that aim to grow sustainably should adopt this dashboard to improve customer profitability, retention, and long-term success.
Frequently Asked Questions with Answers
What is Customer Lifetime Value in simple terms?
Customer Lifetime Value represents the total revenue a business expects from a customer throughout the relationship.
Why should I track CLV using Power BI?
Power BI provides interactive visuals, real-time updates, and advanced analytics that manual Excel reports cannot match.
Can non-technical users use this dashboard?
Yes, because data entry happens in Excel and visuals remain easy to understand.
How often should I update the Excel data?
Ideally, you should update it monthly or weekly depending on business needs.
Can I customize KPIs in this dashboard?
Yes, you can easily add or modify KPIs using the KPI Definition sheet.
Does this dashboard support year-over-year comparison?
Yes, it includes both MTD and YTD comparisons with previous-year data.
Is this dashboard suitable for small businesses?
Absolutely. It scales well for both small and large organizations.
Visit our YouTube channel to learn step-by-step video tutorials