In today’s highly competitive travel retail environment, duty-free retail businesses must rely on data, not assumptions. Airports, seaports, and international terminals operate under intense pressure to maximize revenue per passenger, improve conversion rates, and manage inventory efficiently. However, without a structured performance measurement system, decision-making becomes slow and reactive.
That is exactly where a Duty-Free Retail KPI Dashboard in Power BI becomes a game-changing solution.
This in-depth article explains what a Duty-Free Retail KPI Dashboard in Power BI is, why it is essential, how it works, its page-wise structure, key features, advantages, best practices, and frequently asked questions. Moreover, the article uses clear language, strong transitions, active voice, and practical explanations to ensure maximum clarity and SEO effectiveness.
Click to Purchases Duty-Free Retail KPI Dashboard in Power BI
What Is a Duty-Free Retail KPI Dashboard in Power BI?
A Duty-Free Retail KPI Dashboard in Power BI is an interactive, data-driven analytics solution designed to track, analyze, and visualize key performance indicators (KPIs) for duty-free retail operations.
Instead of reviewing scattered Excel sheets, manual reports, or static presentations, this dashboard consolidates financial, operational, and performance KPIs into one centralized Power BI file. As a result, retail managers gain instant visibility into performance trends, target achievement, and year-over-year growth.
Furthermore, since the dashboard uses Excel as its data source, it remains flexible, easy to update, and highly scalable for both small and large duty-free retailers.
Why Do Duty-Free Retail Businesses Need a KPI Dashboard?
Duty-free retail differs significantly from traditional retail. Passenger traffic, flight schedules, seasonal demand, and traveler demographics directly influence performance. Therefore, managers need real-time insights and accurate comparisons.
Here is why a KPI dashboard becomes essential:
-
First, duty-free retailers manage multiple KPIs across categories, such as sales, conversion, margin, and inventory.
-
Second, leadership teams require Month-to-Date (MTD) and Year-to-Date (YTD) performance visibility.
-
Third, comparing current year vs previous year ensures accurate growth tracking.
-
Finally, visual indicators help teams identify risks and opportunities instantly.
Because of these reasons, a Duty-Free Retail KPI Dashboard in Power BI becomes a strategic necessity rather than a reporting luxury.
Click to Purchases Duty-Free Retail KPI Dashboard in Power BI
How Does a Duty-Free Retail KPI Dashboard in Power BI Work?
The dashboard follows a simple yet powerful workflow.
First, users enter KPI data into an Excel data file.
Next, Power BI connects to this Excel file as a data source.
Then, Power BI transforms, models, and visualizes the data dynamically.
Finally, users interact with slicers, cards, tables, and charts to analyze performance.
Because of this approach, the dashboard remains easy to maintain, highly flexible, and business-friendly.
What Are the Key Features of the Duty-Free Retail KPI Dashboard in Power BI?
The dashboard includes several thoughtfully designed features that support fast and accurate decision-making.
Key Highlights
-
Excel-based data input for simplicity
-
Interactive Power BI visuals
-
Month and KPI Group slicers
-
MTD and YTD performance tracking
-
Target vs Actual analysis
-
Current Year vs Previous Year comparison
-
Drill-through KPI definitions
Together, these features transform raw data into actionable insights.
Click to Purchases Duty-Free Retail KPI Dashboard in Power BI
Page-Wise Structure of the Duty-Free Retail KPI Dashboard in Power BI
The dashboard consists of three well-structured pages inside the Power BI Desktop application.
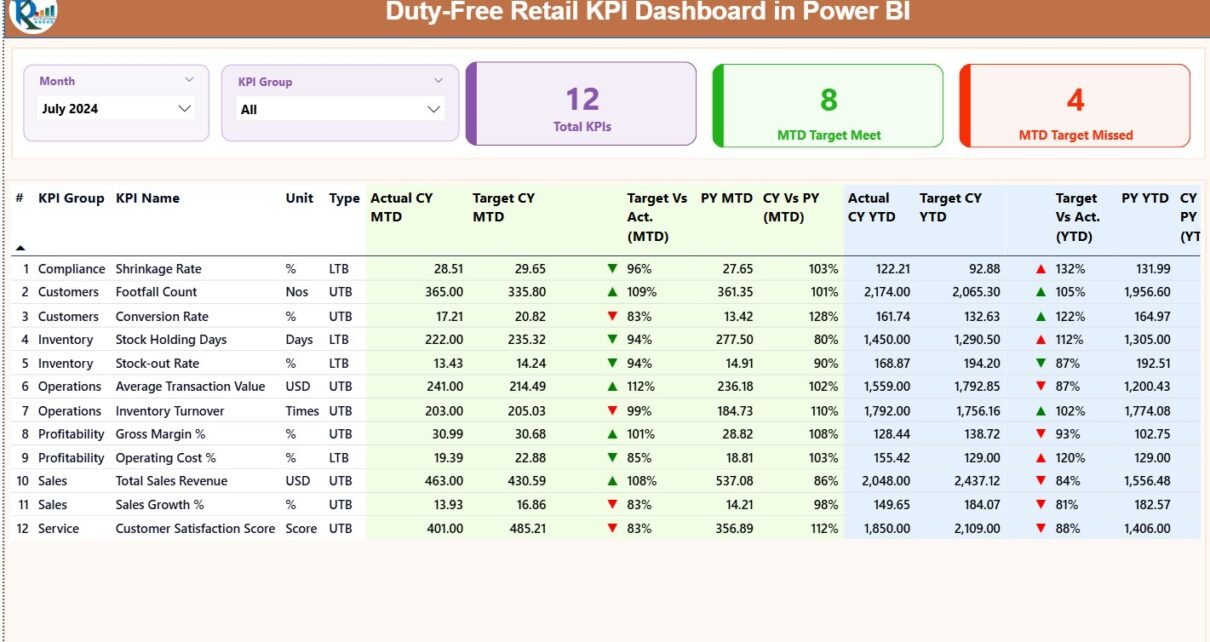
1. What Does the Summary Page Show?
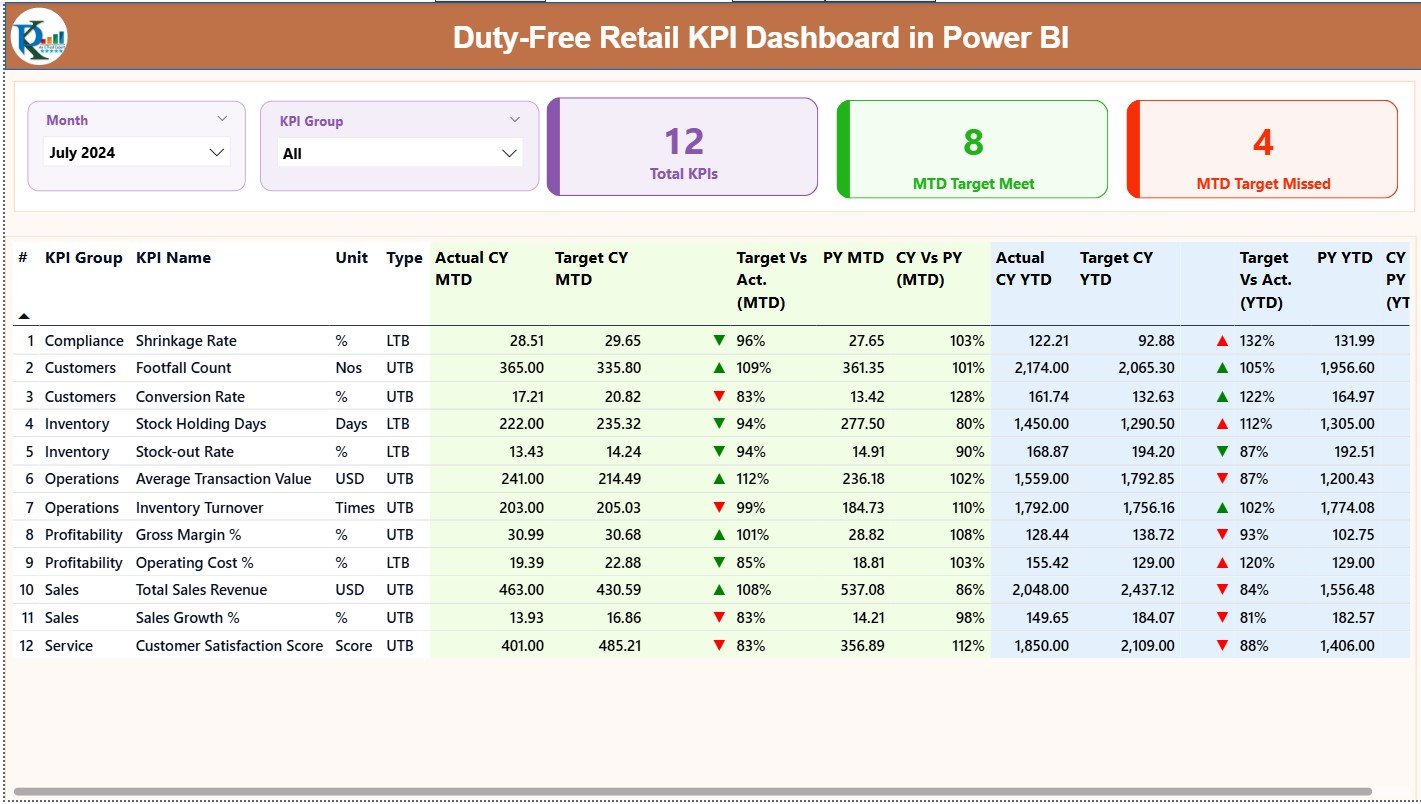
The Summary Page acts as the control center of the dashboard. It provides a consolidated view of all KPIs in one place.
Top-Level Slicers
At the top of the page, users see:
-
Month slicer to select the reporting period
-
KPI Group slicer to filter KPIs by category
These slicers instantly refresh all visuals on the page.
KPI Cards for Quick Insights
Below the slicers, three KPI cards display high-level metrics:
-
Total KPIs Count
-
MTD Target Met Count
-
MTD Target Missed Count
Because of these cards, managers can quickly assess overall performance health.
Detailed KPI Table
The detailed KPI table provides a comprehensive breakdown of each KPI.
Columns Explained Clearly
-
KPI Number
Displays the sequence number of each KPI. -
KPI Group
Categorizes KPIs into logical groups such as Sales, Operations, or Customer Metrics. -
KPI Name
Shows the name of the KPI being measured. -
Unit
Defines the unit of measurement, such as %, currency, or quantity. -
Type (LTB / UTB)
Indicates whether the KPI follows:-
LTB (Lower the Better), or
-
UTB (Upper the Better)
-
MTD Performance Analysis
The dashboard captures detailed Month-to-Date (MTD) performance:
-
Actual CY MTD – Current Year actual MTD value
-
Target CY MTD – Target MTD value
-
MTD Icon – ▲ or ▼ icons with green/red color indicating target achievement
-
Target vs Actual (MTD) – Percentage calculated as:
Actual MTD ÷ Target MTD -
PY MTD – Previous Year MTD value
-
CY vs PY (MTD) – Percentage comparison:
Current Year MTD ÷ Previous Year MTD
YTD Performance Analysis
Similarly, the dashboard tracks Year-to-Date (YTD) performance:
-
Actual CY YTD
-
Target CY YTD
-
YTD Icon – Visual performance indicator
-
Target vs Actual (YTD) – Actual YTD ÷ Target YTD
-
PY YTD
-
CY vs PY (YTD) – Current YTD ÷ Previous Year YTD
Because of this structure, users gain both short-term and long-term performance insights.
Click to Purchases Duty-Free Retail KPI Dashboard in Power BI
2. How Does the KPI Trend Page Help in Analysis?
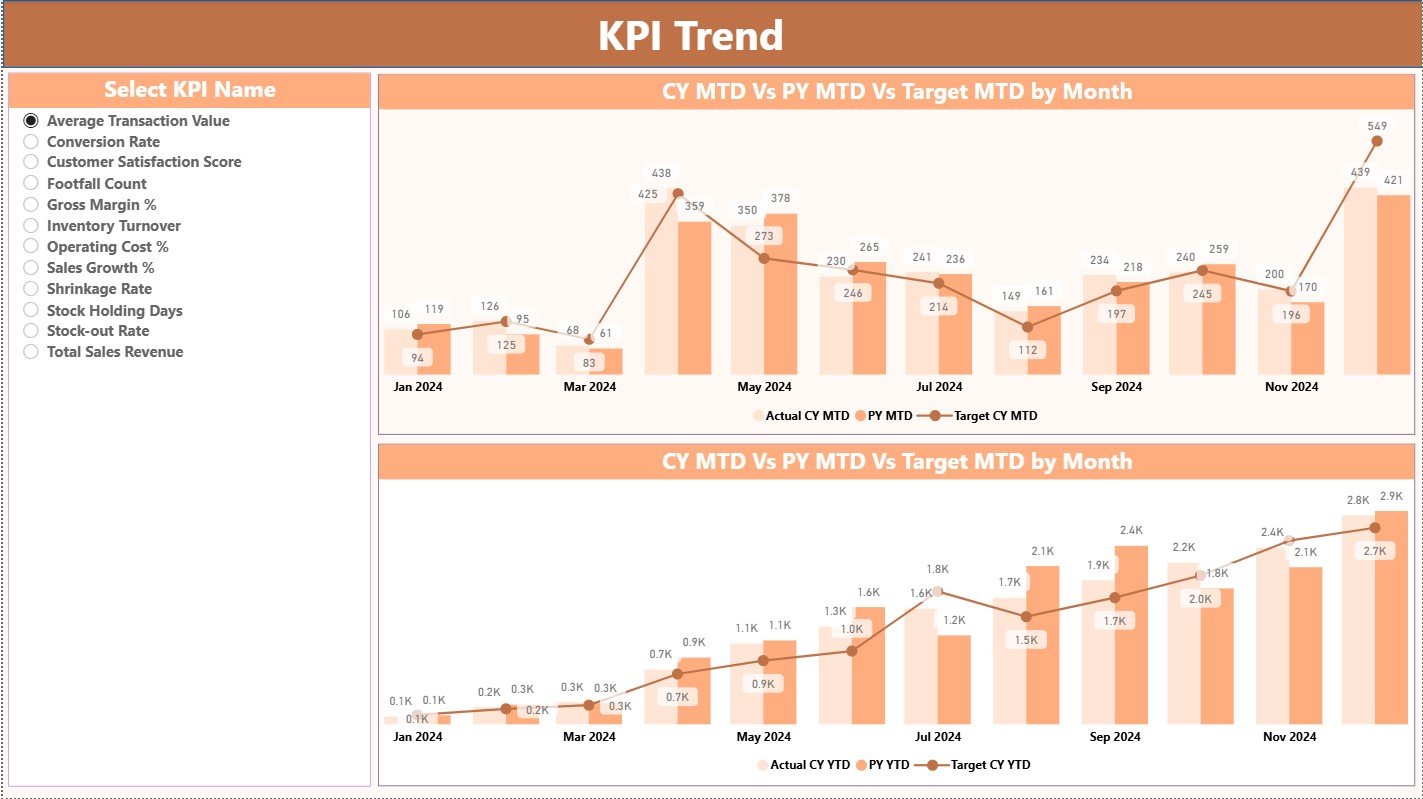
The KPI Trend Page focuses on visual trend analysis.
Interactive KPI Selection
On the left side, users select a KPI Name slicer. Once selected, all charts update instantly.
Combo Charts for Trend Comparison
This page includes two combo charts:
-
MTD Trend Chart
-
YTD Trend Chart
Each chart displays:
-
Current Year Actual values
-
Previous Year Actual values
-
Target values
As a result, users can visually compare performance across time and identify growth or decline patterns.
3. What Is the KPI Definition Page Used For?
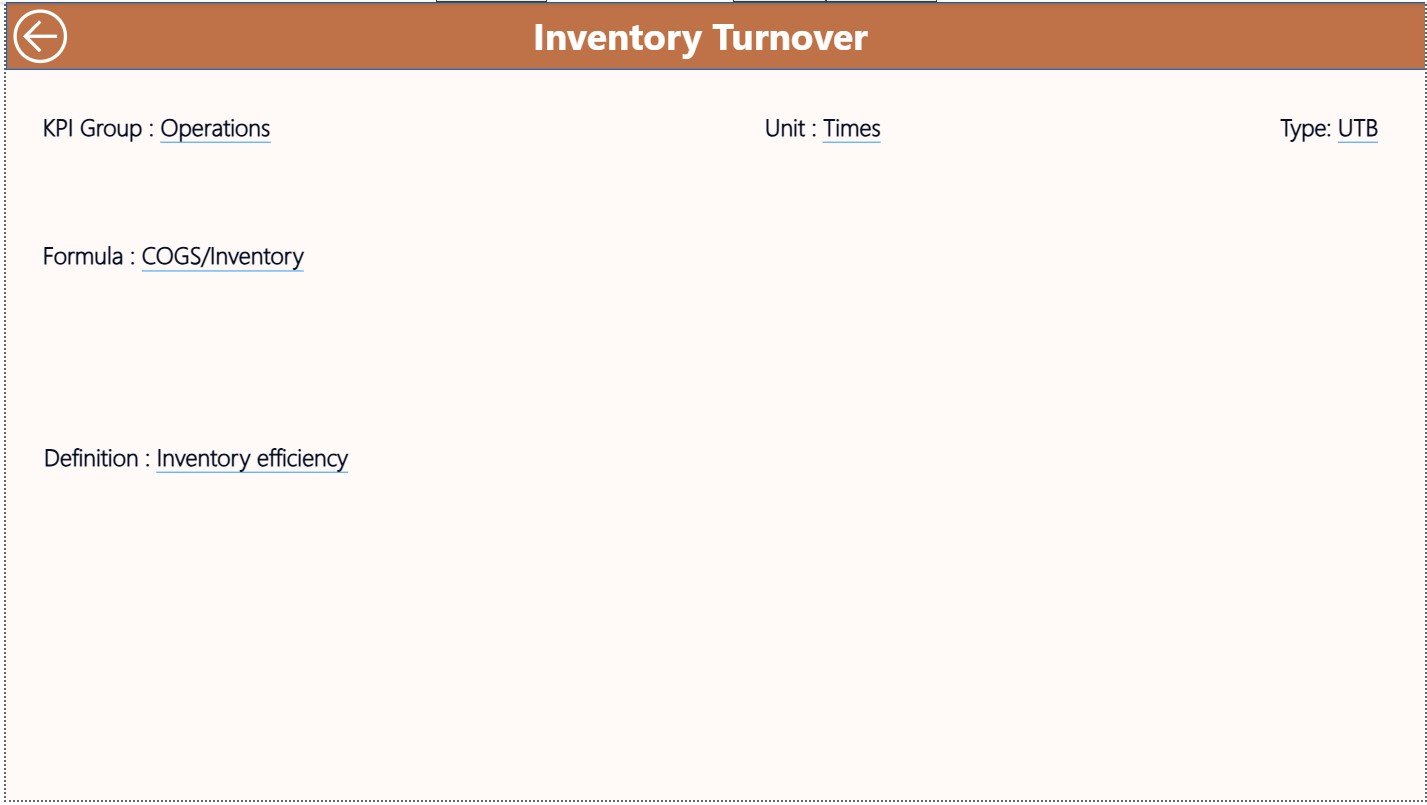
The KPI Definition Page serves as a hidden drill-through page.
Purpose of This Page
-
Displays KPI Formula
-
Explains KPI Definition
-
Shows Unit, Group, and Type
Users access this page by drilling through from the Summary Page.
Easy Navigation
A Back button at the top-left corner allows users to return to the Summary Page instantly. This feature ensures smooth navigation and better user experience.
What Excel Data Is Required for the Dashboard?
The dashboard uses an Excel file as its data source. Users must update three worksheets.
1. Input_Actual Sheet
This sheet stores actual performance data.
Required Columns
-
KPI Name
-
Month (use the first date of the month)
-
MTD Actual value
-
YTD Actual value
Because of this structure, Power BI easily aggregates monthly and yearly performance.
2. Input_Target Sheet
This sheet captures target values.
Required Columns
-
KPI Name
-
Month (first date of the month)
-
MTD Target value
-
YTD Target value
Targets drive performance evaluation and variance analysis.
3. KPI Definition Sheet
This sheet defines each KPI clearly.
Required Fields
-
KPI Number
-
KPI Group
-
KPI Name
-
Unit
-
Formula
-
Definition
-
Type (LTB or UTB)
This structure ensures data consistency and clarity across the dashboard.
Advantages of Duty-Free Retail KPI Dashboard in Power BI
Implementing this dashboard delivers significant business value.
Key Advantages
-
✔ Centralized KPI monitoring
-
✔ Faster decision-making
-
✔ Clear target vs actual visibility
-
✔ Accurate year-over-year comparison
-
✔ Interactive and visual insights
-
✔ Easy Excel-based data maintenance
-
✔ Scalable for multiple locations
Because of these advantages, duty-free retailers gain a competitive edge.
Click to Purchases Duty-Free Retail KPI Dashboard in Power BI
How Does This Dashboard Improve Business Decisions?
This dashboard helps management teams:
-
Identify underperforming KPIs early
-
Optimize pricing and promotions
-
Improve inventory planning
-
Track growth trends accurately
-
Align teams with performance goals
As a result, decisions become proactive instead of reactive.
Best Practices for Duty-Free Retail KPI Dashboard in Power BI
To maximize dashboard value, follow these best practices.
1. Define KPIs Clearly
Always maintain clear KPI definitions and formulas.
2. Maintain Consistent Data Entry
Use consistent month dates and KPI names in Excel.
3. Review KPIs Regularly
Analyze MTD and YTD performance monthly.
4. Focus on Visual Indicators
Use icons and percentages for quick insights.
5. Train Business Users
Ensure stakeholders understand how to interpret KPIs.
6. Update Targets Periodically
Align targets with business strategy changes.
Conclusion
A Duty-Free Retail KPI Dashboard in Power BI transforms complex retail data into clear, actionable insights. By combining Excel-based data entry with interactive Power BI visuals, this dashboard empowers duty-free retailers to track performance accurately, compare trends effectively, and make confident decisions.
Moreover, its structured design, detailed KPI tracking, and user-friendly navigation make it an essential analytics tool for modern travel retail businesses.
Click to Purchases Duty-Free Retail KPI Dashboard in Power BI
Frequently Asked Questions (FAQs)
What is a Duty-Free Retail KPI Dashboard in Power BI?
It is an interactive analytics dashboard that tracks duty-free retail KPIs using Power BI and Excel data sources.
Can I customize KPIs in this dashboard?
Yes, you can add, remove, or modify KPIs by updating the Excel data file.
Does this dashboard support MTD and YTD analysis?
Yes, it provides detailed MTD and YTD performance tracking.
Is Excel mandatory as a data source?
Yes, this dashboard uses Excel for easy data entry and maintenance.
Can non-technical users use this dashboard?
Yes, the dashboard design focuses on simplicity and usability.
Does the dashboard compare current year and previous year data?
Yes, it includes CY vs PY comparisons for both MTD and YTD.
Can this dashboard scale for multiple locations?
Yes, you can extend the data model to support multiple stores or airports.
Click to Purchases Duty-Free Retail KPI Dashboard in Power BI
Visit our YouTube channel to learn step-by-step video tutorials