In today’s dynamic business world, managing employee performance effectively is not just a requirement but a strategic priority. Organizations need to continuously track and analyze employee contributions, identify development opportunities, and recognize top performers. The Employee Performance Review Dashboard in Power BI is a powerful and ready-to-use solution that transforms performance data into insightful visuals, helping HR leaders and managers make smarter decisions.
This article explores everything you need to know about this innovative dashboard—from its core features and benefits to best practices and real-world applications.
Click to Purchases Employee Performance Review Dashboard in Power BI
What Is an Employee Performance Review Dashboard?
An Employee Performance Review Dashboard is a data visualization tool built in Power BI that captures and displays key metrics related to employee performance. These metrics may include communication, teamwork, punctuality, technical skills, and more. By centralizing this data, the dashboard allows decision-makers to monitor performance trends, identify strengths, and uncover areas that need improvement.
This Power BI dashboard works with an underlying Excel dataset and consists of five interconnected pages, each providing a unique lens into employee performance.
Key Features of the Employee Performance Review Dashboard
Let’s take a deeper look at the five pages included in this Power BI dashboard:
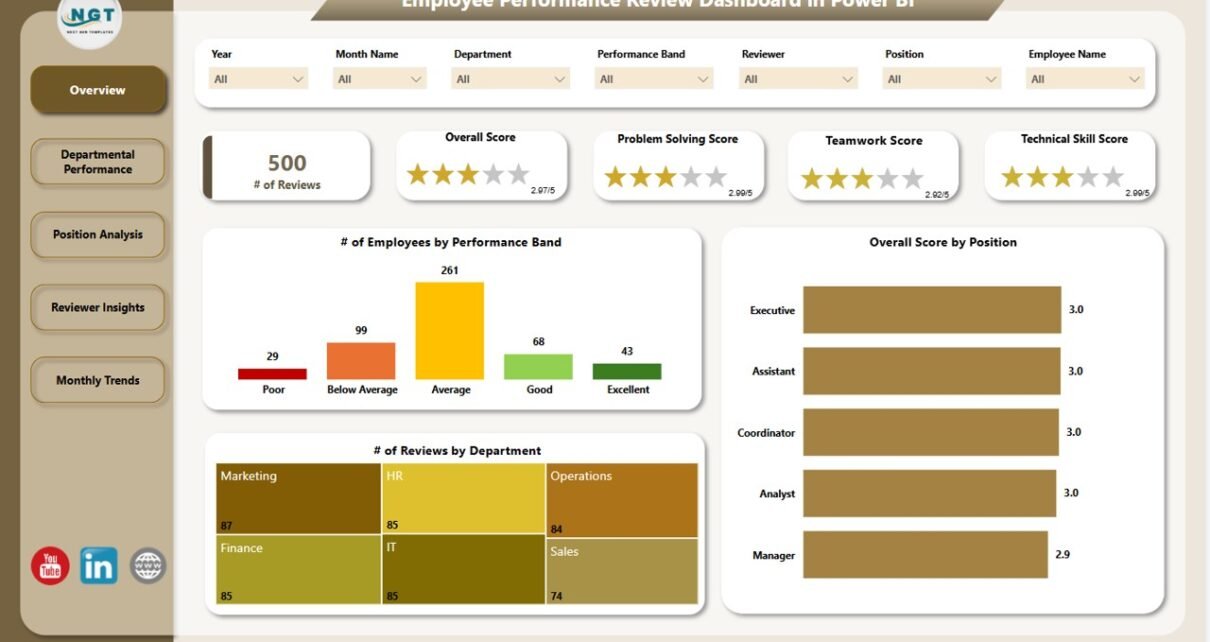
Overview Page
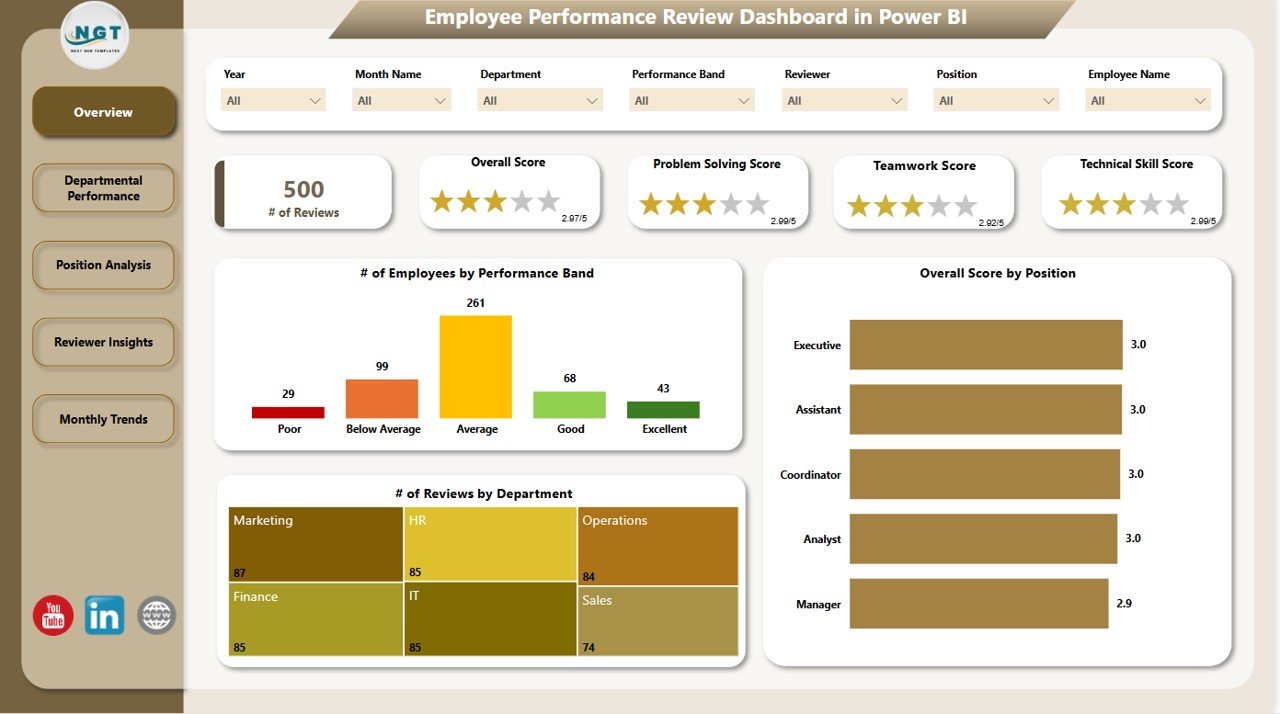
The Overview Page is the central hub of the dashboard. It gives a snapshot of the overall performance landscape across the organization.
- Cards: Displays key metrics like average scores and counts
Charts:
- Number of Employees by Performance Band
- Overall Score by Position
- Number of Reviews by Department
This page includes 7 slicers to filter the data by various dimensions like department, reviewer, date, etc.
Departmental Performance Page
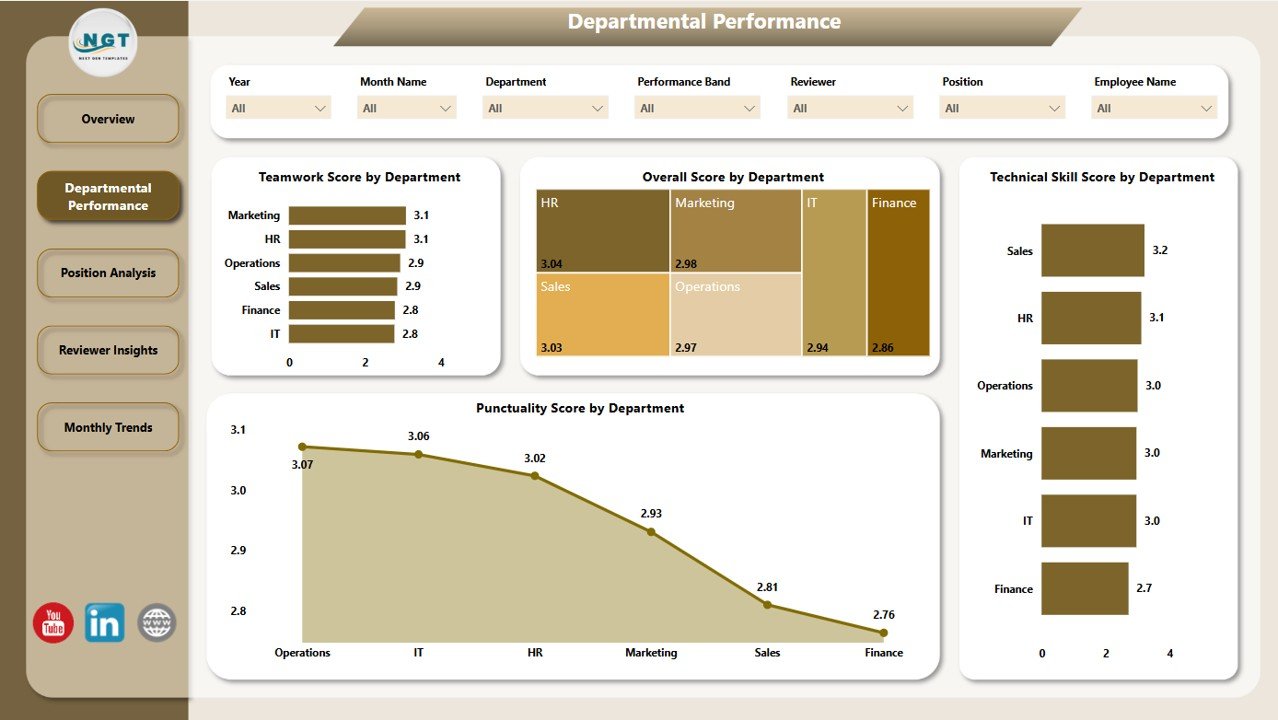
This section focuses on how each department performs in key areas. It’s extremely useful for department heads and HR professionals.
- Charts:
- Teamwork Core Score by Department
- Overall Score by Department
- Technical Skill Score by Department
- Punctuality Score by Department
Like other pages, it includes 7 slicers to filter the data interactively.
Click to Purchases Employee Performance Review Dashboard in Power BI
Position Analysis Page
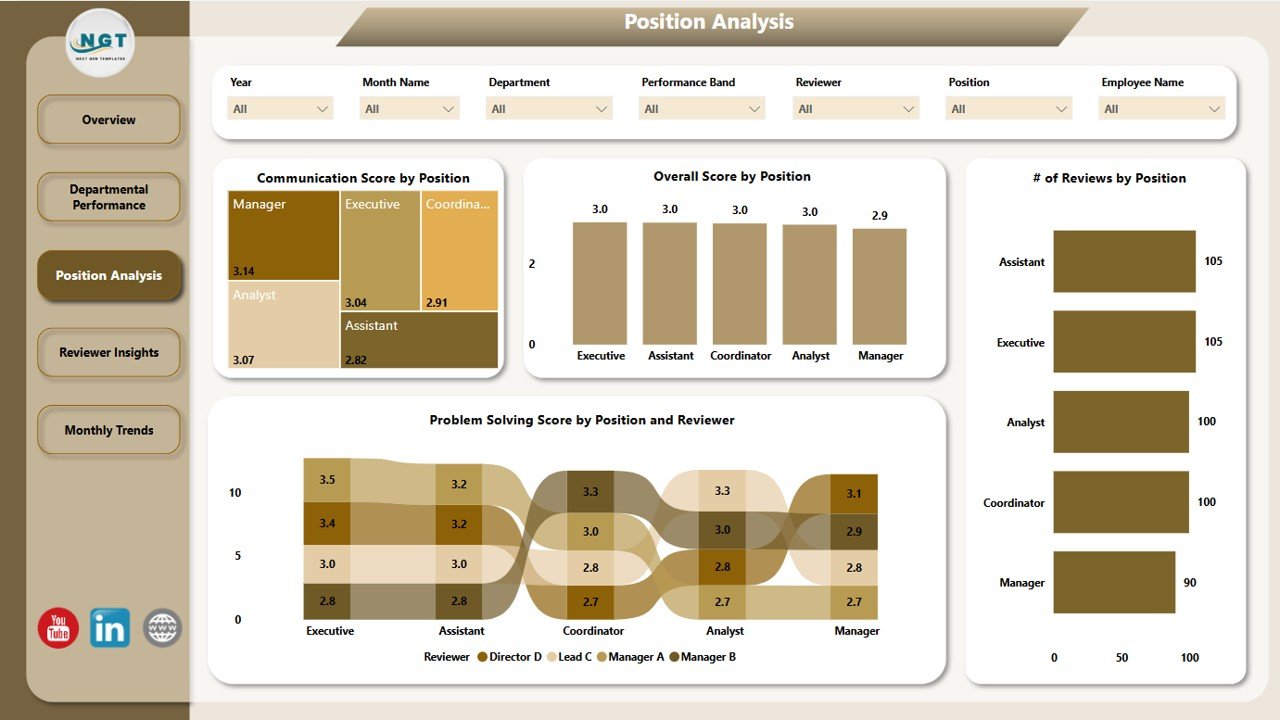
This page analyzes performance based on job roles or positions.
Charts:
- Communication Score by Position
- Overall Score by Position
- Number of Reviews by Position
- Problem-Solving Score by Position and Reviewer
Again, 7 slicers are available to fine-tune the analysis.
Reviewer Insights Page
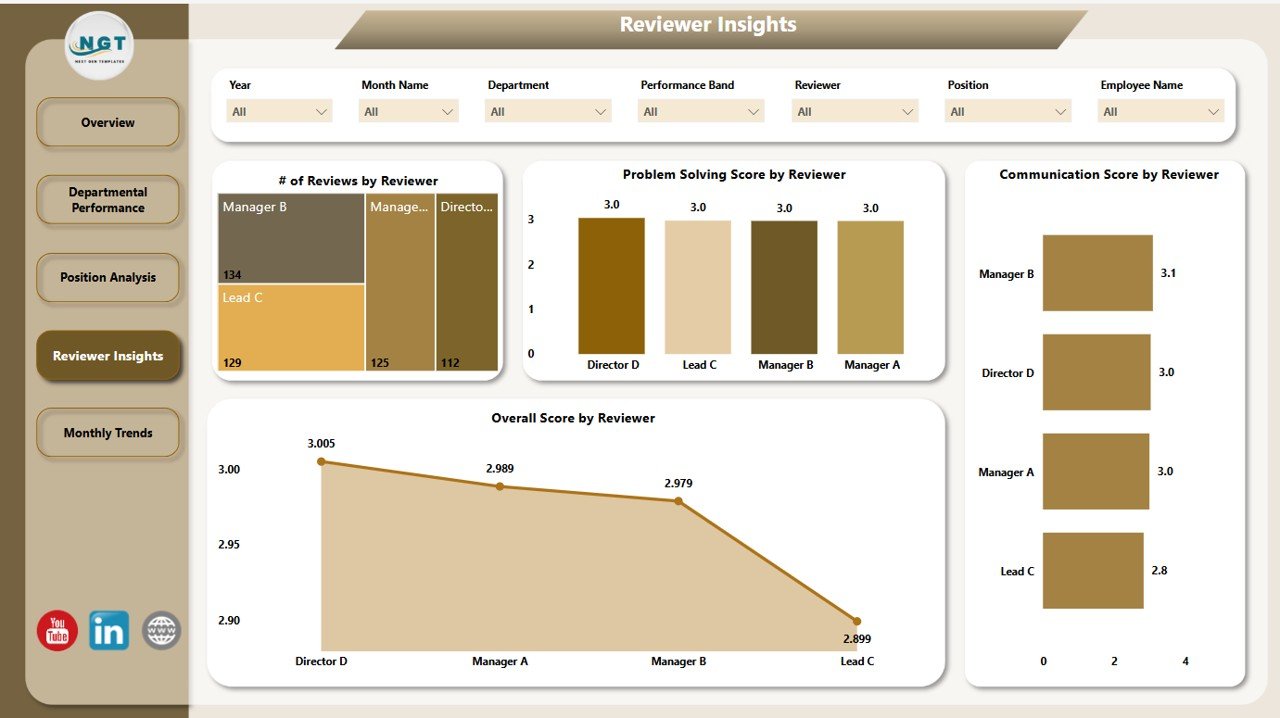
This page helps evaluate the reviewers themselves, giving insight into their effectiveness and focus areas.
Charts:
- Utilization (%) by Role
- Total Allocated Hours by Role
- Number of Resources by Role
- Progress (%) by Role
7 slicers provide customization to dig deeper into reviewer-related data.
Monthly Trends Page
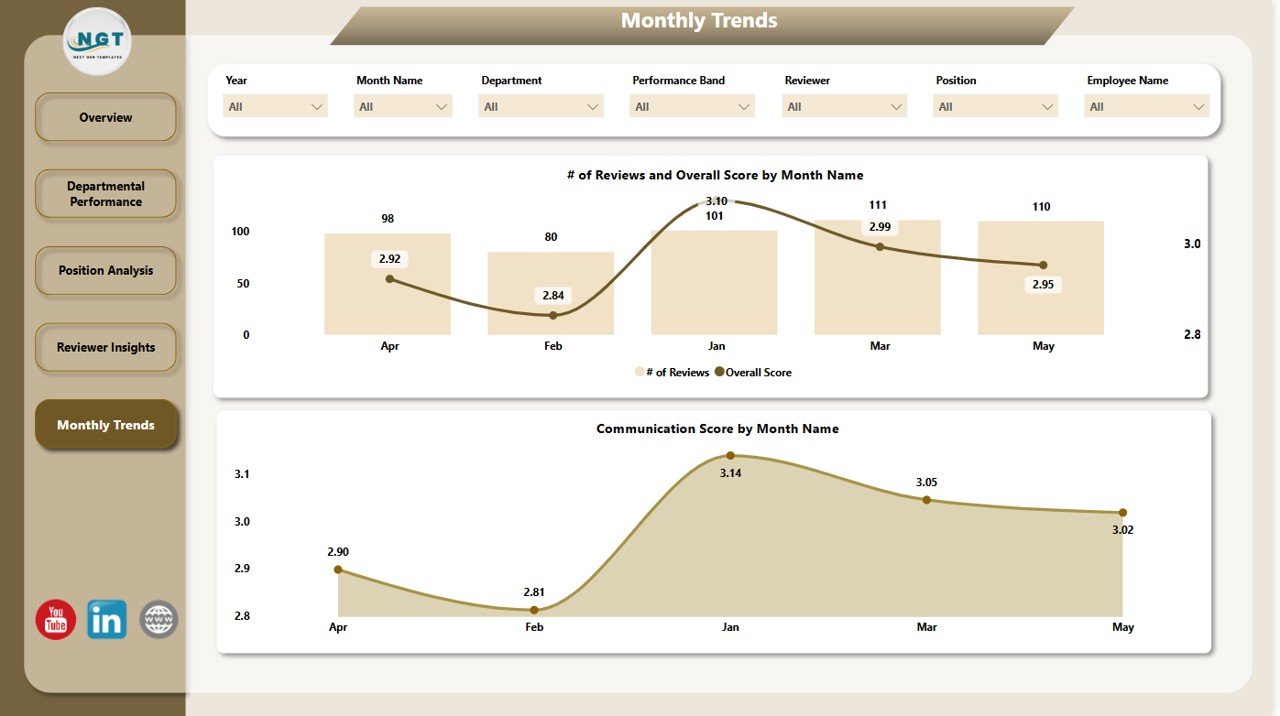
Monitoring monthly performance trends is key to understanding patterns over time.
Charts:
- Number of Reviews and Overall Score by Month
- Communication Score by Month
It also includes 7 slicers to break down the data further.
Click to Purchases Employee Performance Review Dashboard in Power BI
Why Use Power BI for Employee Performance Reviews?
Power BI is widely recognized for its ability to turn raw data into compelling visual reports. Here’s why it’s the ideal platform for employee performance dashboards:
- Interactive filtering and drill-downs
- Automatic updates from Excel datasets
- Custom visualizations tailored to HR needs
- Data security and sharing options
Advantages of Employee Performance Review Dashboard
Using this dashboard offers several tangible benefits for organizations:
✅ Real-Time Performance Monitoring: Always stay up to date with the latest employee data.
✅ Data-Driven Decision Making: Make better HR decisions backed by facts, not intuition.
✅ Transparency & Fairness: Standardized performance metrics promote fairness.
✅ Improved Employee Engagement: Recognize and reward top performers with concrete data.
✅ Custom Views: Tailor reports by department, role, or reviewer.
✅ Enhanced Reporting for Managers: Save time by automating performance summaries.
Best Practices for Using an Employee Performance Review Dashboard
Follow these best practices to get the most value out of your dashboard:
1. Keep the Data Updated
Always maintain a clean and updated Excel file as the data source.
2. Use Slicers Strategically
Leverage slicers to create dynamic views for different users (e.g., managers, HR teams).
3. Review Trends, Not Just Snapshots
Monthly trend charts provide context to short-term fluctuations.
4. Standardize the Metrics
Ensure all departments use the same scoring scale for consistency.
5. Train Managers on Interpretation
Give basic training to department heads on how to interpret visualizations.
6. Secure Sensitive Data
Use Power BI’s security roles to restrict access to confidential data.
Click to Purchases Employee Performance Review Dashboard in Power BI
How to Set Up the Employee Performance Review Dashboard in Power BI?
Setting up this dashboard is simple if you follow the steps below:
- Prepare Your Excel Dataset: Include columns like Employee ID, Name, Department, Reviewer, Date, Score Types (e.g., Communication, Teamwork).
- Load Data into Power BI: Connect the Excel file and verify column mapping.
- Create Relationships: Set relationships between data tables if you are using multiple sheets.
- Build Visualizations: Use bar charts, donut charts, and KPI cards.
- Add Slicers: Add filters for Department, Reviewer, Date, Position, etc.
- Design Five Report Pages: As detailed in the earlier sections.
- Publish and Share: Upload to Power BI Service and assign role-level security.
Who Can Benefit from This Dashboard?
This dashboard is designed for a wide range of users across the organization:
- HR Managers: For performance evaluation and talent management
- Department Heads: To track team performance and progress
- Executives: To understand the organization’s health from a talent perspective
- Team Leads: To provide feedback and set development goals
Real-World Applications
Organizations across industries are using this dashboard to:
📊 Evaluate training program effectiveness
📊 Identify high-potential employees
📊 Compare performance between roles or departments
📊 Make promotion and compensation decisions
📊 Align employee goals with business objectives
How Does This Dashboard Improve Employee Management?
This tool encourages regular feedback, highlights both achievements and concerns, and enables better career development planning. Instead of relying on annual reviews alone, this dashboard promotes a continuous performance review culture.
Conclusion
The Employee Performance Review Dashboard in Power BI empowers HR teams and managers with the insights they need to nurture talent, boost productivity, and build a high-performing workforce. Its interactive visuals, real-time tracking, and structured layout make it a must-have tool for modern businesses.
By adopting this solution, organizations can move from subjective evaluations to a transparent, data-backed performance culture.
Frequently Asked Questions (FAQs)
Q1: What data source does this dashboard use?
A: The dashboard connects to an Excel file containing employee review data.
Q2: Can I customize the charts?
A: Yes, you can modify visualizations to suit your organization’s KPIs.
Q3: Is Power BI required to use this dashboard?
A: Yes, it is designed for Power BI Desktop and Power BI Service.
Q4: Can we add new KPIs?
A: Absolutely! You can expand the dataset and update visuals accordingly.
Q5: How often should I update the data?
A: Ideally, update the Excel dataset monthly or after every review cycle.
Q6: Can I use this for remote teams?
A: Yes, as long as you collect consistent performance data, remote teams can benefit equally.
Q7: How secure is the dashboard?
A: Power BI allows role-level security to ensure only authorized users view sensitive data.
Q8: What skills do I need to maintain the dashboard?
A: Basic Power BI and Excel skills are enough to keep it running smoothly.
Click to Purchases Employee Performance Review Dashboard in Power BI
Visit our YouTube channel to learn step-by-step video tutorials
Watch the step-by-step video tutorial: