In today’s corporate landscape, environmental and sustainability compliance is no longer optional—it’s essential. Companies face increasing pressure from governments, investors, and consumers to not just talk about sustainability but to show real progress. This is where an Environmental and Sustainability Compliance KPI Dashboard in Excel becomes a powerful tool.
This article will walk you through everything you need to know about this dashboard—what it is, why it matters, how it works, and how to make the most of it.
Click to Purchases Environmental and Sustainability Compliance KPI Dashboard in Excel
What Is an Environmental and Sustainability Compliance KPI Dashboard in Excel?
An Environmental and Sustainability Compliance KPI Dashboard in Excel is a centralized tracking system that helps businesses monitor, measure, and manage their environmental performance and compliance-related goals. It offers a clear, visual way to evaluate Key Performance Indicators (KPIs) related to:
-
Carbon emissions
-
Waste reduction
-
Water usage
-
Energy consumption
-
Compliance metrics
-
Environmental audits
All of this happens in Excel, making the solution affordable, flexible, and customizable—no need for expensive software.
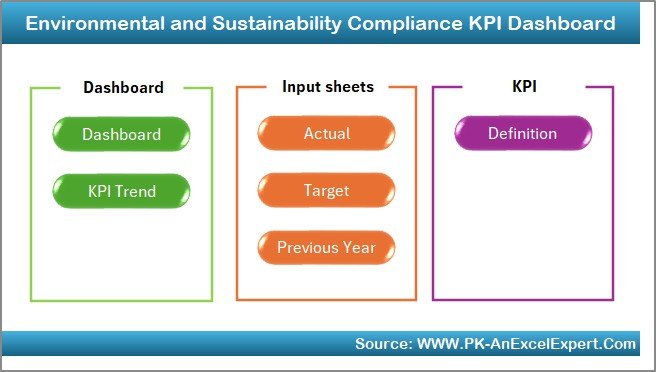
Key Features of the Dashboard
This dashboard is organized into 7 powerful worksheet tabs, each designed for a specific function:
Home Sheet
-
Acts as the navigation center of the dashboard.
-
Includes 6 interactive buttons to jump to specific sheets (Dashboard, KPI Trend, Target, Actual Input, PY Numbers, KPI Definition).
-
Helps users quickly locate the section they need.
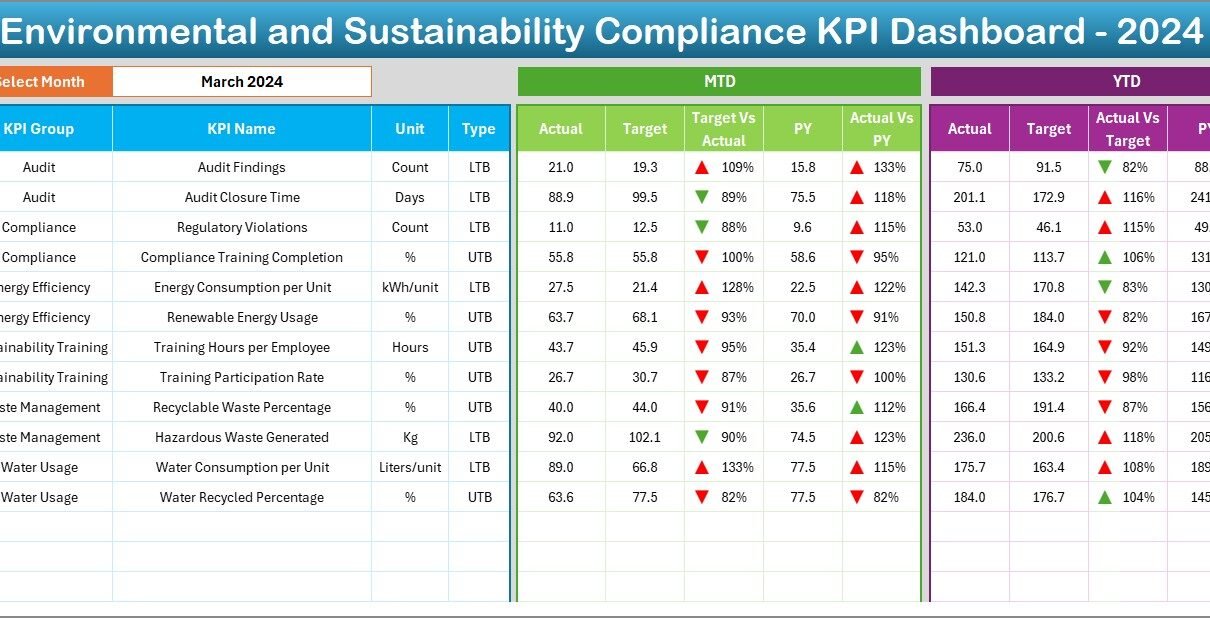
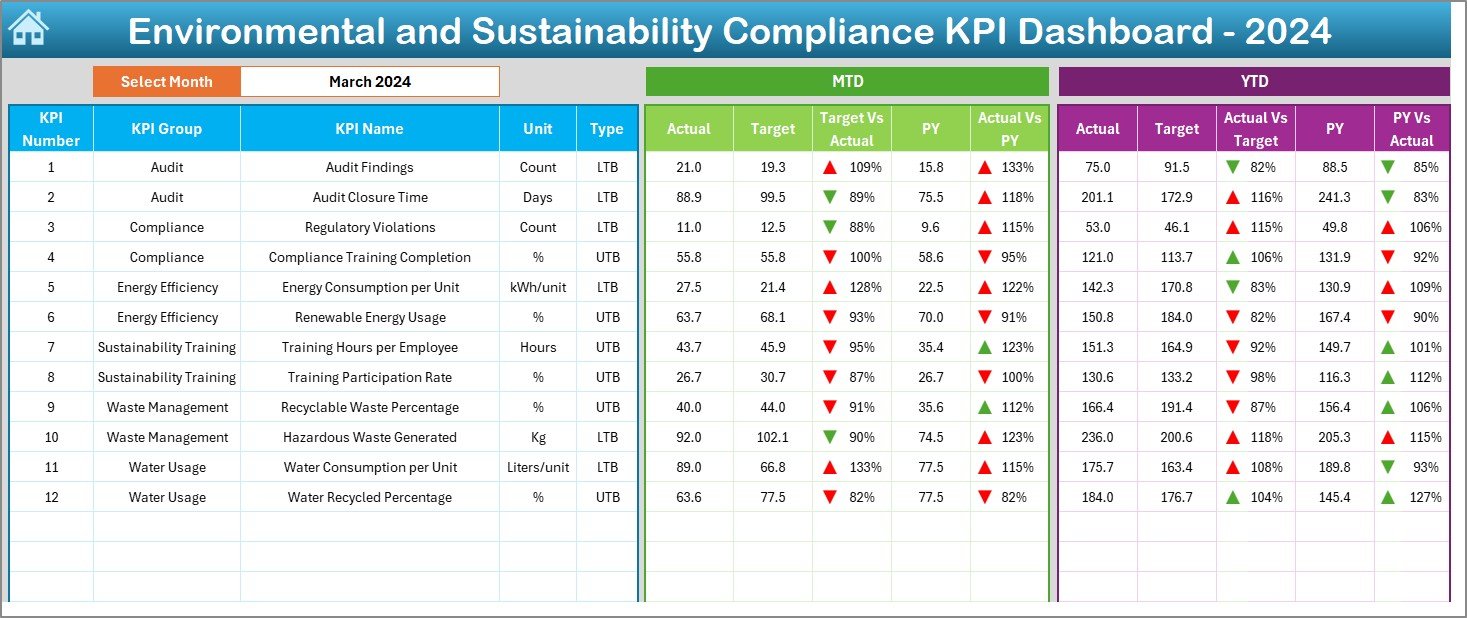
Dashboard Sheet Tab
-
This is the main visualization page.
-
Select the desired month from a dropdown in cell D3.
Automatically updates to show:
- MTD (Month-To-Date) values
- YTD (Year-To-Date) values
- Target vs. Actual
- Previous Year vs. Actual
-
Uses conditional formatting with up/down arrows to display performance status visually.
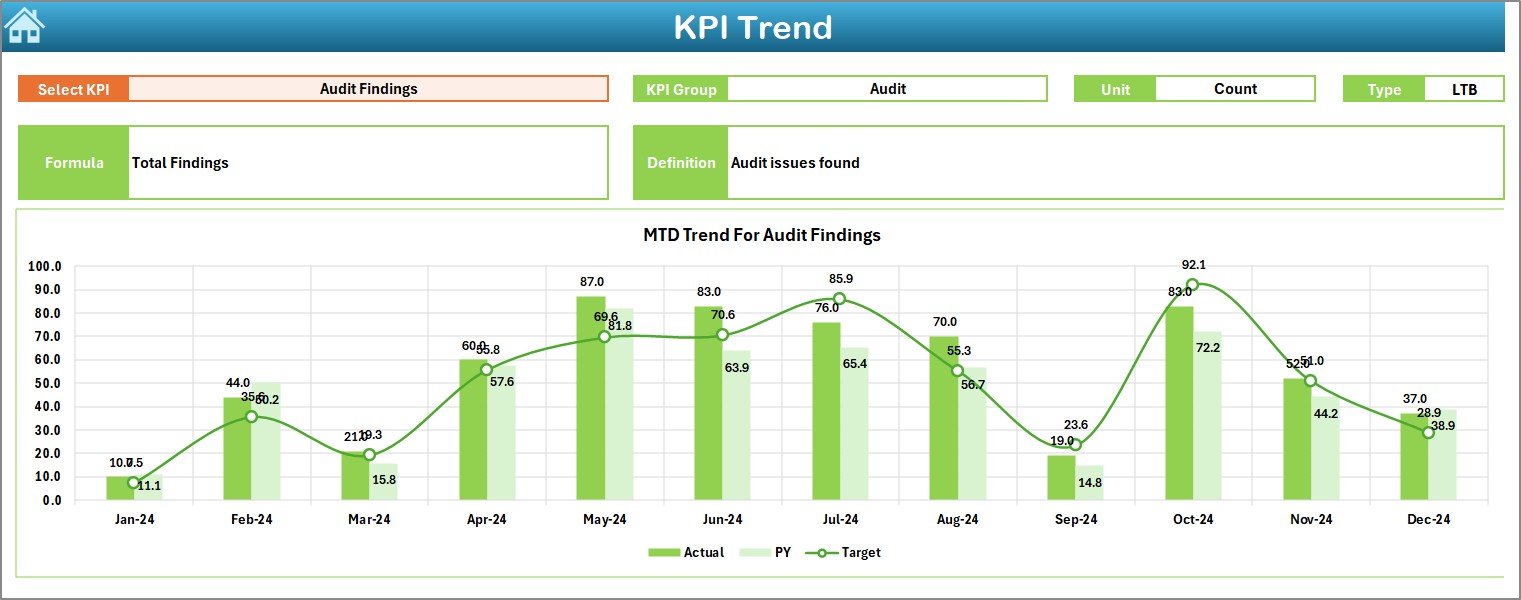
KPI Trend Sheet Tab
-
Lets you analyze KPI-level performance trends.
-
Choose a KPI from a dropdown in cell C3.
Displays:
- KPI Group, Unit, Formula, and Definition
- Type (LTB: Lower the Better, or UTB: Upper the Better)
- Graphs for both MTD and YTD data trends
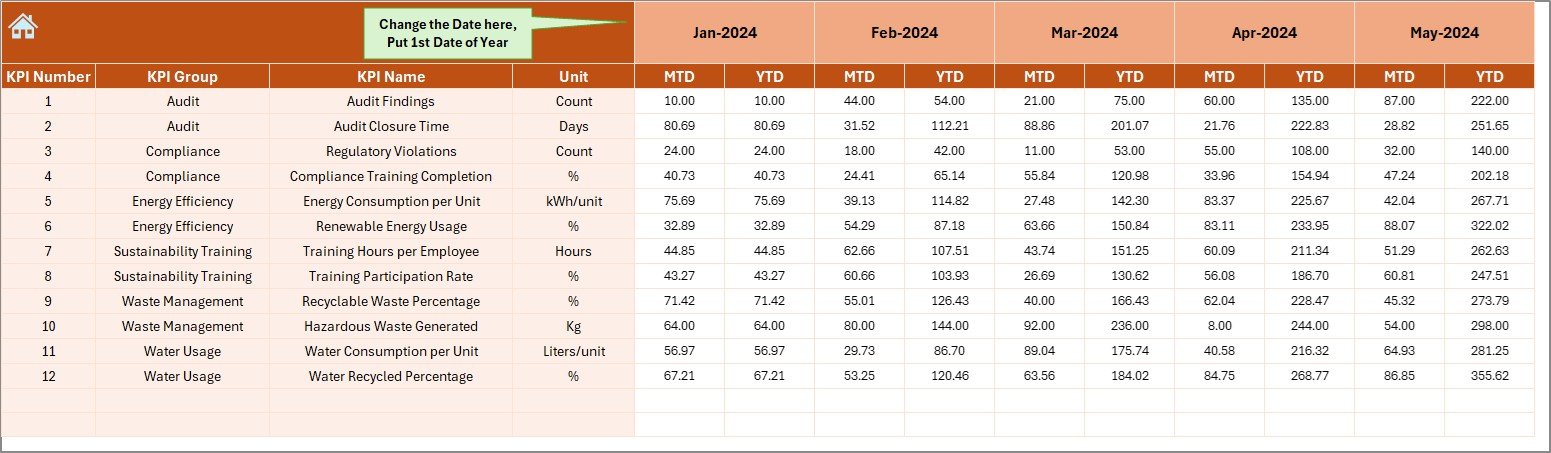
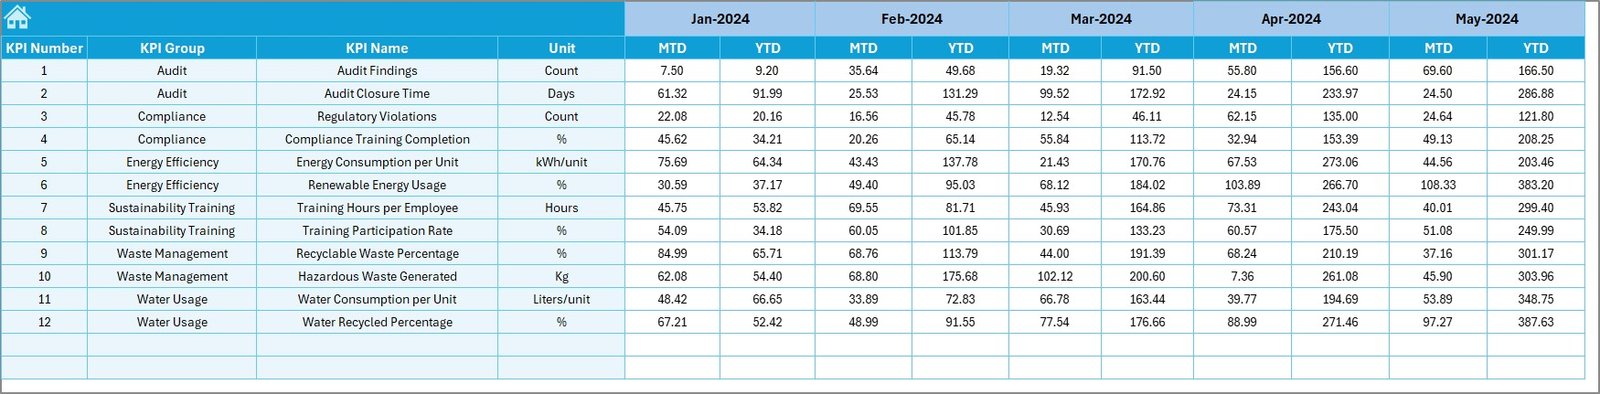
Actual Numbers Input Sheet
-
This sheet collects real-time operational data.
-
Select the starting month in cell E1.
-
Enter both MTD and YTD actual values per KPI.
-
Ensures data accuracy and month-wise segregation.
Target Sheet Tab
-
Input target values for each KPI.
-
Tracks both MTD and YTD targets.
-
Enables performance comparison and goal setting.
Previous Year Numbers Sheet
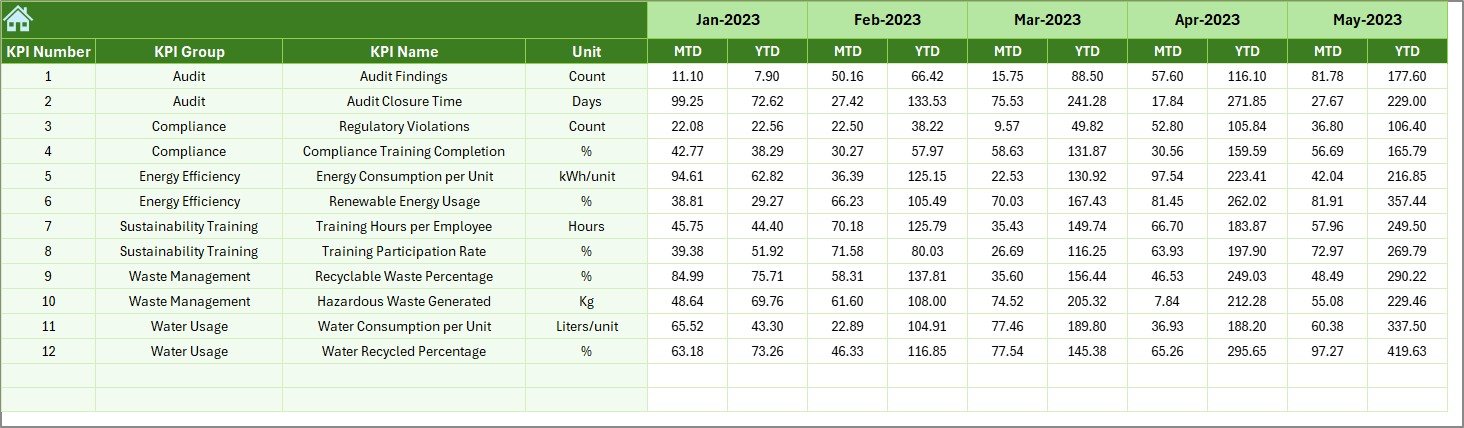
-
Enter the previous year’s data in the same structure as the current year.
-
Enables year-over-year (YoY) analysis for better forecasting.
Click to Purchases Environmental and Sustainability Compliance KPI Dashboard in Excel
KPI Definition Sheet
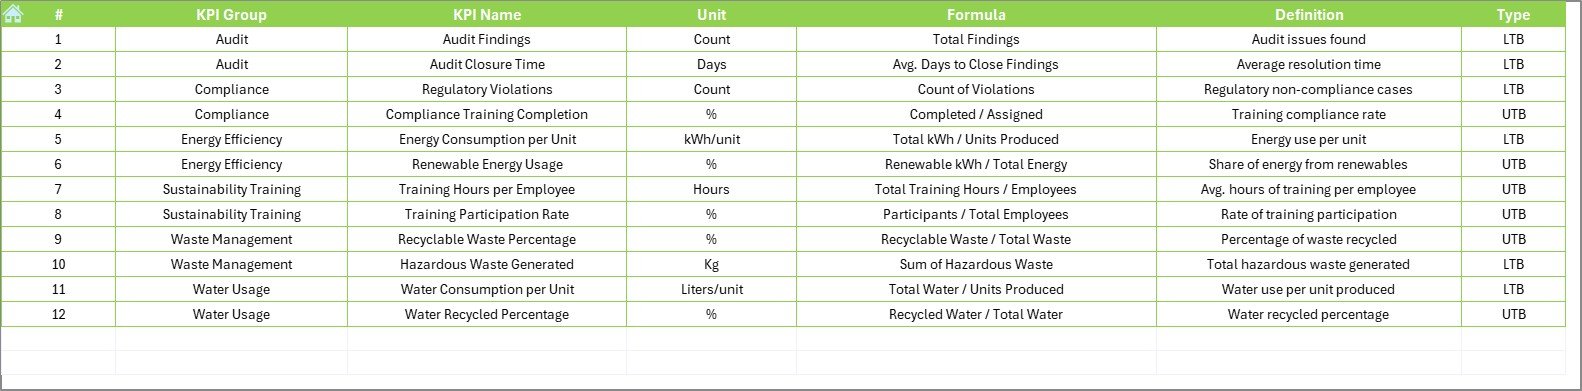
Defines every KPI in a structured format:
- KPI Name
- KPI Group
- Unit of Measurement
- Calculation Formula
- Short Definition
Why Do You Need a Sustainability Compliance KPI Dashboard?
Still wondering why this tool matters? Here’s why your organization can’t afford to skip it:
🔍 Track regulatory compliance in real-time
🌱 Support sustainability goals with data
📉 Identify underperformance before it becomes a risk
🗂️ Centralize information for audits and stakeholders
💰 Reduce operational costs through resource efficiency
📊 Enable data-driven decision-making
Advantages of Environmental and Sustainability Compliance KPI Dashboard
Let’s explore some of the key benefits:
📌 1. Centralized Monitoring
-
Tracks all KPIs in one place
-
Eliminates scattered spreadsheets and manual reports
📌 2. Informed Decision-Making
-
Combines current, target, and past year data for each KPI
-
Helps leaders act based on real trends and metrics
📌 3. Enhanced Compliance
-
Makes it easy to monitor legal obligations
-
Prepares the business for inspections or environmental audits
📌 4. Visual Insights
-
Conditional formatting and charts highlight performance issues at a glance
-
Enables non-technical users to understand the data
📌 5. Easy Customization
-
Built in Excel, it allows editing, adding, or removing KPIs as needed
-
No programming required
Best Practices for Using the Dashboard
To maximize the power of this dashboard, follow these best practices:
✅ Keep KPI Definitions Clear
-
Use simple and universally understood terminology
-
Ensure everyone interprets each KPI the same way
✅ Update Data Monthly
-
Enter MTD and YTD figures consistently
-
Ensure month ranges are properly set to avoid formula errors
✅ Set Realistic Targets
-
Base them on historical performance and industry standards
-
Review and adjust as needed quarterly
✅ Train Your Team
-
Make sure stakeholders understand how to read the dashboard
-
Run periodic training sessions to interpret charts and indicators
✅ Protect Data Integrity
-
Lock formula cells
-
Use dropdowns to minimize input errors
✅ Archive Data Annually
-
Keep historical data to analyze trends over multiple years
-
Create a new file version each year for clean records
How to Customize the Dashboard for Your Organization?
Even though this dashboard comes ready-to-use, you might want to tailor it for your unique operations. Here’s how:
1. Add More KPIs
-
Open the KPI Definition sheet and add more rows
-
Add formulas and define them clearly
2. Adjust the Layout
-
Insert your company logo on the Home or Dashboard tab
-
Add a color theme consistent with your brand
3. Integrate with Other Data
-
Use Excel Power Query to pull data from your ERP or Google Sheets
-
Set up dynamic ranges for future-proofing
4. Automate Alerts
-
Use conditional formatting for threshold warnings
-
Set up email alerts using Excel VBA for critical non-compliance areas
Case Study: Real-World Use
GreenEdge Industries, a mid-sized manufacturer, adopted this Excel-based dashboard to improve its environmental reporting.
Before:
-
Compliance data was scattered across 5 departments
-
Reporting was manual and time-consuming
After:
-
They unified their KPI tracking in this dashboard
-
Reduced audit preparation time by 60%
-
Improved sustainability scores in vendor certifications
Conclusion
The Environmental and Sustainability Compliance KPI Dashboard in Excel is not just a tool—it’s a strategic asset. It equips organizations to stay compliant, optimize operations, and drive sustainability efforts using clear, visual, and real-time data.
If your business values sustainability and compliance (and it should!), this dashboard provides a simple yet effective solution.
❓ Frequently Asked Questions (FAQs)
1. What software do I need to use this dashboard?
You only need Microsoft Excel (2013 or later) to use this dashboard. No add-ons or external software is required.
2. Can I add more KPIs to the dashboard?
Yes. You can easily add more KPIs in the KPI Definition sheet and update the formulas in all related sheets.
3. How often should I update the actual numbers?
Ideally, update monthly for MTD and YTD data to keep your reports accurate and timely.
4. Is this dashboard suitable for small businesses?
Absolutely. It’s built in Excel, making it budget-friendly and flexible for businesses of all sizes.
5. Can this be used for reporting to regulators or boards?
Yes. The dashboard is clean and structured. You can export visuals or use it live during presentations.
6. What does LTB and UTB mean?
-
LTB: Lower the Better (e.g., CO₂ emissions)
-
UTB: Upper the Better (e.g., Audit Pass Rate)
7. Can I use this dashboard in Google Sheets?
While it’s designed for Excel, most of the logic can be replicated in Google Sheets, but conditional formatting and slicers might require rework.
Visit our YouTube channel to learn step-by-step video tutorials