In today’s eco-conscious world, tracking environmental and sustainability performance is not just a good practice—it’s a strategic necessity. Businesses, government agencies, and nonprofits are increasingly focusing on environmental impact, resource consumption, and sustainable growth. One of the most effective tools to measure this progress is an Environmental and Sustainability Growth Metrics KPI Dashboard in Excel.
This powerful, ready-to-use Excel dashboard enables users to track key performance indicators (KPIs), compare them with targets, and analyze trends over time. Whether you’re an environmental analyst, sustainability officer, or data-driven executive, this dashboard will provide the insights you need to make better, greener decisions.
Click to Purchases Environmental and Sustainability Growth Metrics KPI Dashboard in Excel
What Is an Environmental and Sustainability Growth Metrics KPI Dashboard in Excel?
An Environmental and Sustainability Growth Metrics KPI Dashboard is a data-driven tool built in Microsoft Excel. It consolidates, visualizes, and analyzes environmental and sustainability KPIs across multiple dimensions such as energy usage, waste reduction, emissions control, water conservation, and more.
It includes key comparative metrics such as:
-
MTD (Month-to-Date) Actual vs. Target vs. Previous Year
-
YTD (Year-to-Date) Actual vs. Target vs. Previous Year
-
Trend charts to monitor performance over time
The dashboard design ensures that you can view all KPIs at a glance, drill down into monthly performance, and get real-time updates by changing a single month from a dropdown.
Key Features of the Dashboard
This Excel-based KPI dashboard consists of 7 dynamic worksheet tabs that make performance tracking simple, intuitive, and efficient.
Home Sheet (Navigation Hub)
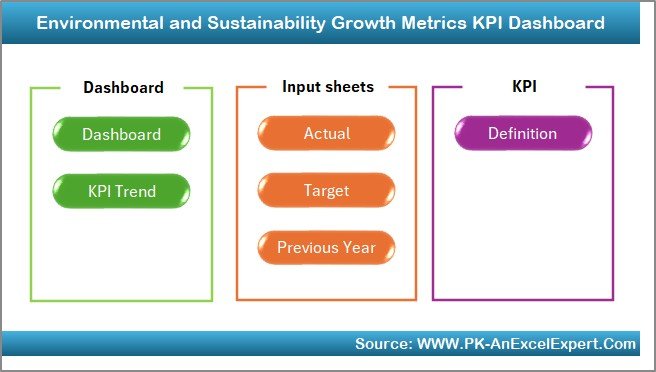
This serves as the main index page. It contains six clickable buttons that act as navigation links to each respective worksheet.
Dashboard Sheet (Main Visual Overview)
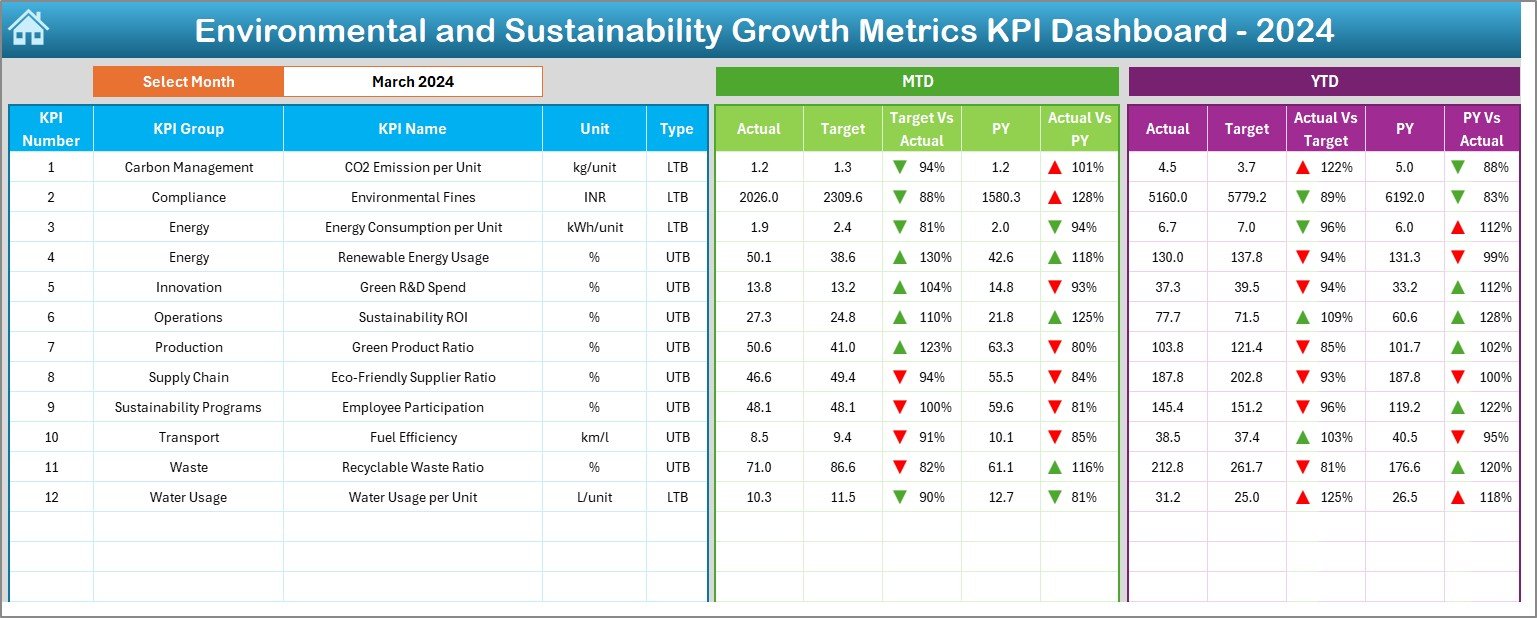
This is the centerpiece of the template. Users can select a specific month from cell D3 to update the visuals and data instantly.
It displays:
-
MTD Actual, Target, and Previous Year values with trend arrows
-
YTD Actual, Target, and Previous Year metrics with visual indicators
-
Conditional formatting with up/down arrows for quick insights
KPI Trend Sheet
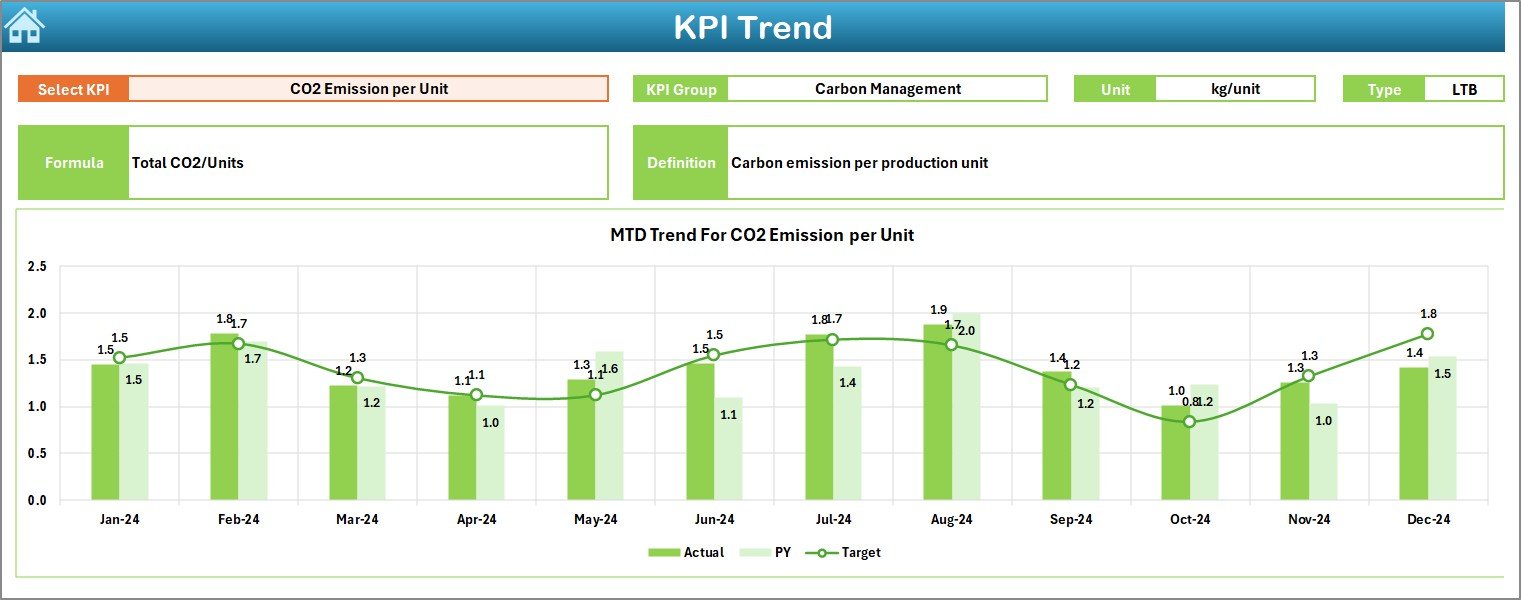
This tab allows you to select any KPI from a dropdown in cell C3 and view its:
-
KPI Group
-
Unit of measurement
-
Type (LTB: Lower the Better or UTB: Upper the Better)
-
Formula and definition
-
MTD and YTD trend charts for Actual, Target, and Previous Year
Click to Purchases Environmental and Sustainability Growth Metrics KPI Dashboard in Excel
Actual Numbers Input Sheet
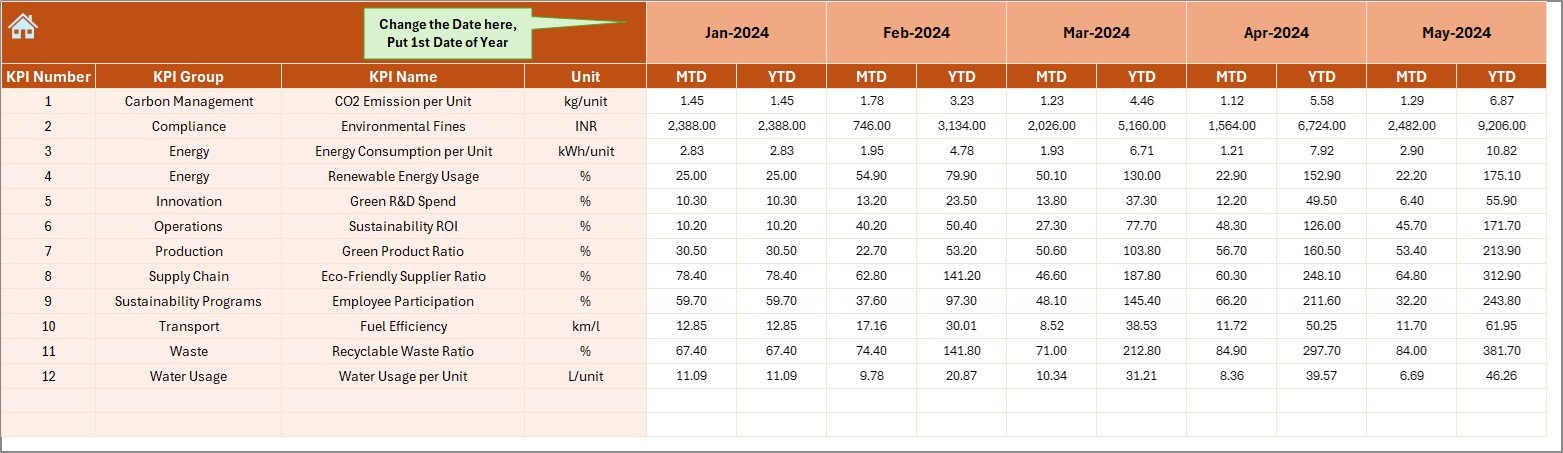
Manually input your monthly and year-to-date actual values here. Select the first month of the year in cell E1 to configure the reporting period.
Target Sheet
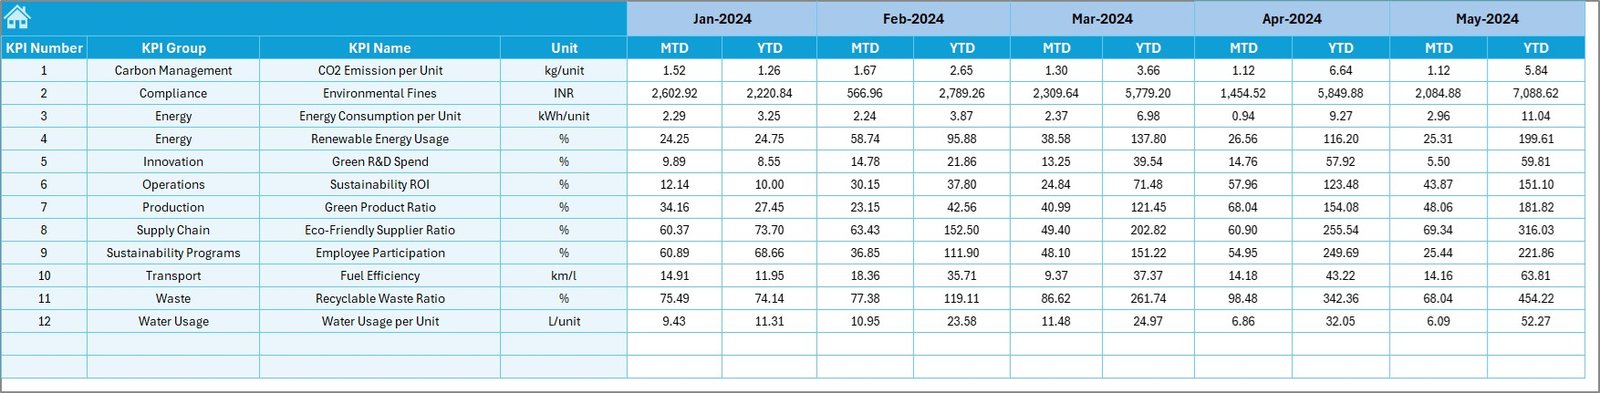
Input monthly and YTD targets for each KPI. This helps benchmark your performance goals and drives accountability.
Previous Year Number Sheet
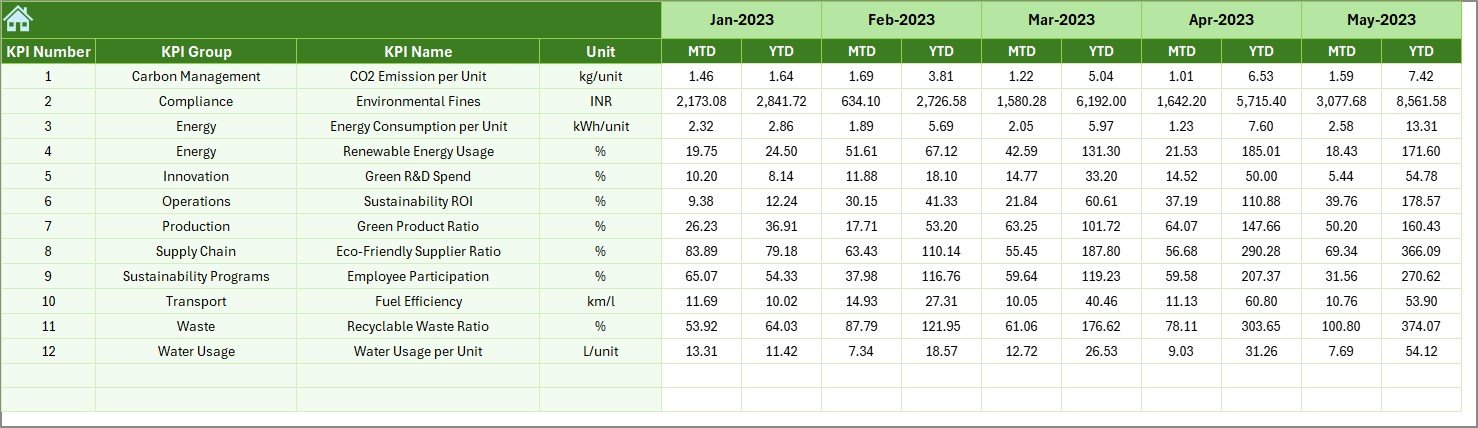
Enter historical data from the previous year to enable comparative analysis and growth tracking.
KPI Definition Sheet
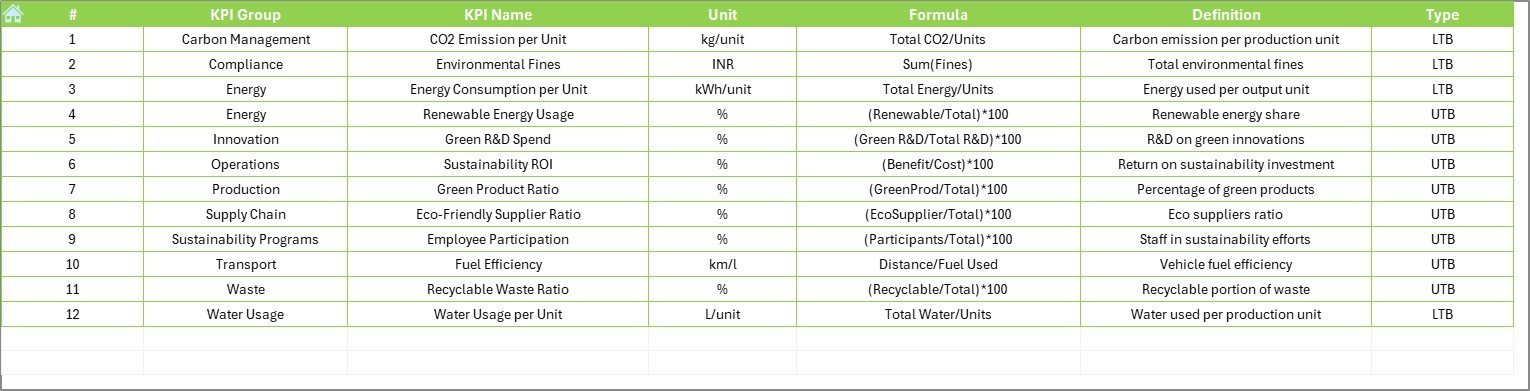
Store and update KPI details like:
-
KPI Group
-
KPI Name
-
Unit
-
Formula
-
KPI Type (UTB or LTB)
-
Short definition
This serves as the reference backbone of your dashboard.
Why Do You Need This Dashboard?
Environmental metrics and sustainability targets can be hard to monitor without a centralized system. With this Excel dashboard, you can:
-
Align operational activities with environmental goals
-
Ensure transparency in ESG (Environmental, Social, Governance) reporting
-
Enable strategic decisions based on reliable, visual data
-
Track month-over-month and year-over-year growth
-
Easily report on compliance, efficiency, and impact
Advantages of Environmental and Sustainability KPI Dashboard in Excel
Here’s why organizations love this solution:
💡 Easy to Use: Built in Excel, no advanced software needed
📈 Visual Clarity: View MTD/YTD performance with simple charts and arrows
🎯 Goal-Oriented: Instantly compare actuals with targets and previous years
🔄 Real-Time Updating: Change one cell to update the entire dashboard
📁 Structured Sheets: Each tab is focused and easy to navigate
🛠️ Fully Customizable: Add or remove KPIs as needed
💰 Cost-Effective: No licensing fees—Excel is widely accessible
Best Practices for Using the Dashboard Effectively
To get the most out of your Environmental and Sustainability Growth Metrics Dashboard:
💬 Standardize KPI Definitions: Ensure consistency across departments
📅 Update Monthly: Regular updates keep the data relevant and actionable
🎯 Set Realistic Targets: Align with long-term sustainability goals
📝 Track Anomalies: Use trend charts to identify spikes or drops in performance
📊 Use Conditional Formatting: Leverage arrows and colors to highlight critical metrics
🔄 Back Up Data: Keep historical copies to avoid accidental data loss
How Does the KPI Trend Sheet Help?
The KPI Trend Sheet provides valuable insights into whether your sustainability efforts are improving over time. By selecting a KPI, you can view:
-
MTD and YTD charts for Actual, Target, and Previous Year
-
A visual representation of progress (or decline)
-
Clear identification of seasonal impacts or irregularities
How to Use the Input Sheets?
-
Actual Numbers Sheet: Update your monthly results here. Choose the starting month (e.g., January) in cell E1 to define the timeline.
-
Target Sheet: Enter planned values for each KPI. These numbers define your success benchmarks.
-
Previous Year Sheet: Use past data for meaningful comparison and to set realistic growth goals.
Use Case Examples
1. Manufacturing Company
Tracks CO2 emissions, energy usage per unit, and water usage to improve eco-efficiency and lower operational costs.
2. Retail Chain
Monitors packaging waste reduction, use of sustainable materials, and carbon footprint of logistics.
3. University Campus
Tracks water usage, electricity consumption, waste recycling rates, and student engagement in green programs.
Tips for Customizing the Dashboard
-
Add your company logo to the Home sheet for branding.
-
Include a summary section at the top of the Dashboard to highlight key wins or losses.
-
Insert slicers for department, location, or time period for deeper filtering.
-
Expand the KPI Definition sheet to include responsible person or data source.
Conclusion
An Environmental and Sustainability Growth Metrics KPI Dashboard in Excel is more than just a reporting tool—it’s a pathway to measurable impact. By centralizing your sustainability KPIs, comparing them with targets and historical data, and visualizing progress, this dashboard empowers organizations to drive meaningful change.
Whether you’re aiming for ESG compliance, carbon neutrality, or resource efficiency, this Excel template brings clarity and direction to your sustainability journey.
Frequently Asked Questions (FAQs)
1. Who can use this KPI dashboard?
Anyone involved in sustainability reporting, environmental compliance, or strategic planning can use it—including sustainability managers, compliance officers, CSR teams, and analysts.
2. Do I need advanced Excel skills to use the dashboard?
No. The dashboard is user-friendly and requires only basic Excel knowledge like data entry and dropdown selection.
3. Can I add or remove KPIs?
Yes. The dashboard is fully customizable. You can add new KPIs to the KPI Definition and data sheets and extend visuals accordingly.
4. How often should I update the data?
Ideally, you should update it monthly to keep MTD and YTD metrics current and meaningful.
5. What is the difference between LTB and UTB KPIs?
-
LTB (Lower the Better): Metrics like emissions or energy consumption, where lower values indicate better performance.
-
UTB (Upper the Better): Metrics like recycling rate or cost savings, where higher values indicate better outcomes.
6. Can I track location-specific KPIs?
Yes. By adding a location column in your data sheets and updating the pivot charts, you can filter and analyze by location.
Visit our YouTube channel to learn step-by-step video tutorials
Click to Purchases Environmental and Sustainability Growth Metrics KPI Dashboard in Excel