In today’s world, organizations cannot overlook their responsibility toward environmental sustainability. As corporate and government bodies push for greener practices, companies must align their training and development strategies with sustainability goals. One powerful way to monitor this alignment is by using a well-structured Environmental and Sustainability Training and Development KPI Dashboard in Excel.
This article introduces a ready-to-use Excel dashboard that simplifies tracking and analyzing key sustainability training metrics. Whether you’re managing training across departments or measuring long-term impact, this tool empowers you with the right insights — in real time.
Let’s explore everything you need to know about this dashboard, its benefits, structure, best practices, and more.
Click to Purchases Environmental and Sustainability Training and Development KPI Dashboard in Excel
What is an Environmental and Sustainability Training and Development KPI Dashboard?
An Environmental and Sustainability Training and Development KPI Dashboard is an Excel-based performance monitoring tool that helps organizations:
-
Track employee training related to environmental and sustainability goals
-
Analyze KPIs such as training completion rate, hours spent, and employee engagement
-
Compare monthly progress with targets and historical performance
-
Make informed decisions for improving sustainability training programs
This dashboard ensures that green training initiatives are measurable, data-driven, and aligned with organizational sustainability commitments.
Key Features of the Excel Dashboard Template
This comprehensive tool includes seven powerful worksheets, all linked together for automated updates and simplified usage:
Home Sheet
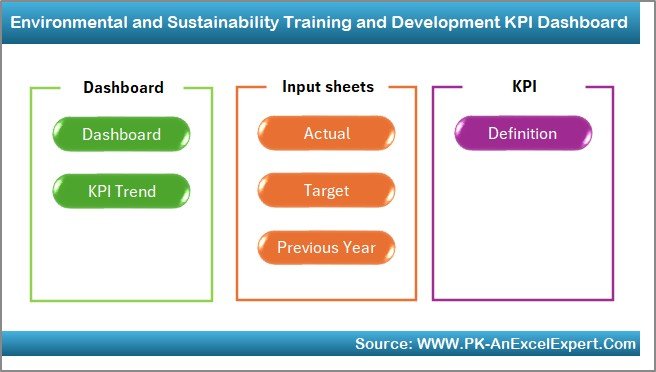
The Home sheet acts as a navigation hub. It includes six buttons that let you jump directly to:
-
Dashboard
-
KPI Trend
-
Actual Numbers Input
-
Target
-
Previous Year Numbers
-
KPI Definition
This makes it easy for users to access and update the required section without manual searching.
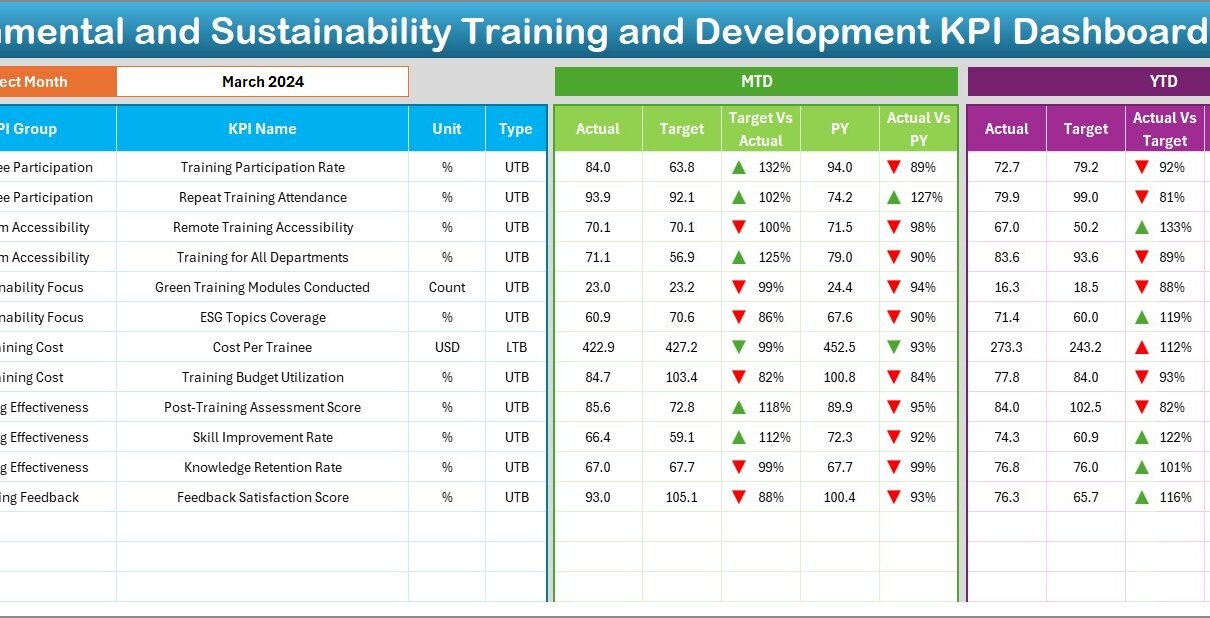
Dashboard Sheet
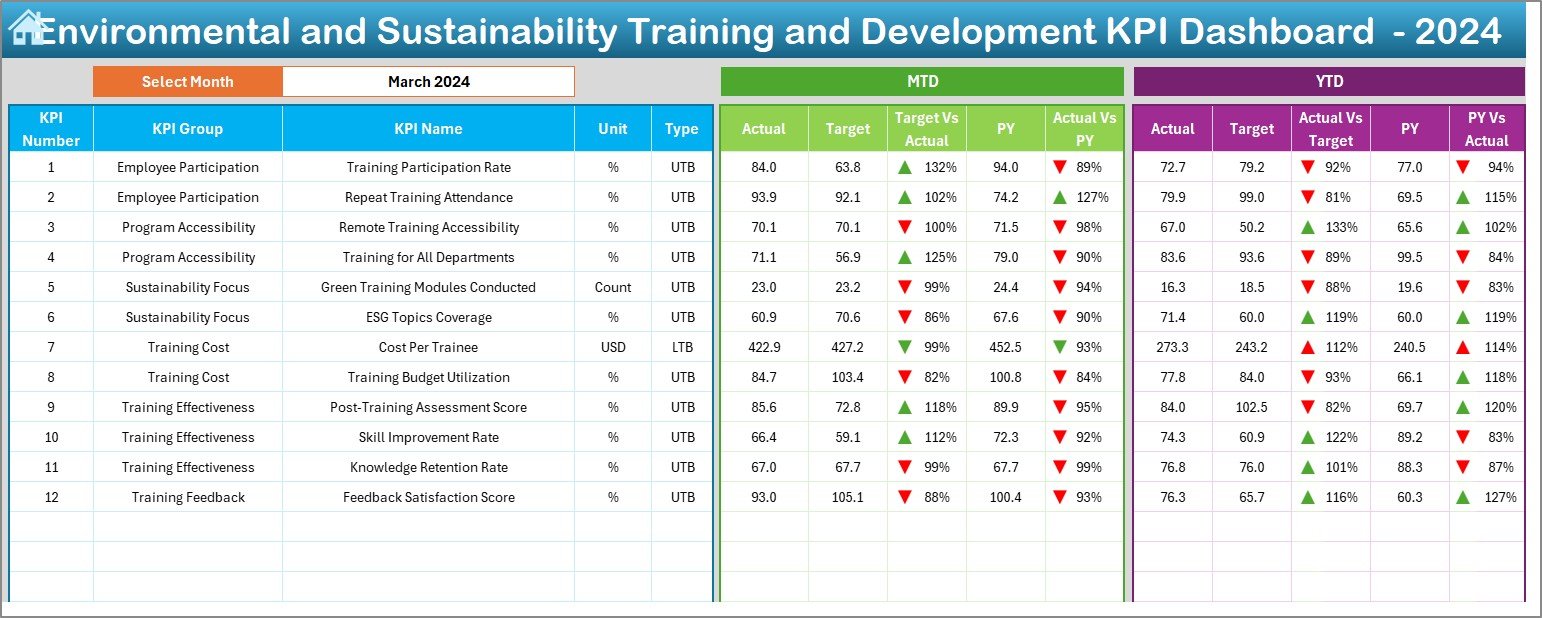
This is the core analytics page. Once you select a month from the dropdown in cell D3, the entire dashboard updates to reflect data for that period.
Displayed KPIs include:
-
Month-To-Date (MTD) Actual, Target, and Previous Year (PY) values
-
Year-To-Date (YTD) Actual, Target, and PY values
-
Conditional formatting with up/down arrows highlights improvements or declines
This helps stakeholders immediately assess training effectiveness and sustainability alignment.
KPI Trend Sheet
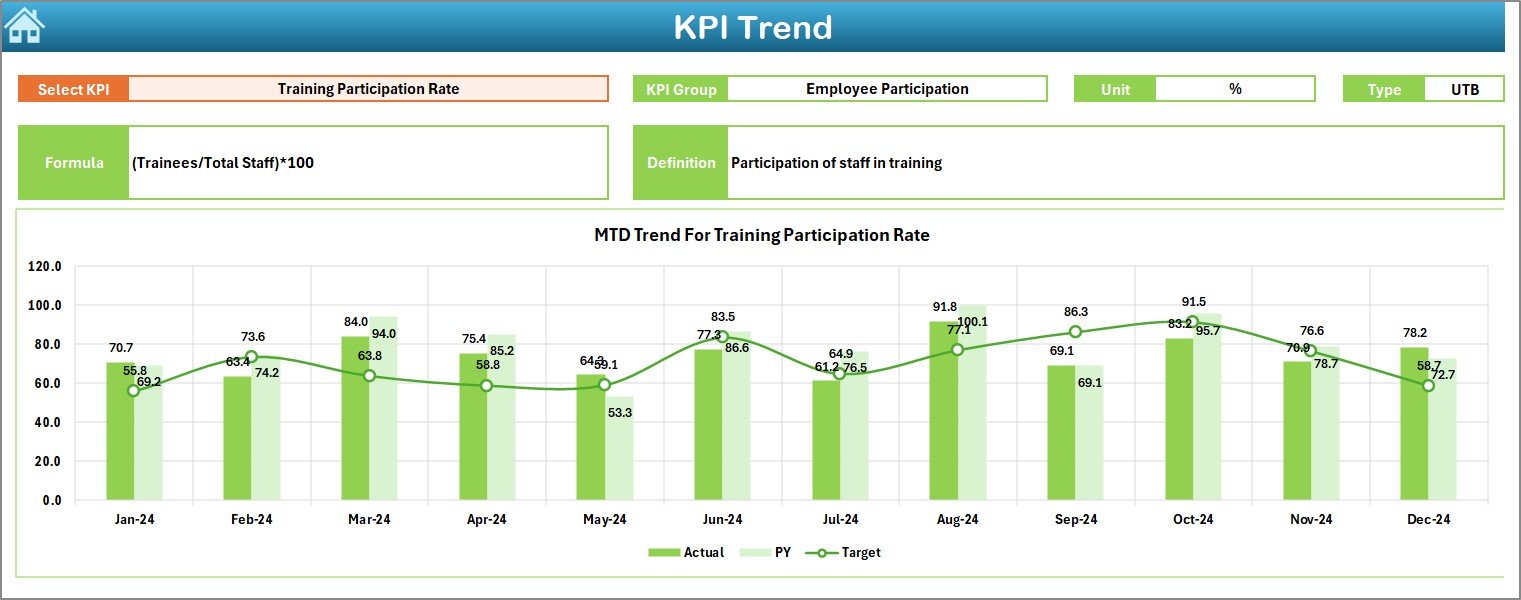
This sheet provides an in-depth trend view for each KPI:
-
Select a KPI from the dropdown in cell C3
-
View KPI details: Group, Unit, Type (LTB or UTB), Formula, and Definition
-
Trend charts display MTD and YTD performance for Actual, Target, and PY values
These visuals help monitor long-term progress and training consistency.
Actual Numbers Input Sheet
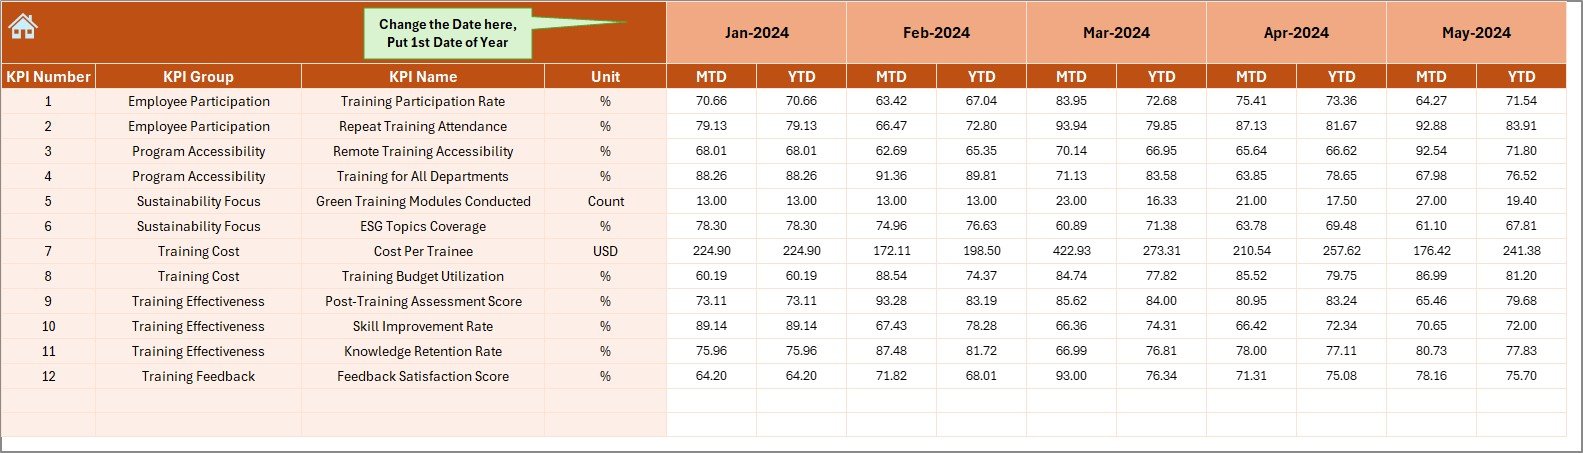
This is the data entry sheet for monthly results.
-
Input MTD and YTD numbers for each KPI
-
Change the first month of the year in cell E1 to adjust the fiscal calendar
It ensures the dashboard stays current with real-world training performance.
Click to Purchases Environmental and Sustainability Training and Development KPI Dashboard in Excel
Target Sheet
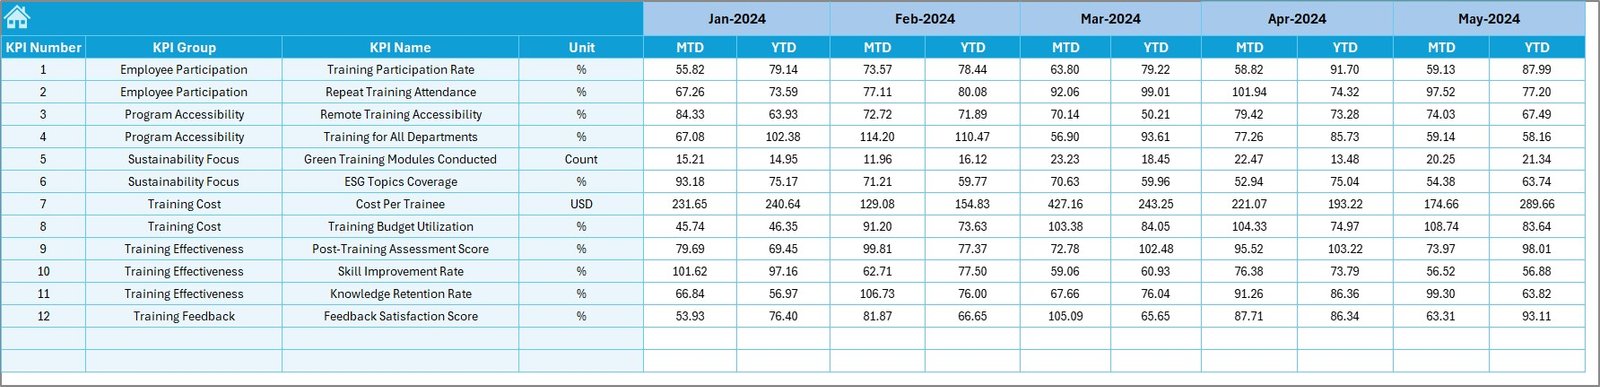
In this section:
-
Set MTD and YTD targets for every KPI
-
Plan sustainable training goals ahead of time
-
Make adjustments as new initiatives launch
Targets are the benchmarks that drive action and improvement.
Previous Year Numbers Sheet
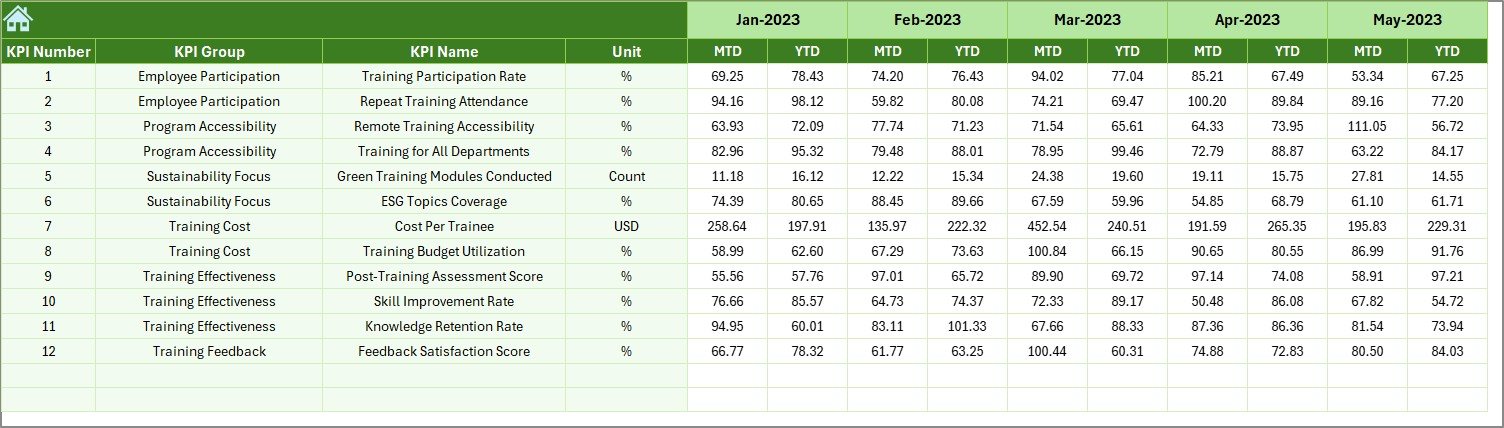
This section captures historical training data for each KPI, allowing year-over-year comparisons. It highlights improvement areas and provides a performance baseline.
KPI Definition Sheet
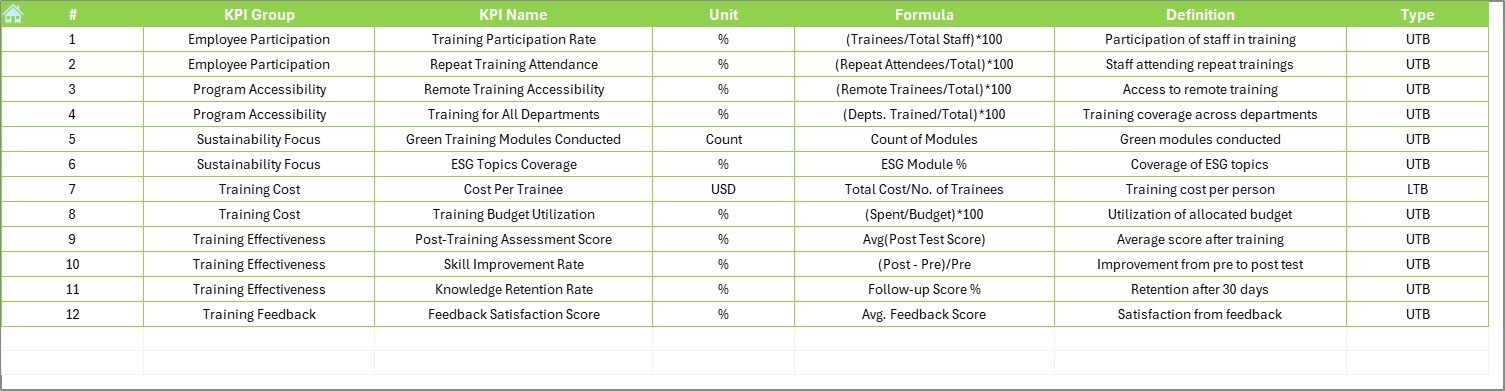
This reference sheet includes all KPI metadata:
-
KPI Name
-
KPI Group
-
Unit of Measurement
-
Formula
-
Definition
Having this structured data ensures clarity and consistency across departments.
Advantages of Using This Dashboard
Implementing this KPI dashboard offers several organizational and environmental benefits:
📈 Data-Driven Decisions: Track KPIs in real time for better decision-making.
🌱 Sustainability Integration: Align employee development with ESG (Environmental, Social, Governance) goals.
📊 Improved Accountability: Assign clear training metrics to departments or individuals.
🔁 Easy Updates: Enter monthly data to see updated dashboards instantly.
🔍 Visibility: Gain insights into which programs are working and where improvements are needed.
💡 Trend Analysis: View historical and current performance at a glance.
What KPIs Can You Track With This Dashboard?
Here are common KPIs included in this dashboard for training and sustainability development:
-
Number of Employees Trained on Sustainability Topics
-
Average Training Hours per Employee
-
Training Completion Rate
-
Post-Training Assessment Score
-
Environmental Compliance Training Coverage
-
Employee Feedback Score on Training Sessions
-
Percentage of Green-Certified Training Programs
-
Number of Training Sessions Conducted
-
Cost per Sustainability Training
-
Trainer Effectiveness Score
-
Annual Growth in Sustainability Awareness
-
Engagement Rate in Voluntary Eco-Programs
Each KPI is tagged as UTB (Upper the Better) or LTB (Lower the Better), helping users interpret performance properly.
Best Practices for the Environmental and Sustainability Training and Development KPI Dashboard
To get the most out of this dashboard, follow these best practices:
✔ Define Clear KPI Ownership
Assign responsibility for each KPI to specific teams or individuals.
✔ Keep Data Updated Monthly
Enter actual data consistently to track progress accurately.
✔ Validate Data Sources
Ensure numbers entered come from reliable systems such as HRMS or LMS.
✔ Use Conditional Formatting to Your Advantage
Quickly spot poor or excellent performance using visual indicators.
✔ Conduct Quarterly Reviews
Analyze trends quarterly to stay on track with yearly training and sustainability goals.
✔ Train Staff to Use the Dashboard
Provide a short orientation to ensure all stakeholders understand the tool and use it effectively.
Why Use Excel for This Dashboard?
Many wonder — why build this in Excel when many BI tools exist?
Here’s why Excel is still a powerful choice:
✅ Universal Accessibility: Nearly every workplace has Excel installed
✅ No Learning Curve: Most professionals already know how to navigate spreadsheets
✅ Cost-Effective: No subscription or software cost
✅ Highly Customizable: Users can tweak charts, layouts, and formulas easily
✅ Offline Use: Unlike cloud tools, you don’t need the internet to access or update
Whether your team is large or small, Excel makes tracking sustainability-focused training simple and scalable.
How Does This Dashboard Improve Training ROI?
By aligning environmental training with KPIs and regularly analyzing performance, this tool:
-
Reduces training waste and ineffective sessions
-
Highlights the ROI of eco-focused programs
-
Encourages team-level accountability
-
Builds a culture of continuous improvement
In short, it connects learning with business value.
Impact on Organizational Sustainability Goals
Every business wants to appear environmentally conscious, but few take action beyond surface-level changes. This dashboard enables real impact, including:
-
Enhanced compliance with environmental regulations
-
Stronger corporate reputation
-
Increased employee awareness and involvement
-
Better alignment with ISO 14001 and ESG frameworks
How to Customize This Excel Dashboard?
You can easily modify the following elements to suit your organization:
✅ Add or remove KPIs in the KPI Definition sheet
✅ Change the dashboard theme or branding
✅ Insert department-wise slicers for analysis
✅ Add tooltips or notes for new users
✅ Link the input sheet to external HR or LMS files
How to Use the Dashboard in 5 Simple Steps?
Click to Purchases Environmental and Sustainability Training and Development KPI Dashboard in Excel
-
Download the Template: Use the prebuilt Excel file.
-
Fill in KPI Definitions: Complete the KPI metadata.
-
Enter Monthly Actuals: Update MTD and YTD data.
-
Set Targets: Define monthly goals.
-
View the Dashboard: Navigate to the Dashboard and KPI Trend tabs to analyze.
Who Should Use This Dashboard?
This tool is perfect for:
-
Environmental Managers
-
Learning & Development Teams
-
HR Professionals
-
Corporate Sustainability Officers
-
ESG Analysts
-
Training Coordinators
Whether you’re reporting to senior management or improving internal processes, this dashboard delivers what you need.
Conclusion
The Environmental and Sustainability Training and Development KPI Dashboard in Excel bridges the gap between sustainability goals and actionable training metrics. With its clean layout, detailed insights, and automation features, organizations can now measure, track, and improve their sustainability training programs like never before.
Frequently Asked Questions (FAQs)
1. What is a KPI Dashboard in Excel?
A KPI dashboard in Excel is a visual tool that tracks and displays key performance indicators using tables, charts, and formulas. It helps users analyze performance in real-time.
2. Why should I measure environmental training KPIs?
Measuring these KPIs ensures your team aligns with sustainability goals, stays compliant with regulations, and identifies areas for improvement.
3. Can I customize the KPIs in the dashboard?
Yes. You can modify the KPI Definition sheet to add new KPIs, update formulas, or change units.
4. Is this dashboard suitable for large organizations?
Absolutely. The dashboard is scalable and can be expanded with slicers, filters, and department-level segmentation.
5. Do I need Excel expertise to use this dashboard?
No. Basic Excel knowledge is enough. The navigation buttons and dropdowns make it user-friendly.
6. How frequently should I update the data?
It’s best to update the Actual, Target, and Previous Year numbers monthly to ensure consistent performance monitoring.
7. What if my fiscal year doesn’t start in January?
No problem. You can change the first month in the Actual Numbers Input sheet (cell E1), and the dashboard will adjust accordingly.
Visit our YouTube channel to learn step-by-step video tutorials