Managing environmental performance has become a priority for organizations worldwide. From tracking carbon emissions to monitoring waste reduction programs, companies now need reliable systems that provide accurate insights. A well-designed Environmental Services KPI Dashboard in Excel offers a practical and affordable solution. It helps organizations measure progress, identify risks, and make informed decisions while avoiding expensive software investments.
This article will walk you through what an Environmental Services KPI Dashboard is, why it matters, its core features, advantages, best practices, and how you can implement one effectively. By the end, you will have a clear understanding of how this dashboard transforms environmental performance into measurable outcomes.
Click to Purchases Environmental Services KPI Dashboard in Excel
What Is an Environmental Services KPI Dashboard in Excel?
An Environmental Services KPI Dashboard is a structured Excel tool designed to track, measure, and analyze key environmental performance indicators (KPIs). It consolidates raw data into a single view, allowing teams to quickly assess both monthly and yearly trends.
Unlike manual reports or scattered spreadsheets, this dashboard provides visual insights through charts, progress bars, and conditional formatting. With just a few clicks, decision-makers can compare current performance against targets and previous years.
Why Do Organizations Need This Dashboard?
Environmental services are no longer optional. Governments, investors, and customers all expect companies to show measurable results in sustainability. Organizations face pressure to reduce emissions, optimize resource usage, and ensure compliance with environmental regulations.
However, without a proper system, managing these initiatives becomes overwhelming. That is where an Excel-based dashboard proves useful. It is affordable, easy to maintain, and powerful enough to highlight progress in real time.
Key needs include:
-
Monitoring energy and water consumption.
-
Tracking waste management and recycling.
-
Evaluating compliance with environmental laws.
-
Measuring carbon footprint reduction.
-
Comparing actual performance with targets.
Key Features of the Environmental Services KPI Dashboard in Excel
The ready-to-use template comes with seven well-structured worksheets that make data entry and analysis simple:
Home Sheet

-
Acts as the index page of the dashboard.
-
Includes six quick navigation buttons.
-
Helps users move between worksheets without scrolling endlessly.
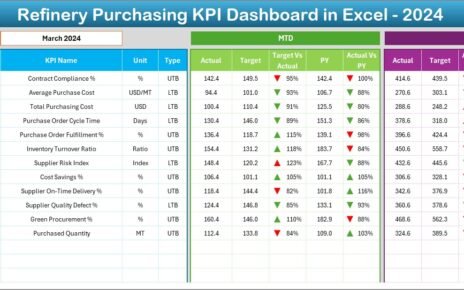
Dashboard Sheet

-
Displays a comprehensive summary of all KPIs.
-
Allows month selection via a drop-down menu in cell D3.
-
Shows both MTD (Month-to-Date) and YTD (Year-to-Date) results.
-
Compares performance with targets and previous year numbers.
-
Uses conditional formatting with up and down arrows for quick visualization.
Click to Purchases Environmental Services KPI Dashboard in Excel
KPI Trend Sheet

-
Provides a deep dive into individual KPIs.
-
Includes a drop-down menu in cell C3 for KPI selection.
-
Displays KPI details: group, unit, type (Lower the Better / Upper the Better), formula, and definition.
-
Offers trend charts for MTD and YTD data to identify patterns.
Actual Numbers Input Sheet

-
Used for entering monthly actual data.
-
Includes an option in cell E1 to set the first month of the year.
-
Accepts both MTD and YTD inputs.
Target Sheet

-
Designed to input target values for each KPI.
-
Supports both monthly and yearly targets.
Previous Year Numbers Sheet

-
Stores last year’s performance metrics.
-
Enables year-over-year (YOY) comparisons.
KPI Definition Sheet

-
Contains the master list of KPIs.
-
Includes KPI name, group, unit, formula, and definition.
-
Provides clear context for every metric in the dashboard.
Advantages of an Environmental Services KPI Dashboard in Excel
Using this dashboard brings several benefits:
✅ Cost-Effective Solution – Avoids expensive BI software by leveraging Excel.
✅ Customizable – Add, remove, or modify KPIs as per business needs.
✅ User-Friendly – Works with simple drop-downs and buttons, requiring no technical expertise.
✅ Real-Time Insights – Provides instant comparison of actuals vs. targets.
✅ Regulatory Compliance – Ensures businesses stay aligned with environmental laws.
✅ Improved Decision-Making – Supports data-driven strategies for sustainability.
✅ Enhanced Transparency – Builds trust among stakeholders by sharing accurate metrics.
Opportunities for Improvement in the Dashboard
Even though Excel dashboards are effective, there are areas for enhancement:
⚡ Automation of Data Entry – Manual inputs can be automated using Power Query or VBA.
⚡ Integration with External Systems – Linking with ERP or IoT systems ensures real-time updates.
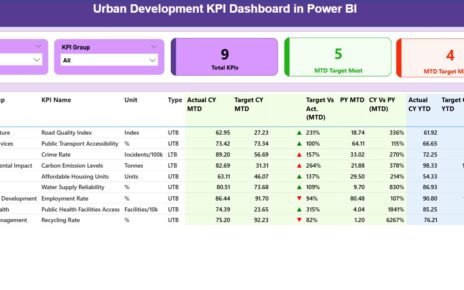
⚡ Advanced Visualizations – Combining Excel with Power BI can deliver more dynamic dashboards.
⚡ Mobile Accessibility – Cloud-based versions (OneDrive/SharePoint) can provide access anywhere.
Best Practices for Using the Environmental Services KPI Dashboard
To get maximum value, follow these best practices:
🔹 Define Clear KPIs – Ensure every KPI has a measurable goal and unit.
🔹 Update Data Regularly – Enter actual numbers consistently to keep the dashboard accurate.
🔹 Set Realistic Targets – Targets must be achievable, motivating teams to perform better.
🔹 Use Conditional Formatting Wisely – Visual indicators should highlight critical trends.
🔹 Train the Team – Provide short training sessions to ensure everyone understands the dashboard.
🔹 Review Trends Frequently – Analyze KPI trends monthly and adjust strategies when needed.
🔹 Back Up Data – Maintain a historical log to track long-term improvements.
How to Implement the Dashboard Effectively
Implementing the dashboard requires a step-by-step approach:
-
Identify Environmental Goals – Decide whether the focus is on emissions, waste, water, or energy.
-
Select Relevant KPIs – Align KPIs with organizational sustainability goals.
-
Prepare Data Sources – Collect data from energy bills, audits, recycling reports, or compliance logs.
-
Enter Data into Input Sheets – Populate the Actual, Target, and Previous Year sheets.
-
Customize the KPI Definition Sheet – Add formulas and units relevant to your industry.
-
Analyze Results in Dashboard Sheet – Use drop-downs to switch between months and KPIs.
-
Review Trends Monthly – Take corrective actions if actual performance is below target.
Practical Applications of the Dashboard
Organizations can use this dashboard in multiple ways:
🌍 Corporate Sustainability Reports – Generate data for annual sustainability disclosures.
🏭 Manufacturing Plants – Track emissions and waste management efficiency.
🏢 Office Buildings – Monitor electricity, water, and paper usage.
🏥 Healthcare Facilities – Ensure medical waste is handled within regulations.
🏫 Educational Institutions – Promote green initiatives like recycling and reduced energy usage.
Case Example: Reducing Carbon Footprint
Imagine a company that wants to reduce its carbon footprint by 15% in one year. By using the Environmental Services KPI Dashboard:
-
The Target Sheet sets monthly and yearly CO₂ reduction goals.
-
The Actual Input Sheet records emissions from power usage and transport.
-
The Dashboard Sheet instantly compares results with the target and previous year.
-
The KPI Trend Sheet shows whether reduction efforts are consistent or seasonal.
This structured approach ensures accountability and measurable outcomes.
Conclusion
The Environmental Services KPI Dashboard in Excel is a powerful yet simple tool that helps organizations measure and improve their sustainability performance. With seven structured worksheets, drop-down filters, and conditional formatting, it transforms raw data into actionable insights.
By adopting this dashboard, companies can reduce environmental risks, achieve regulatory compliance, and demonstrate transparency to stakeholders. Best of all, it provides a cost-effective and flexible solution without requiring advanced technical skills.
Frequently Asked Questions (FAQs)
1. What is an Environmental Services KPI Dashboard in Excel?
It is an Excel-based tool used to track, measure, and analyze environmental performance indicators such as energy usage, waste reduction, and carbon emissions.
2. Why should companies use this dashboard?
It helps organizations reduce environmental risks, comply with regulations, and achieve sustainability targets while avoiding costly software.
3. Can I customize the KPIs in the dashboard?
Yes. The KPI Definition Sheet allows you to add, remove, or modify KPIs according to your organizational goals.
4. How often should I update the dashboard?
It is best to update the dashboard monthly with actual data. However, critical KPIs like emissions or compliance records can be updated weekly.
5. Is Excel powerful enough for environmental tracking?
Yes. For small and mid-sized organizations, Excel provides sufficient flexibility and functionality. For large enterprises, Excel can be integrated with Power BI for advanced analytics.
6. What types of organizations benefit the most?
Manufacturing companies, offices, healthcare facilities, educational institutions, and any organization committed to sustainability can benefit.
7. How does this dashboard compare with Power BI or other tools?
Excel dashboards are simpler and cost-effective, while Power BI offers more advanced analytics. Many organizations start with Excel and later upgrade to Power BI for enterprise-level reporting.
Visit our YouTube channel to learn step-by-step video tutorials