Environmental, Social, and Governance (ESG) compliance has become a top priority for organizations across industries. Regulators, investors, customers, and internal stakeholders now expect transparent, measurable, and consistent ESG reporting. However, many companies still struggle with scattered data, manual reports, and unclear ESG metrics. As a result, ESG tracking often becomes reactive instead of strategic.
That is exactly where an ESG Compliance KPI Dashboard in Excel creates real value.
In this detailed and practical article, you will learn what an ESG Compliance KPI Dashboard in Excel is, why it is important, how it works, its worksheet-wise structure, key KPIs, advantages, best practices, and frequently asked questions. By the end of this guide, you will clearly understand how this ready-to-use Excel dashboard helps organizations monitor ESG performance, ensure compliance, and support data-driven decision-making.
Click to Purchases ESG Compliance KPI Dashboard in Excel
What Is an ESG Compliance KPI Dashboard in Excel?
An ESG Compliance KPI Dashboard in Excel is a structured and visual performance monitoring tool designed to track key environmental, social, and governance metrics in one centralized file.
Instead of reviewing multiple ESG reports, spreadsheets, or documents, this dashboard presents all ESG KPIs in a single, interactive view. Moreover, it uses Excel features such as drop-downs, formulas, conditional formatting, and charts to highlight performance clearly.
As a result, sustainability teams, compliance officers, and leadership teams gain instant clarity on ESG performance across months, quarters, and years.
Why Do Organizations Need an ESG Compliance KPI Dashboard?
ESG reporting involves multiple departments, large data volumes, and strict timelines. However, manual tracking creates delays, errors, and inconsistency. Therefore, organizations need a reliable and standardized ESG monitoring system.
An ESG Compliance KPI Dashboard in Excel helps because:
-
It centralizes ESG data in one file
-
It improves transparency and accountability
-
It enables month-wise and year-to-date ESG tracking
-
It supports internal reviews and external audits
-
It reduces dependency on complex ESG software
Moreover, Excel remains familiar, flexible, and cost-effective for most organizations.
Click to Purchases ESG Compliance KPI Dashboard in Excel
How Does an ESG Compliance KPI Dashboard in Excel Work?
The dashboard works on a simple yet powerful logic.
First, users enter actual ESG data, target values, and previous year numbers in dedicated input sheets. Next, Excel formulas calculate MTD (Month-to-Date) and YTD (Year-to-Date) values automatically. Then, the dashboard compares actual performance against targets and previous year values.
Finally, conditional formatting, arrows, and charts highlight trends, improvements, and gaps clearly.
As a result, users can track ESG compliance status instantly without manual calculations.
What Are the Key Features of an ESG Compliance KPI Dashboard in Excel?
This ESG Compliance KPI Dashboard in Excel is a ready-to-use template with a clean structure and professional design. Below are the key features explained sheet by sheet.
What Is the Purpose of the Home Sheet?
1. Home Sheet (Index Sheet)
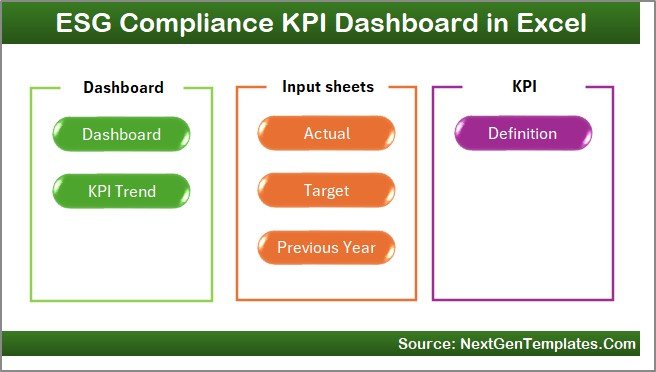
The Home Sheet acts as the navigation center of the dashboard.
Key highlights include:
-
Clean index layout
-
6 navigation buttons
-
One-click access to all major sheets
-
User-friendly design for non-technical users
Because of this structure, users can move across the dashboard quickly without scrolling or searching.
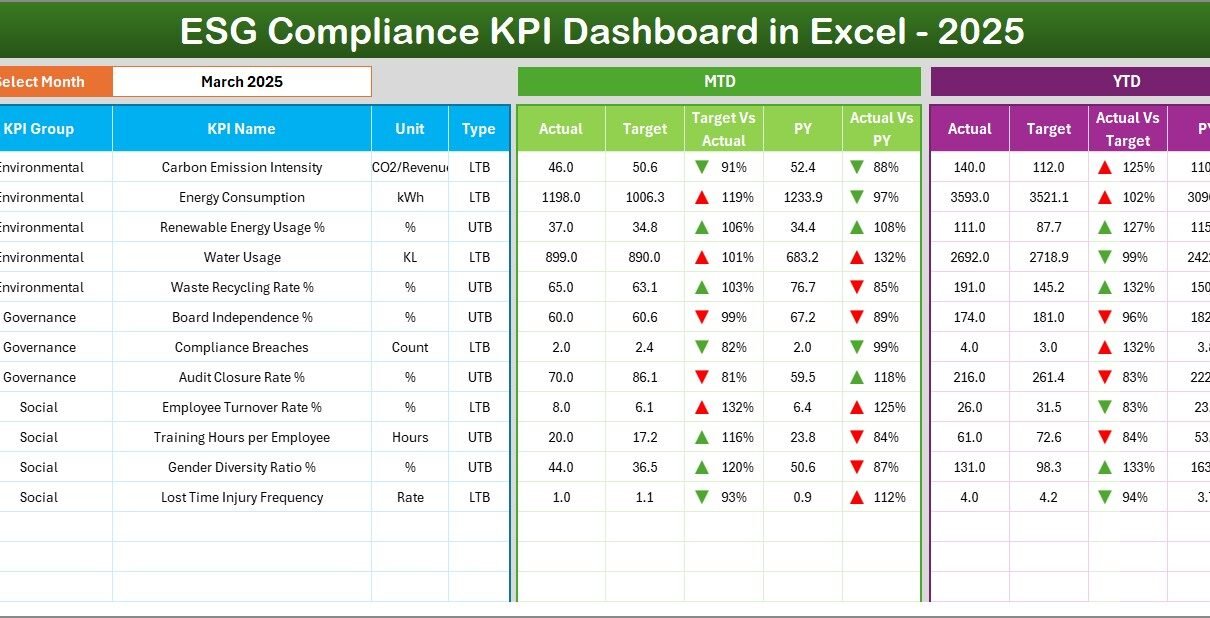
What Does the Dashboard Sheet Show?
2. Dashboard Sheet
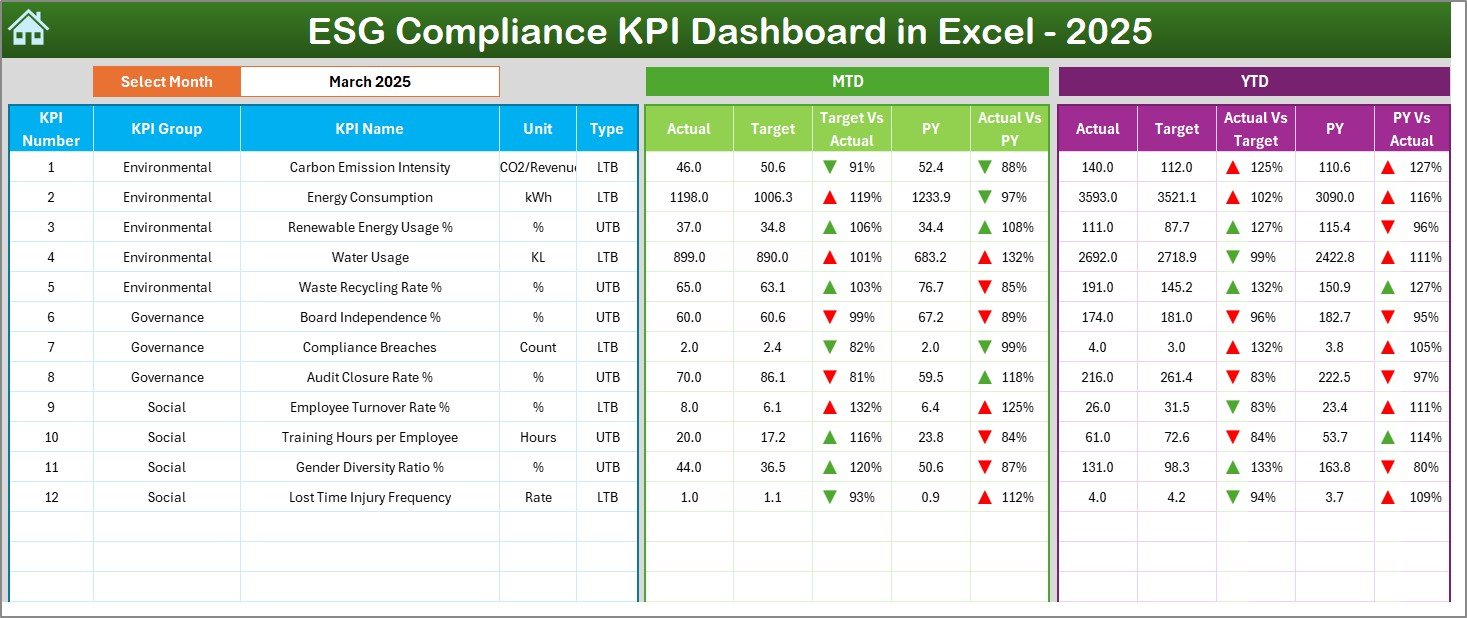
The Dashboard Sheet is the core of the ESG Compliance KPI Dashboard in Excel.
Here is what it displays:
-
Month selection using a drop-down (Cell D3)
-
MTD Actual, Target, and Previous Year values
-
YTD Actual, Target, and Previous Year values
-
Target vs Actual comparison
-
Previous Year vs Actual comparison
-
Conditional formatting with up/down arrows
When you change the month from the drop-down, the entire dashboard updates automatically. As a result, users can analyze ESG performance for any month instantly.
Click to Purchases ESG Compliance KPI Dashboard in Excel
How Does the KPI Trend Sheet Help in Analysis?
3. KPI Trend Sheet
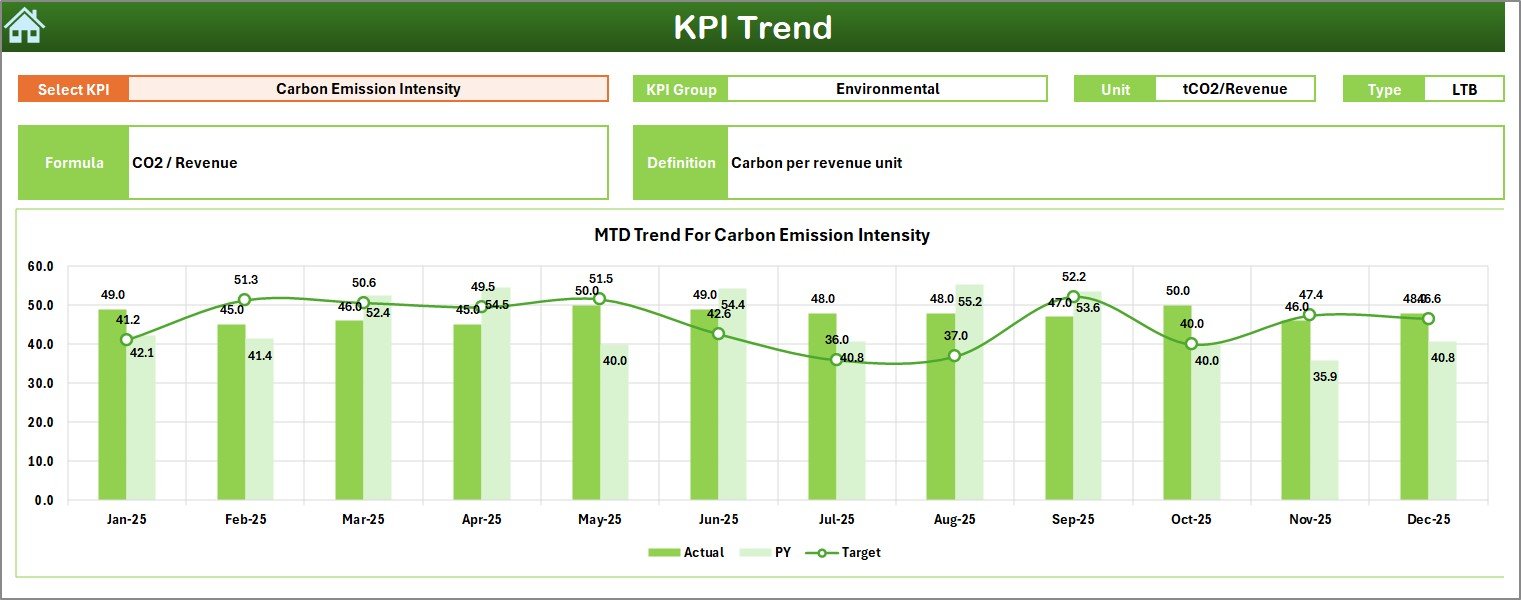
The KPI Trend Sheet focuses on deep KPI-level analysis.
Key features include:
-
KPI selection drop-down (Cell C3)
-
Display of KPI Group
-
KPI Unit of measurement
-
KPI Type (Lower the Better or Upper the Better)
-
KPI Formula
-
KPI Definition
In addition, this sheet shows:
-
MTD trend chart (Actual, Target, PY)
-
YTD trend chart (Actual, Target, PY)
Because of this setup, users can easily track ESG KPI performance trends over time.
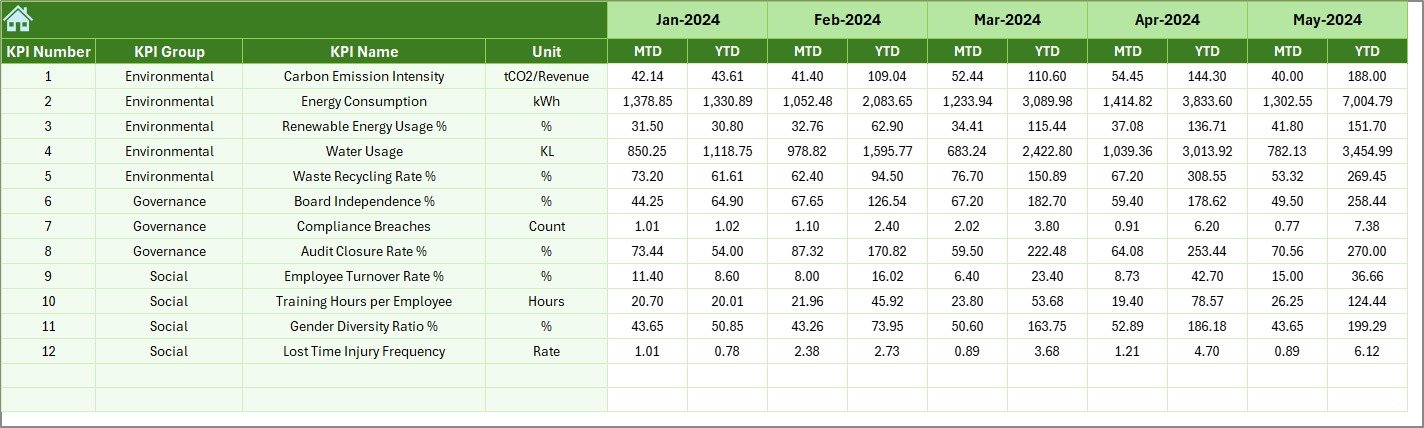
How Do You Enter ESG Actual Data?
4. Actual Numbers Input Sheet
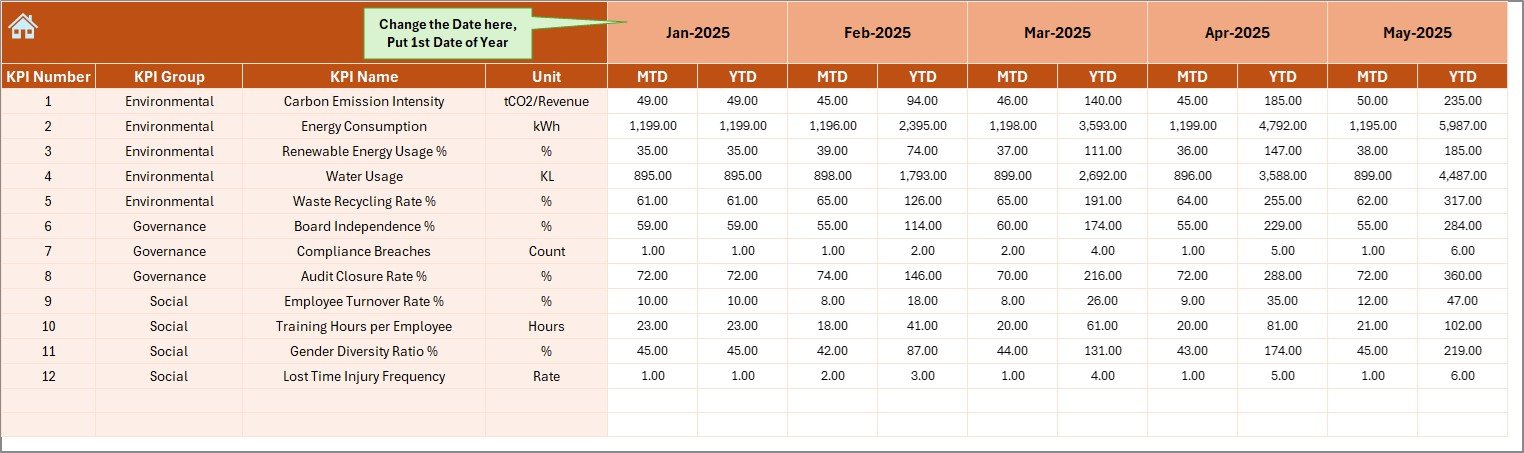
The Actual Numbers Input Sheet allows users to enter real ESG performance data.
Key details include:
-
Month selection in Cell E1
-
Input fields for MTD and YTD actual values
-
Structured and controlled data entry layout
You simply change the first month of the year in Cell E1 and enter ESG data month by month. Consequently, the dashboard updates automatically.
What Is the Role of the Target Sheet?
5. Target Sheet
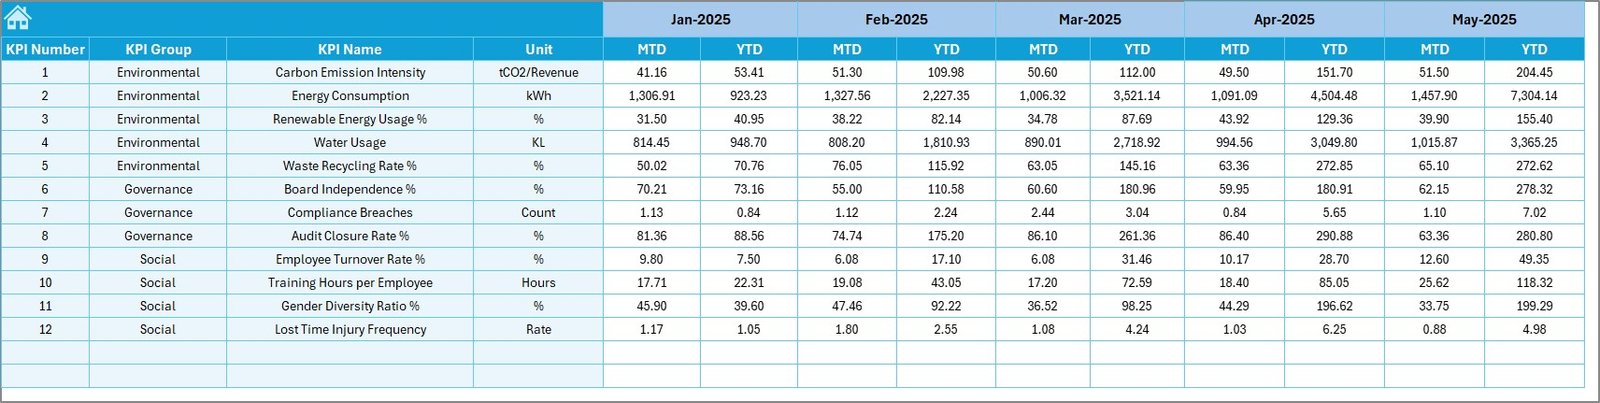
The Target Sheet stores planned ESG targets.
In this sheet, users enter:
-
Monthly MTD targets
-
Year-to-date YTD targets
-
Targets for each ESG KPI
This separation ensures clarity between actual performance and planned ESG goals.
Why Is the Previous Year Sheet Important?
6. Previous Year Number Sheet
The Previous Year Number Sheet stores historical ESG data.
Key benefits include:
-
Year-over-year ESG comparison
-
Trend analysis and benchmarking
-
Performance improvement tracking
By comparing current ESG results with previous year values, organizations can evaluate progress effectively.
What Information Is Stored in the KPI Definition Sheet?
7. KPI Definition Sheet
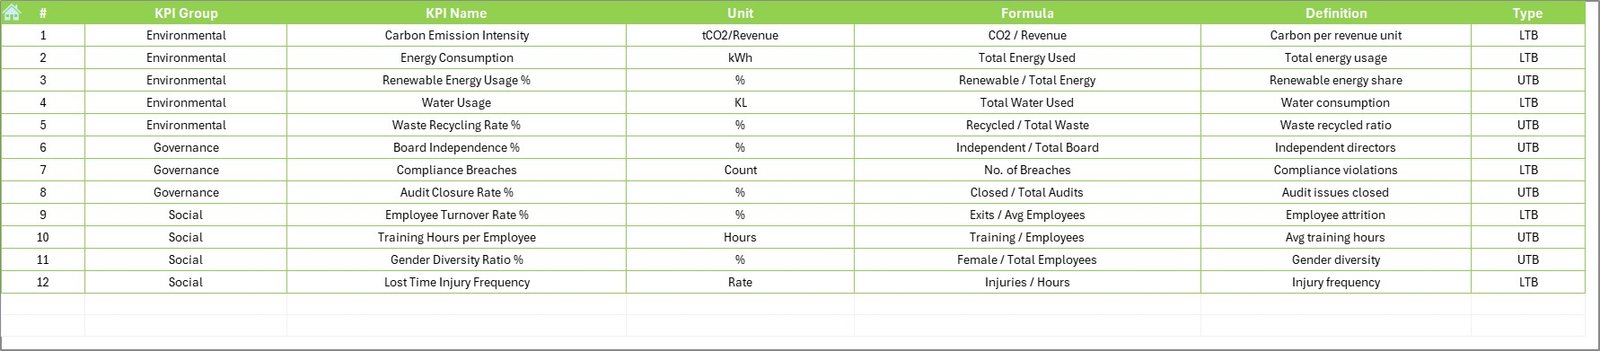
The KPI Definition Sheet acts as a reference guide.
It includes:
-
KPI Name
-
KPI Group (Environmental, Social, Governance)
-
KPI Unit
-
KPI Formula
-
KPI Definition
Because of this sheet, users maintain consistency and clarity across ESG reporting.
What Are Common ESG KPIs Tracked in This Dashboard?
An ESG Compliance KPI Dashboard in Excel can track a wide range of ESG metrics. Common examples include:
Environmental KPIs
-
Carbon emissions (CO₂)
-
Energy consumption
-
Water usage
-
Waste recycling rate
-
Renewable energy percentage
Social KPIs
-
Employee diversity ratio
-
Training hours per employee
-
Workplace incident rate
-
Employee turnover rate
-
Community investment value
Governance KPIs
-
Board diversity percentage
-
Compliance audit score
-
Policy adherence rate
-
Risk incidents count
-
Ethics training completion rate
Because the dashboard is flexible, organizations can customize KPIs easily.
Click to Purchases ESG Compliance KPI Dashboard in Excel
Advantages of ESG Compliance KPI Dashboard in Excel
Using an ESG Compliance KPI Dashboard in Excel offers multiple advantages.
1. Centralized ESG Monitoring
The dashboard brings all ESG data into one file. As a result, teams avoid data silos and confusion.
2. Real-Time Performance Tracking
With automatic calculations, users see ESG performance updates instantly after data entry.
3. Improved Transparency
Clear visuals, arrows, and trend charts improve ESG reporting transparency.
4. Easy Customization
Excel allows users to add, remove, or modify KPIs without technical expertise.
5. Cost-Effective Solution
Unlike expensive ESG software, Excel dashboards reduce implementation and training costs.
6. Audit and Compliance Ready
Structured data and historical tracking support audits and regulatory reviews.
Click to Purchases ESG Compliance KPI Dashboard in Excel
Best Practices for the ESG Compliance KPI Dashboard in Excel
To get maximum value from your ESG Compliance KPI Dashboard in Excel, follow these best practices.
1. Define ESG KPIs Clearly
Always define KPIs clearly in the KPI Definition Sheet. This practice avoids confusion and misinterpretation.
2. Maintain Data Accuracy
Ensure that actual ESG data comes from reliable and verified sources.
3. Update Data Regularly
Update MTD and YTD values monthly to maintain data relevance.
4. Set Realistic Targets
Align ESG targets with regulatory requirements and organizational capacity.
5. Use Trend Analysis
Focus on KPI trend charts instead of only monthly numbers to identify long-term patterns.
6. Review Dashboard Periodically
Conduct monthly or quarterly ESG performance reviews using the dashboard.
How Does This Dashboard Support ESG Decision-Making?
This ESG Compliance KPI Dashboard in Excel supports decision-making by:
-
Highlighting compliance gaps early
-
Showing ESG progress visually
-
Supporting data-driven sustainability strategies
-
Improving communication with stakeholders
Because of this, leadership teams can take corrective actions quickly.
Who Should Use an ESG Compliance KPI Dashboard in Excel?
This dashboard is ideal for:
-
ESG and sustainability teams
-
Compliance officers
-
Risk and audit teams
-
Corporate governance teams
-
SMEs starting ESG reporting
Moreover, organizations at early ESG maturity stages benefit significantly from Excel-based dashboards.
Can This Dashboard Be Customized for Different Industries?
Yes, absolutely.
You can customize ESG KPIs for:
-
Manufacturing companies
-
Financial institutions
-
IT and technology firms
-
Healthcare organizations
-
Real estate and infrastructure companies
Because Excel is flexible, customization remains simple and fast.
Conclusion: Why an ESG Compliance KPI Dashboard in Excel Is Essential
An ESG Compliance KPI Dashboard in Excel transforms ESG reporting from a manual, reactive process into a structured, data-driven system. It centralizes ESG data, improves transparency, and supports better decision-making.
Moreover, its ready-to-use structure, interactive features, and familiar Excel environment make it accessible for organizations of all sizes. By implementing this dashboard, companies can strengthen ESG compliance, improve stakeholder confidence, and build a sustainable future.
Click to Purchases ESG Compliance KPI Dashboard in Excel
Frequently Asked Questions About ESG Compliance KPI Dashboard in Excel
What is an ESG Compliance KPI Dashboard in Excel?
An ESG Compliance KPI Dashboard in Excel is a visual tool that tracks environmental, social, and governance KPIs using Excel formulas, charts, and comparisons.
Can beginners use this ESG dashboard?
Yes, the dashboard is user-friendly and suitable for beginners with basic Excel knowledge.
Does the dashboard support monthly and yearly tracking?
Yes, it supports both MTD and YTD tracking along with previous year comparisons.
Can we add more ESG KPIs to the dashboard?
Yes, you can easily add or modify KPIs in the KPI Definition Sheet and input sheets.
Is this dashboard suitable for ESG audits?
Yes, the structured data, trends, and historical comparisons make it audit-ready.
Do we need advanced Excel skills to use it?
No, basic Excel skills are sufficient to operate and maintain this dashboard.
Click to Purchases ESG Compliance KPI Dashboard in Excel
Visit our YouTube channel to learn step-by-step video tutorials