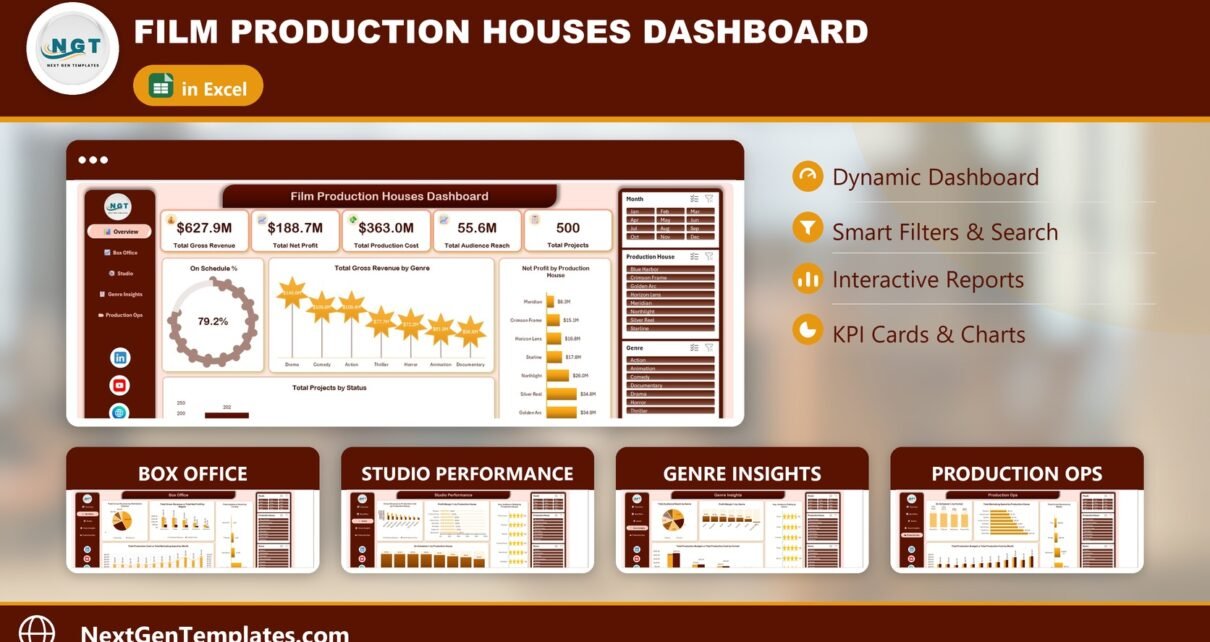
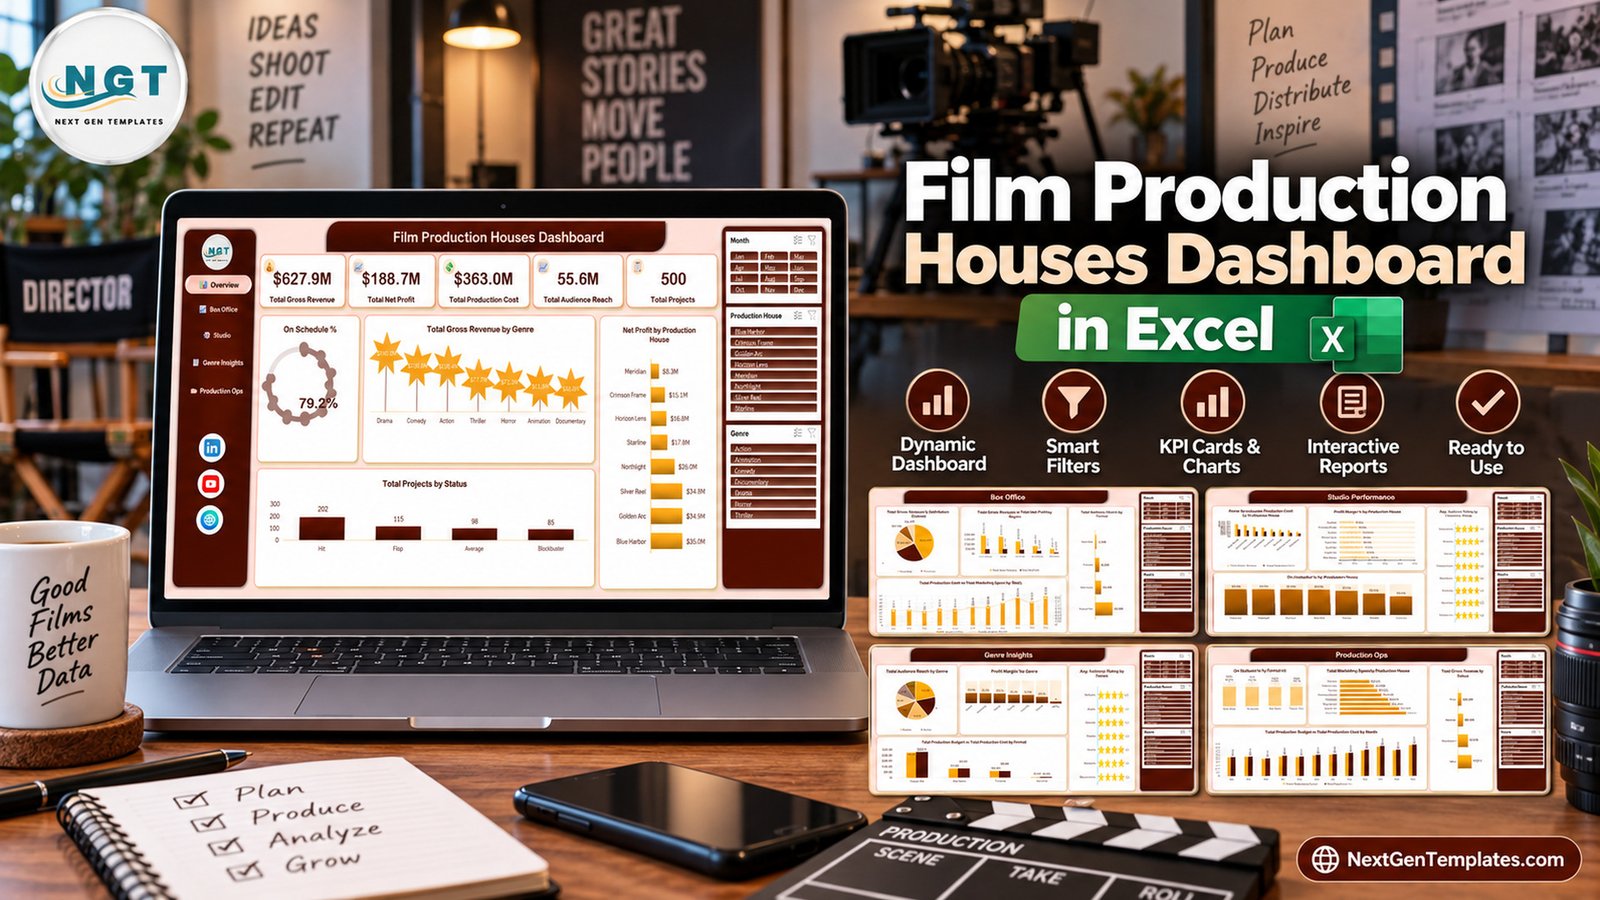
The Film Production Houses Dashboard in Excel analyses 500 film and series projects across 5 interactive pages, 5 KPI cards and 20 charts. In its sample data it reports $627.9M in gross revenue, $188.7M in net profit and $363.0M in production cost, with 79.2% of projects (396 of 500) finishing their shoot on or before the planned number of days.
Production houses rarely lack data. Release dates, budgets, box office takings, streaming revenue, ratings and shoot days all exist somewhere, usually spread across several spreadsheets. What is missing is one place where a producer can see which studio, genre or format is actually making money and staying on schedule. This workbook brings those numbers into a single Excel file that filters by month, production house and genre in one click.
Key Features of the Film Production Houses Dashboard
- Five connected pages: Overview, Box Office, Studio Performance, Genre Insights and Production Ops, reachable from a left-hand navigation menu.
- Workbook-wide slicers: Month, Production House and Genre slicers appear on every page. They share three slicer caches linked to all 25 PivotTables, so a filter chosen on one page applies to every page.
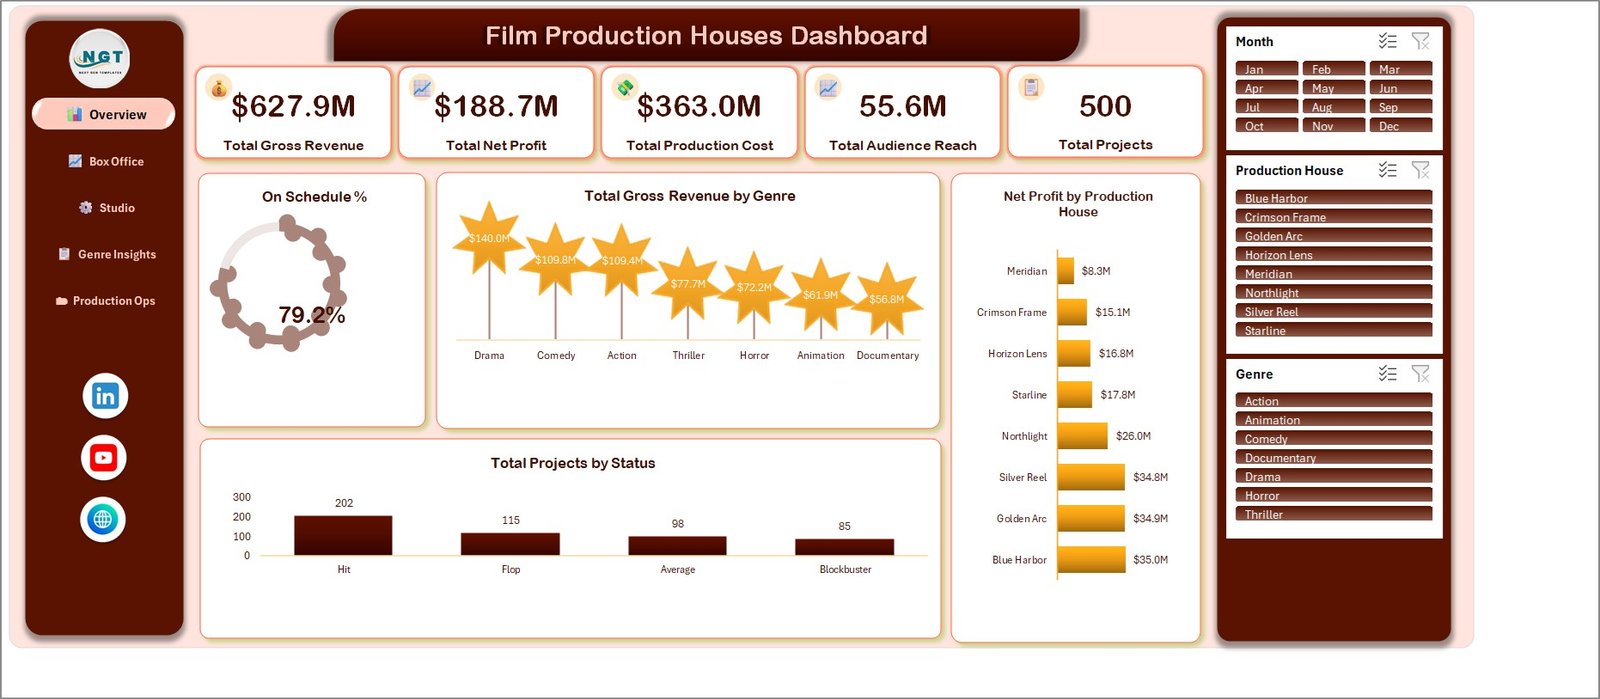
- Five KPI cards: Total Gross Revenue, Total Net Profit, Total Production Cost, Total Audience Reach and Total Projects, plus an On Schedule % ring.
- Transparent schedule rule: a project is on schedule when Actual Shoot Days are less than or equal to Planned Shoot Days.
- Structured data table: an Excel table named TblData with 20 project fields and 8 helper columns (Month, Year, a record counter and flags for on-schedule and each of the four statuses).
- Sample slate included: 500 projects released in 2025 across 8 production houses, 7 genres, 4 formats, 5 distribution channels and 5 regions.
Dashboard Pages Explanation of the Film Production Houses Dashboard in Excel
Each page keeps the same layout: a navigation menu on the left, charts in the centre and the three slicers on the right. Here is what every page shows.
Page 1: Overview
The Overview shows the five KPI cards and the On Schedule % ring (79.2%). Total Gross Revenue by Genre shows Drama leading at $140.0M and Documentary lowest at $56.8M. Net Profit by Production House ranges from Blue Harbor at $35.0M down to Meridian at $8.3M, and Total Projects by Status counts 202 Hit, 115 Flop, 98 Average and 85 Blockbuster projects.
Page 2: Box Office
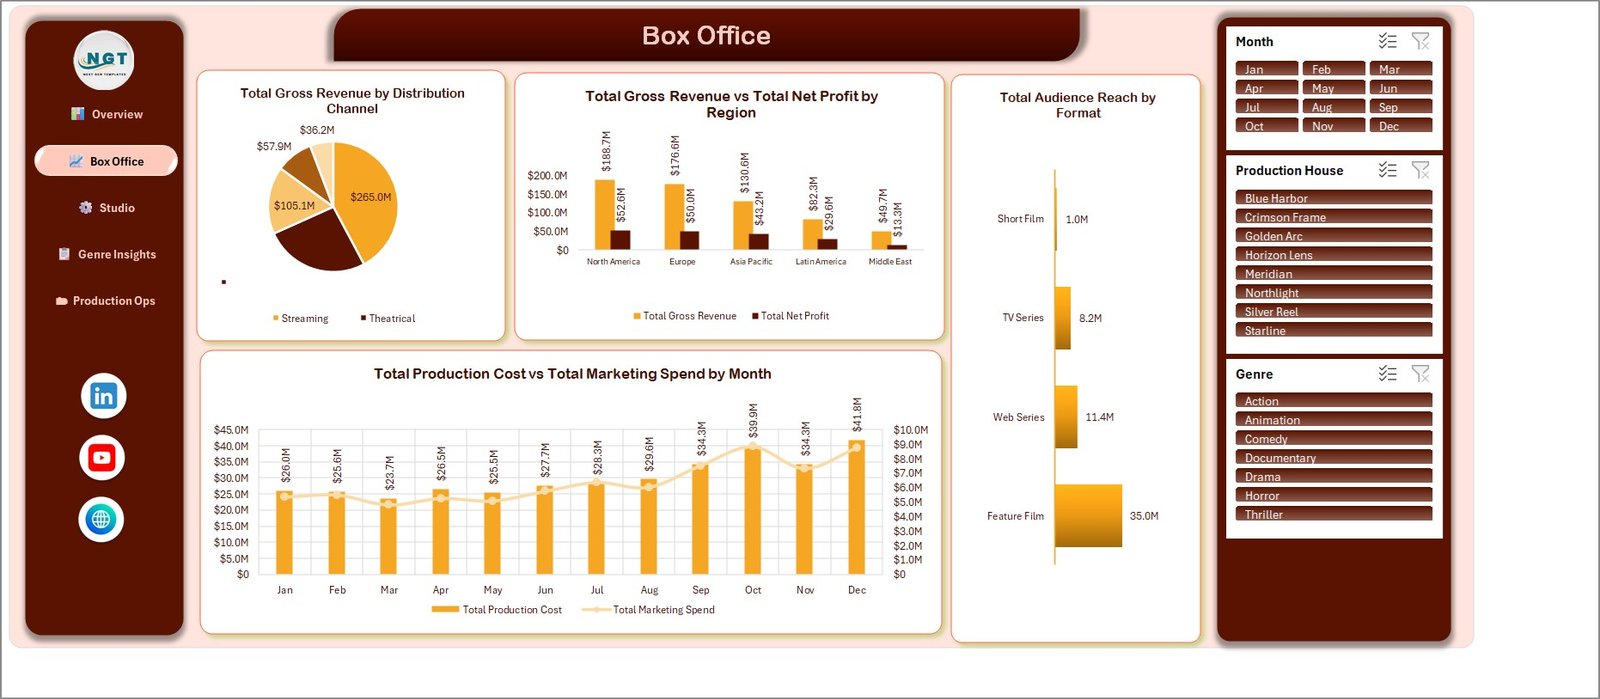
Box Office explains where revenue comes from. Total Gross Revenue by Distribution Channel shows streaming as the largest source at $265.0M. Total Gross Revenue vs Total Net Profit by Region puts North America first with $188.7M revenue and $52.6M profit. Total Audience Reach by Format shows Feature Films reaching 35.0M viewers, and Total Production Cost vs Total Marketing Spend by Month tracks both costs through the year.
Page 3: Studio Performance
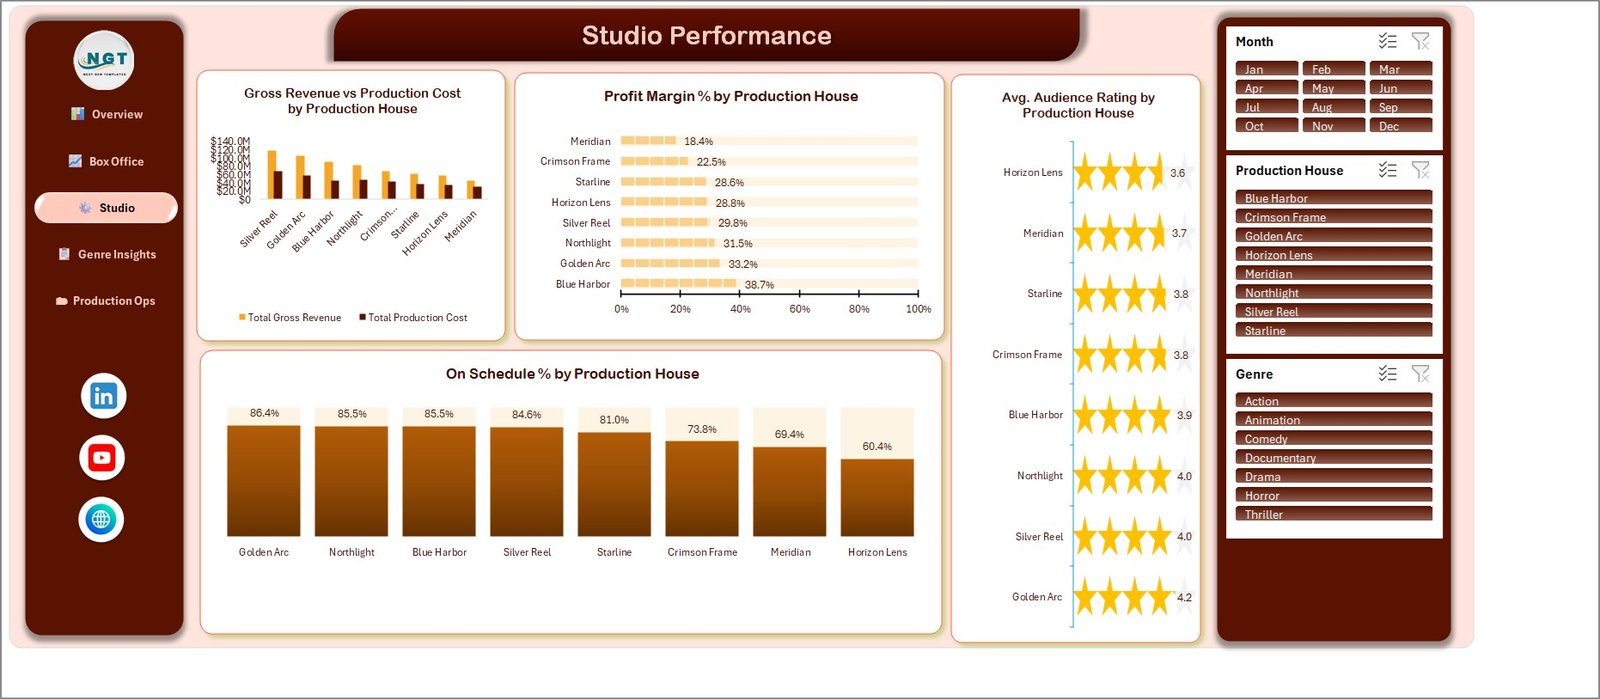
Studio Performance compares the eight production houses. Gross Revenue vs Production Cost by Production House shows the spread between takings and spend, and Profit Margin % by Production House runs from Blue Harbor at 38.7% to Meridian at 18.4%. Avg. Audience Rating by Production House puts Golden Arc on top at 4.2, and On Schedule % by Production House ranges from Golden Arc at 86.4% to Horizon Lens at 60.4%.
Page 4: Genre Insights
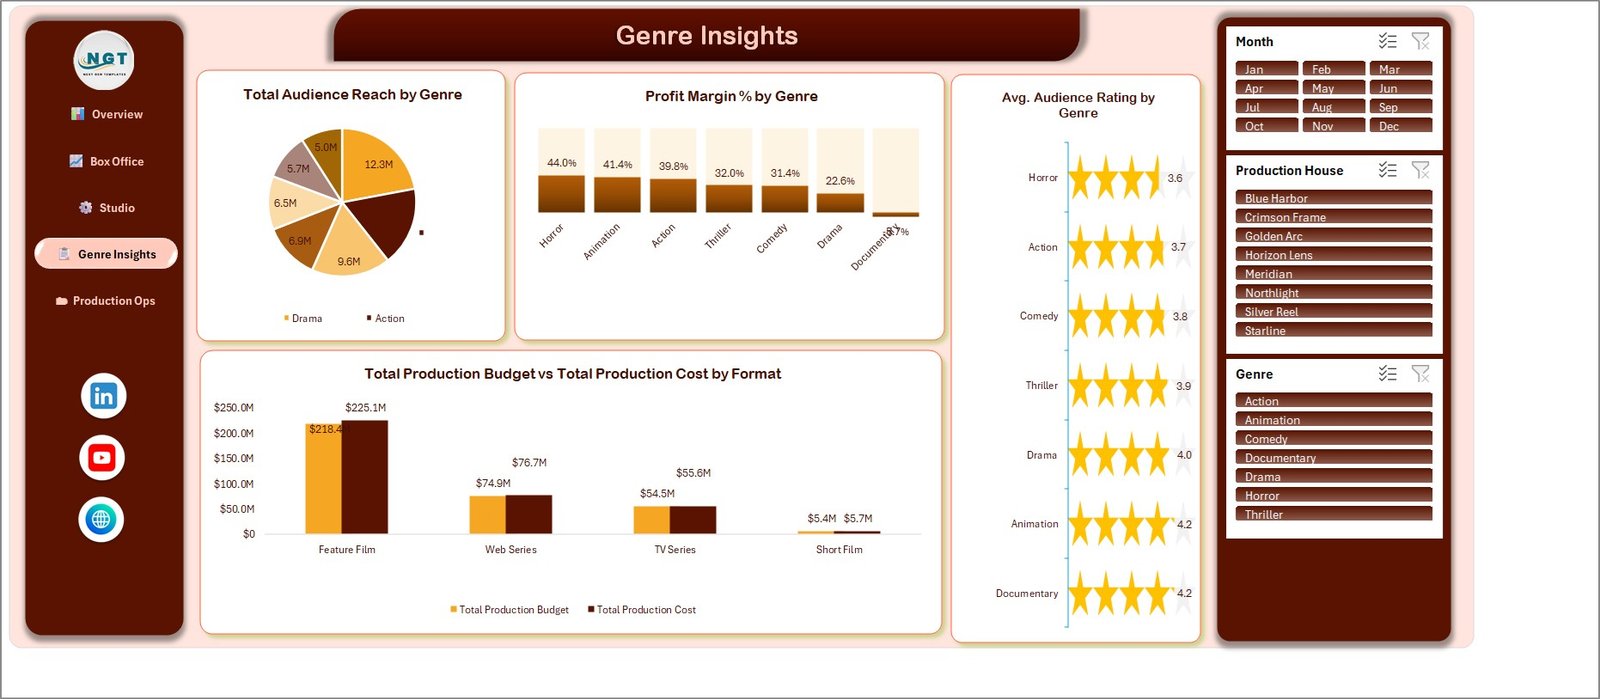
Genre Insights shows Total Audience Reach by Genre and Profit Margin % by Genre, where Horror (44.0%) and Animation (41.4%) earn the widest margins while Drama sits at 22.6%. Avg. Audience Rating by Genre shows Animation and Documentary at 4.2, and Total Production Budget vs Total Production Cost by Format reveals that Feature Films cost $225.1M against a $218.4M budget.
Page 5: Production Ops
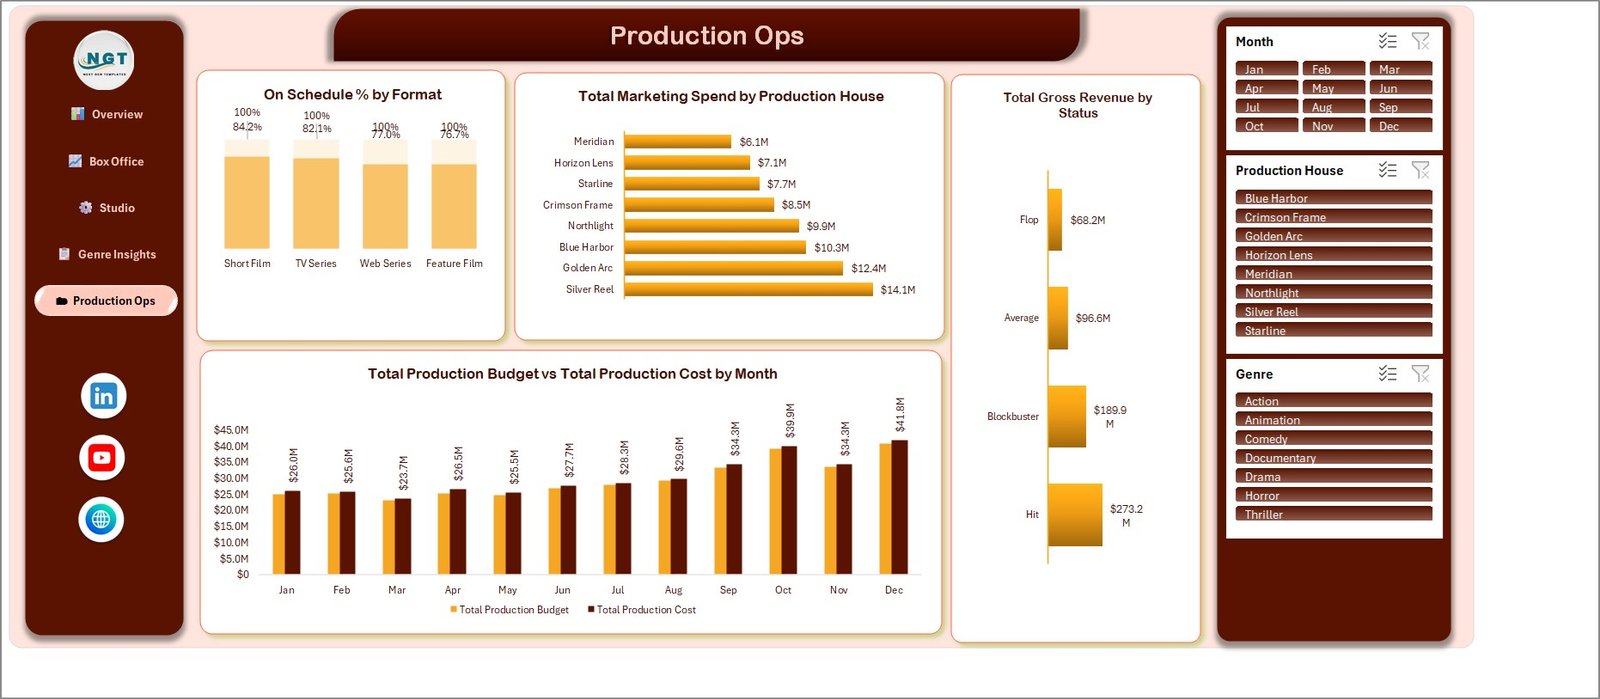
Production Ops focuses on delivery and spend. On Schedule % by Format shows Short Films at 84.2%, TV Series at 82.1%, Web Series at 77.0% and Feature Films at 76.7%. Total Marketing Spend by Production House shows Silver Reel spending the most at $14.1M, Total Gross Revenue by Status shows Hit projects bringing in $273.2M and Blockbusters $189.9M, and Total Production Budget vs Total Production Cost by Month shows the monthly overrun pattern.
Data Sheet
The Data sheet holds the TblData table from row 4. Its input columns are Project ID, Release Date, Project Title, Production House, Genre, Format, Distribution Channel, Region, Production Budget, Production Cost, Marketing Spend, Gross Revenue, Net Profit, Audience Reach, Audience Rating, Critic Score, Planned Shoot Days, Actual Shoot Days, Crew Size and Status. Month and Year are calculated from the release date.
Support Sheet
The Support sheet contains the 25 PivotTables that power the charts, grouped by page. It is a calculation sheet; a Refresh All keeps it in step with the data.
Film Production Houses Dashboard vs. Google Sheets Equivalent vs. Paid Production Analytics Software
| Feature | This Excel Dashboard | Google Sheets equivalent | Paid production analytics SaaS |
|---|---|---|---|
| Cost | ✅ $17.99 one-time (regular $29.99) | Free tool, but you build every chart yourself | Monthly or annual subscription |
| Platform | Desktop Microsoft Excel | Browser | Browser, vendor-hosted |
| Setup time | ✅ Under 10 minutes | Hours to days of building | Onboarding and data import |
| Real-time team collaboration | File sharing or OneDrive co-authoring | ✅ Built in | ✅ Built in |
| Mobile access | View on Excel mobile; slicers best on desktop | ✅ Browser and app | ✅ Usually |
| Customizable fields | ✅ Full control | ✅ Full control | Limited to the vendor’s schema |
| Share with link | Through OneDrive or SharePoint | ✅ Yes | ✅ Yes |
| Year-1 cost at 5 users | ✅ One purchase, no per-user fee | Free plus build time | Per-seat pricing multiplies |
| Studio, genre and box office pages ready | ✅ 5 pages, 20 charts | Not included | Varies by product |
For production houses that want slate-level revenue, profit and schedule reporting without a subscription, this workbook sits in the sweet spot.
Who Should Use This Template
Perfect for:
- Independent production houses and studio groups reporting on a mixed slate of feature films, web series, TV series and short films
- Producers and finance leads who review revenue, net profit, cost and marketing spend each month
- Line producers tracking on-schedule delivery by studio and format
- Media analysts, film school students and Excel learners who want a real PivotTable and slicer example
Not a fit if:
- You need production management features such as scheduling, call sheets or line-item budgets
- You need film accounting, royalty statements or live feeds from box office and streaming platforms
- Your team works only in Excel for the web or Google Sheets
Real-World Use Cases
Anita runs finance for a production house with three labels. Every quarter she pastes the new releases into the Data sheet and refreshes. Studio Performance shows her board which label delivers the best profit margin, and On Schedule % by Production House shows which label keeps overrunning its shoot days.
Marco is a line producer at a streaming-first studio. He filters Production Ops to compare on-schedule rates for web series and feature films, then reads Production Budget vs Production Cost by Month to find the months when overruns began, ahead of the next budget review.
Leila is a media analyst writing a genre strategy memo. On Genre Insights she compares profit margin and audience rating by genre, and on Box Office she measures how much revenue comes from streaming compared with theatrical and festival releases.
Advantages of the Film Production Houses Dashboard
- One file, one refresh: all 25 PivotTables and 20 charts update together with Ctrl+Alt+F5.
- Consistent filtering: the shared slicers mean every page always shows the same month, studio and genre selection.
- No subscription: a single payment replaces per-seat analytics tools.
- Private by default: the data stays in your own workbook.
- Easy to extend: everything is standard Excel, so you can add PivotTables, charts or slicers without special add-ins.
Opportunities for Improvement
- Manual refresh: the PivotTables are not set to refresh when the file opens, so refresh after every data change.
- Month-name slicer: months are stored as names, so several years of data merge into the same twelve months. A Year slicer is a quick addition, since the Year column already exists.
- Unused fields: Critic Score and Crew Size are collected in the data but not yet charted, which leaves room for a crew productivity or critical reception view.
- Legends on the pie charts: the two pie charts show only the first two legend entries, so hover over a slice for its name.
- Desktop only: Excel for the web can display the file, but slicers and refresh work best in desktop Excel.
Best Practices
- Keep one row per project and fill every numeric column; blanks distort averages such as audience rating.
- Store Net Profit as Gross Revenue minus total spend using the same rule for every project so margins stay comparable.
- Use the same spelling for production houses, genres and formats, or the slicers will show duplicates.
- Refresh All after pasting new data and before sharing the file.
- Save a copy of the sample workbook before replacing the data, so you can always compare against the original.
If you are new to the features behind this workbook, Microsoft’s guides on how to create a PivotTable to analyze worksheet data and use slicers to filter data are a good starting point.
Explore Relevant Templates
If you track a film or media business, these guides on our blog go further:
- Film Production Houses KPI Dashboard in Excel – a month-picker KPI scorecard with targets and status lights for the same industry.
- Film Production KPI Scorecard in Excel – a compact scorecard for production KPIs.
- Documentary Channels Dashboard in Excel – viewership and revenue analysis for documentary broadcasters.
- Film & Television Report in Excel – a printable report layout for film and TV figures.
- Independent Filmmaking Dashboard in Power BI – film analytics for Power BI users.
On NextGenTemplates you can also find the Content Rights Agencies Dashboard in Excel and the Film and Television Dashboard in Google Sheets.
Frequently Asked Questions
What does this film production dashboard track?
It tracks gross revenue, net profit, production cost and budget, marketing spend, audience reach, audience rating, profit margin, on-schedule rate and project counts by status. Every measure can be viewed by production house, genre, format, distribution channel, region and month across five pages.
Which version of Excel do I need?
Desktop Microsoft Excel, either Microsoft 365 or Excel 2016 and later. The dashboard relies on PivotTables, PivotCharts and slicers. Excel for the web and mobile can open the file, but refreshing data and using the slicers work best on desktop.
How long does setup take?
Usually under 10 minutes. Paste your projects into the TblData table on the Data sheet, keep the helper formulas filled down to your last row and press Ctrl+Alt+F5. Every page then shows your own figures.
Is it the same as the Film Production Houses KPI Dashboard?
No. The KPI edition is a month-picker scorecard with targets and traffic lights. This analytical dashboard works from 500 project-level records with slicers and 20 charts, so it answers different questions. Many studios use both side by side.
How does it compare with paid production analytics software?
Paid platforms add live integrations, multi-user access and workflow tools, usually billed per seat. This workbook is a one-time purchase, keeps data on your computer and is fully editable, but you update the data yourself and it has no scheduling or accounting features.
Can I track more than one year?
Yes, with a small change. The sample covers 2025 and the Month slicer uses month names, so multiple years would merge. Insert a Year slicer from the existing Year column, or keep one workbook per year.
About the Author
Built by PK, Microsoft Certified Professional with 15+ years of Excel, Google Sheets and Power BI experience. Founder of NextGenTemplates, reaching 300K+ subscribers across YouTube channels. Every template is hand-built and tested before release.
Conclusion
A production slate is easier to steer when revenue, profit, cost and schedule sit on the same page. This workbook gives producers, finance leads and analysts five focused views of their projects, with slicers that keep every page in sync and a data table that takes minutes to replace with real numbers.
👉 Click here to Purchase the Film Production Houses Dashboard in Excel
✅ Instant download · One-time payment · No subscription
🎥 Watch step-by-step Excel tutorials at Youtube.com/@PKAnExcelExpert
Last updated: September 2026