The Product Feedback Tracker in Excel captures structured customer and user feedback across 8 purpose-built worksheets — Login Form, Home Page, Dashboard, Data Sheet, List Sheet, Support Sheet, Settings Sheet, and User Management Sheet — driven by a VBA UserForm with Add, Update, and Delete buttons. The Dashboard ships with 4 slicers and 5 auto-refreshing charts, so a product manager can move from raw feedback into a board-ready visual in under 10 minutes.
If you are running a product team at a 10–500 person company, getting honest, slice-able feedback across feature requests, bug reports, NPS responses, and sales-call notes is the difference between a roadmap that ships what users actually want and one that burns sprint after sprint on the wrong work. This post walks through every sheet inside the Product Feedback Tracker in Excel, shows how the VBA workflow stops manual data-entry errors, and explains where this template wins versus paid feedback SaaS like Pendo, Productboard, or UserVoice.
Product Feedback Tracker in Excel — Login Form
Key Features of the Product Feedback Tracker in Excel
The tracker is built around three repeating ideas: a single source of truth for feedback (the Data Sheet), a VBA-driven entry layer that prevents bad data, and a slicer-first dashboard for instant analysis. Concretely:
- 8 integrated worksheets — every sheet is connected through VBA so a new feedback record on the Data Sheet flows directly into the Dashboard charts and slicers without any manual refresh.
- VBA-driven Data Entry form with Add, Update, and Delete buttons. The same UserForm handles all three actions, so end users never edit cells directly.
- Login-protected access backed by a User Management sheet that stores usernames, passwords, and roles. The same sheet drives the Login Form’s validation logic.
- Interactive Dashboard with 4 slicers (Product, Feedback Category, Severity, Sentiment) and 5 charts (response volume, average score, sentiment distribution, category mix, product comparison).
- Dropdown-driven entry from the List Sheet — every combo box on the form pulls its values from a named range, so adding a new product or category is a single-row change.
- Hidden Support Sheet with the pivot tables that drive the dashboard charts. End users never need to touch it.
- Settings Sheet for organisation logo, product portfolio names, and release version numbers.
- Works in Excel 2016, 2019, 2021, and Microsoft 365 on Windows. VBA UserForms are required, so Mac compatibility is limited.
Sheets Explanation — How Every Worksheet Fits Together
Below is a sheet-by-sheet walk-through, in the order users navigate them after logging in.
Home Page — central navigation hub
1. Login Form
The first thing a user sees on opening the workbook is a password-protected Login Form. It runs a VBA validation routine against the User Management sheet — if the credentials match, the workbook unlocks and routes the user to the Home Page. If they fail, the form clears and counts the attempt.
2. Home Page
A central navigation hub with one-click buttons to every sheet. This stops users from clicking on the sheet tabs and lets you keep most sheets hidden. The Home Page is the only “front door” inside the workbook.
Dashboard with 4 slicers and 5 auto-refresh charts
3. Dashboard
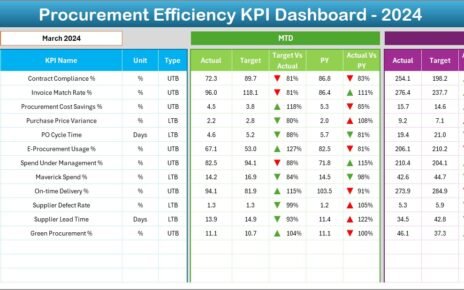
The Dashboard is the analytical hub. It carries a KPI strip on top — total responses, average satisfaction score, sentiment ratio, and severity mix — followed by 4 slicers and 5 charts. Slicers cover Product, Feedback Category, Severity, and Sentiment. The 5 charts visualise response volume by product, average score by category, sentiment distribution, severity-wise breakdown, and a trend line of weekly responses.
Data Sheet — Add / Update / Delete buttons drive the VBA UserForm
4. Data Sheet
The Data Sheet is the master record table. Three buttons sit above the table — Add New Record, Update Record, and Delete Record. All three open the same VBA UserForm: Add inserts a new row, Update prefills the form when a Feedback ID is selected, and Delete confirms before removing the row. End users never type into cells directly.
List Sheet — feeds every combo box in the form
5. List Sheet
The List Sheet is the single source of truth for every dropdown on the Data Entry form. Product names, Feedback Categories, Severity levels, Sentiment values, and Customer Segments all live here. Add a new value to a column and it automatically appears in the matching combo box on the form.
Support Sheet — hidden pivot tables that drive the charts
6. Support Sheet
The Support Sheet contains the pivot tables that drive the Dashboard charts. There is no end-user interaction needed here — once the workbook is set up, you can hide this sheet completely so the user only ever sees the front-end pages. The dashboard refreshes pivots automatically through VBA when a record is added.
Settings Sheet — branding and product metadata
7. Settings Sheet
The Settings Sheet holds your organisation logo, contact details, product portfolio names, and release version numbers. The Login Form and Dashboard read these values, so a quick edit here re-brands the entire workbook.
User Management Sheet — usernames, passwords, and roles
8. User Management Sheet
The User Management Sheet defines every user, their password, and their role. The Login Form reads from here to validate credentials. To add or remove someone, edit a row — no VBA changes required. Combined with sheet-level protection on Data, Support, and Settings, this gives you an in-workbook authorisation model without buying an SSO add-on.
Product Feedback Tracker vs. Google Sheets Equivalent vs. Paid Feedback SaaS — Feature Comparison
| Feature | Product Feedback Tracker in Excel | Google Sheets equivalent | Paid SaaS (e.g., Pendo / Productboard / UserVoice) |
|---|---|---|---|
| Cost | $6.99 one-time ✅ | $6.99 one-time | $25–$150 per user / month ($1,500–$9,000/yr at 5 admins) |
| Platform | Microsoft Excel (offline) ✅ | Google Sheets (browser-only) | Cloud SaaS — vendor lock-in |
| Setup time | Under 10 minutes ✅ | Under 10 minutes | 2–8 weeks (vendor onboarding) |
| VBA Data Entry form (Add / Update / Delete) | Yes — built-in UserForm ✅ | Apps Script form | Yes (web form) |
| Login + role-based access | Yes — User Management sheet ✅ | Sheet protection only | Yes (SSO / SOC 2) |
| Slicer-driven dashboard | 4 slicers, 5 charts, auto-refresh ✅ | Pivot filter views | Pre-built dashboards |
| Customisable feedback fields | Fully editable — own your code ✅ | Fully editable | Vendor-controlled question types |
| Year-1 cost at 5 admins | $6.99 ✅ | $6.99 | $1,500 – $9,000 |
| Mobile data entry | Excel mobile (limited) | Yes (browser + app) ✅ | Yes (native app) |
For product managers and CX leads who want a slicer-driven product-feedback workflow without a per-seat subscription, the Product Feedback Tracker in Excel sits in the sweet spot.
Who Should Use This Template
Perfect for:
- Product managers at 10–500 person companies tracking feature requests, bug reports, and user satisfaction
- Customer success and CX leads consolidating feedback from support tickets, surveys, and sales calls
- Founders and indie SaaS makers who want a $6.99 alternative to a $1,500–$9,000/year feedback SaaS subscription
- UX research teams logging usability test responses and tagging by severity and sentiment
- QA leads who need a quantitative feedback log per product release for retro and roadmap meetings
Not a fit if:
- You need SOC 2 compliance, SSO, or audit-trail logs across 10,000+ feedback responses
- You require cryptographically anonymous feedback — passwords are stored in a sheet, not an enterprise vault
- You are Mac-only — VBA UserForms render reliably only on Windows Excel
- You want a mobile-first respondent flow for customers to submit feedback from their phones in-app
Real-World Use Cases
Riya is a product manager at a 90-person fintech startup in Bengaluru. She uses the Product Feedback Tracker in Excel to consolidate customer feedback from support tickets, NPS surveys, and sales calls into a single Data Sheet. The slicer-driven dashboard helps her present a “top 5 feature requests” deck to the leadership team every sprint review. She replaced a $4,800/year Productboard contract with a one-time $6.99 purchase and kept all feedback data inside the engineering team’s share rather than a vendor cloud.
Hassan runs CX at a 35-person mobile app studio in Berlin with three iOS apps and a web tool in active development. He uses the tracker to log feedback per product, slice by Severity to triage P0 bugs first, and assign roles via the User Management sheet so the dev team has read-only access. When the founder asks “how is the Android beta going?”, Hassan opens the dashboard, clicks the slicer, and the answer is on screen in 10 seconds — no waiting on a SaaS export.
Lina is a UX researcher at a B2B SaaS company in Toronto. She uses the User Management sheet to give designers read-only access while keeping edit rights with herself, then logs every usability test response through the Add Record form. Tagging each entry by Sentiment lets her produce a “what users hate / what users love” summary in under 30 seconds for the next research debrief. The slicer-driven dashboard helps her reply to roadmap-priority questions in Slack with screenshots in under a minute.
Advantages of the Product Feedback Tracker in Excel
- Save $1,500–$9,000 per year compared to paid feedback platforms while keeping the same Add / Update / Delete workflow.
- Cut data-entry errors — combo boxes prevent typos that break pivot tables, and a single source-of-truth List Sheet stops “P0” / “P-0” / “Critical” pollution.
- Own your data — the .xlsm file lives on your share, not in a vendor cloud. No vendor account = no migration when a contract ends.
- Audit-ready — the Data Sheet preserves every row including soft-deleted records (visible to admins via the User Management role), which matches the audit pattern most product teams already use.
- Editable VBA — the source code is unprotected, so an in-house developer can extend the UserForm, add fields, or wire up Outlook to email a weekly digest of the top issues.
Opportunities for Improvement
Every template has trade-offs, and being honest here builds trust:
- Mac compatibility — VBA UserForms do not render reliably on Excel for Mac. If the team is Mac-heavy, the Google Sheets equivalent is a better fit.
- Password storage — passwords sit in a worksheet, not an enterprise vault. For sensitive deployments, layer on Excel’s workbook protection and store the file in a SharePoint or OneDrive folder with strict permissions.
- Mobile data entry — Excel for iOS / Android opens the file but UserForms are not interactive on mobile. Either collect feedback through the desktop file, or pair the workbook with a Microsoft Forms / Google Form that pipes responses into the Data Sheet through Power Automate.
- Concurrent editing — .xlsm files do not support real-time co-editing the way Google Sheets does. For multi-admin teams, store the file in OneDrive with check-in / check-out enabled, or split data collection from analysis.
Best Practices
- Configure users first — open the User Management sheet before anyone else logs in. Add admin and read-only roles for every user up front.
- Lock the List Sheet — once your Products, Categories, Severity levels, and Sentiment values are finalised, protect the sheet. Pivot tables break the moment a value changes spelling.
- Set release versions in Settings — the Dashboard reads product release numbers from the Settings sheet so feedback is always tagged to the right build.
- Trigger a monthly export — once a month, copy the Data Sheet to a dated archive file. This protects against accidental Delete actions and gives you a frozen snapshot for quarterly retros.
- Hide the Support Sheet — once the dashboard is wired, right-click and hide the Support Sheet so end users never accidentally edit pivot ranges.
- Pair with a guide — Microsoft’s official VBA UserForm reference is the best place to learn how to extend the form with new fields.
Explore Relevant Templates
- Product Feedback Tracker in Excel — buy this template directly.
- Product Feedback Tracker in Google Sheets — same workflow, browser-based, mobile-friendly for respondents.
- Customer Feedback Tracker in Google Sheets — broader customer-experience capture with the same Add / Update / Delete pattern.
- Customer Service Quality Feedback Tracker in Google Sheets — sister template focused on support quality tracking.
- Office Renovation Feedback Tracker in Excel — same VBA login + UserForm + slicer dashboard pattern, applied to renovation feedback.
- Customer Feedback Analysis Dashboard in Power BI — Power BI counterpart for teams already using Microsoft Fabric.
- Browse all Excel Tracker Templates on NextGenTemplates.
Frequently Asked Questions
What sheets are included in the Product Feedback Tracker in Excel?
The Product Feedback Tracker in Excel includes 8 sheets — Login Form, Home Page, Dashboard, Data Sheet, List Sheet, Support Sheet, Settings Sheet, and User Management Sheet — all wired together through VBA so adding a feedback record updates the dashboard automatically.
How does the VBA Data Entry form work in this tracker?
Three buttons on the Data Sheet — Add, Update, Delete — open the same UserForm. Add inserts a new feedback row; Update prefills the form when you click an existing Feedback ID; Delete confirms before removing the row. No manual cell editing on the Data Sheet itself.
How long does setup take for the Product Feedback Tracker?
Setup of the Product Feedback Tracker in Excel takes under 10 minutes — open the file, enable macros, edit the List Sheet dropdowns, configure users on the User Management sheet, and personalise the Settings sheet. The Dashboard works without any further configuration.
How does this compare to paid feedback SaaS like Pendo or Productboard?
Paid product-feedback SaaS typically costs $25–$150 per user per month — about $1,500 to $9,000 per year for five admins. The Product Feedback Tracker in Excel is $6.99 one-time with no recurring fees, no per-user pricing, and full ownership of your code and feedback data.
Does the Product Feedback Tracker work on Mac?
The Product Feedback Tracker uses VBA UserForms which render reliably only in Excel for Windows (2016, 2019, 2021, Microsoft 365). Mac Excel does not fully support UserForm controls, so we recommend Windows. The Google Sheets equivalent works on any device including Mac.
Can I add custom feedback fields and dropdowns to the tracker?
Yes. All combo-box values come from the List Sheet, so adding a new Product, Feedback Category, Severity, or Sentiment label takes one row. For new fields, edit the UserForm in the VBA editor — full source code is included and unprotected.
Is the Product Feedback Tracker a one-time purchase?
Yes. The Product Feedback Tracker in Excel is $6.99 one-time, instant download, no subscription, no per-user fees, and lifetime access. You also get free updates whenever the template is revised.
About the Author
Built by PK — Microsoft Certified Professional with 15+ years of Excel, Google Sheets, and Power BI experience. Founder of NextGenTemplates, reaching 300K+ subscribers across YouTube channels. Every template is hand-built and tested before release.
Conclusion
If you are running a product team right now, you do not need a $9,000-a-year SaaS contract to consolidate feedback — you need a clean Data Sheet, a forced-validation UserForm, and a slicer-driven dashboard you can show to leadership on Friday. The Product Feedback Tracker in Excel gives you all three in a single .xlsm file, with VBA login, role-based access, and 8 worksheets wired together so a new entry on Monday morning updates Friday’s chart-pack on its own.
👉 Click here to Purchase the Product Feedback Tracker in Excel
✅ Instant download · One-time payment · No subscription
🎥 Visit Youtube.com/@PK-AnExcelExpert for step-by-step video tutorials on building Excel dashboards, VBA UserForms, and trackers like this one.
📅 Last updated: April 2026