The film and television industry thrives on creativity, audience engagement, and business intelligence. From pre-production budgeting to post-release performance, every stage generates valuable data. But managing all that information across platforms, regions, and genres can feel overwhelming.
That’s where the Film & Television Dashboard in Power BI becomes a true game-changer. This interactive, data-driven solution empowers studios, production houses, and distributors to track performance, optimize investments, and enhance creative decisions — all in one centralized platform.
Click to Purchases Film & Television Dashboard in Power BI
In this article, we’ll explore the structure, features, advantages, and best practices of this ready-to-use Power BI dashboard. Whether you are a filmmaker, producer, or data analyst, this guide will help you understand how to leverage Power BI to transform entertainment data into actionable insights.
What Is a Film & Television Dashboard in Power BI?
A Film & Television Dashboard in Power BI is a visual analytics solution designed to monitor, analyze, and present key performance indicators (KPIs) across the entertainment ecosystem.
Built using Microsoft Power BI, it integrates data from Excel, production reports, and financial sheets to create an intuitive, interactive workspace.
With this dashboard, users can:
-
Track released and post-production films by platform, region, and department.
-
Compare budgets versus revenues for every project.
-
Evaluate ratings by genre, platform, and region.
-
Identify which production areas drive higher returns or require improvement.
-
Visualize monthly performance trends with dynamic charts and slicers.
Instead of juggling spreadsheets or scattered reports, you can now visualize the entire film lifecycle — from budgeting and production to ratings and revenue — all within one Power BI file.
Key Features of the Film & Television Dashboard in Power BI
This dashboard comes with five interactive pages, each providing a focused view of specific insights. Let’s explore them one by one.
1️⃣ Overview Page — The Central Insight Hub

The Overview Page acts as the control center of the dashboard. It summarizes top-level KPIs and visualizes overall film performance across genres, platforms, and regions.
Highlights:
-
🎯 5 KPI Cards: Display real-time metrics like total films, released film percentage, average rating, total budget, and total revenue.
📊 Charts Included:
- Released Film %
- Post-Production Films by Platform
- Ratings by Genre
- Budget of Released Films
- Revenue (USD) by Region
How it helps:
With slicers on the left, you can instantly filter by month, genre, or platform. This view gives a snapshot of what’s working and what needs attention — ideal for producers and executives who want high-level insights at a glance.
2️⃣ Department Analysis — Understanding Functional Performance
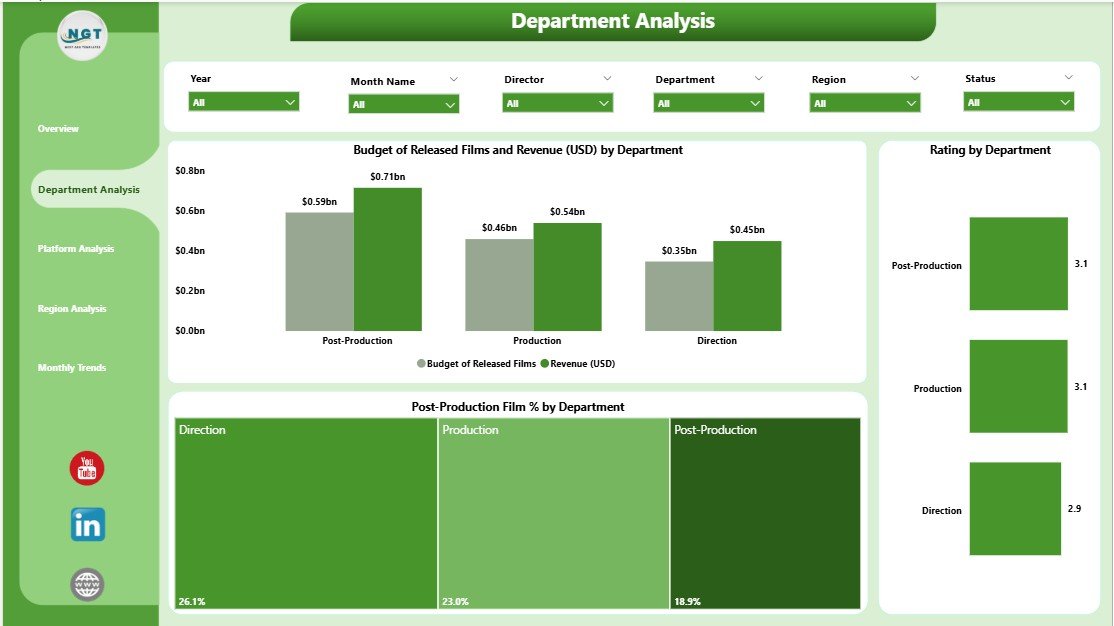
Every film project involves multiple departments — production, direction, editing, marketing, and more. The Department Analysis Page focuses on comparing department-level performance metrics.
Included Visuals:
-
Budget of Released Films and Revenue (USD) by Department
-
Ratings by Department
-
Post-Production Film % by Department
Purpose:
This page helps decision-makers identify which departments are operating efficiently and which ones exceed or fall behind budget expectations. For instance, you can quickly compare how the marketing department’s expenses align with revenue outcomes.
Use Case Example:
If post-production costs are high but the output quality leads to better ratings, that insight can justify future investments in editing and VFX teams.
3️⃣ Platform Analysis — Evaluating Digital & Distribution Channels
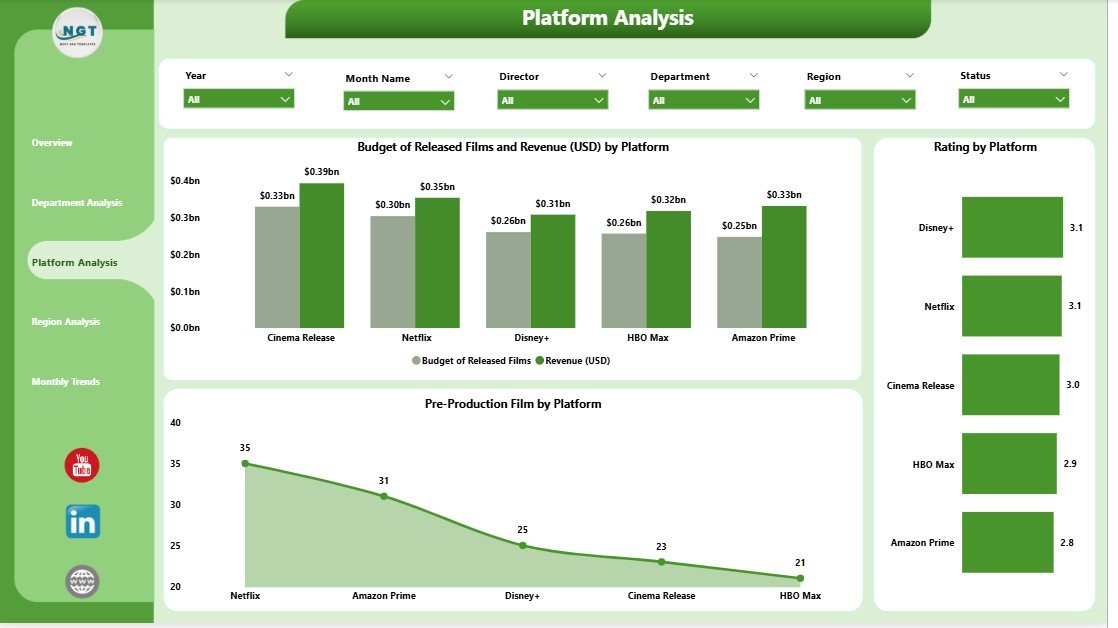
With multiple streaming platforms and distribution partners in today’s media ecosystem, understanding performance by platform is essential.
The Platform Analysis Page reveals how each digital or broadcasting platform contributes to success.
Visuals on this page:
-
At-Risk Budget of Released Films and Revenue (USD) by Platform
-
Rating by Platform
-
Post-Production Films by Platform
Benefits:
This analysis shows which platforms deliver higher returns, stronger ratings, or more consistent audience engagement. Whether it’s Netflix, Amazon Prime, or a regional network, this view makes it easy to compare performance across all channels.
4️⃣ Region Analysis — Mapping Global Success
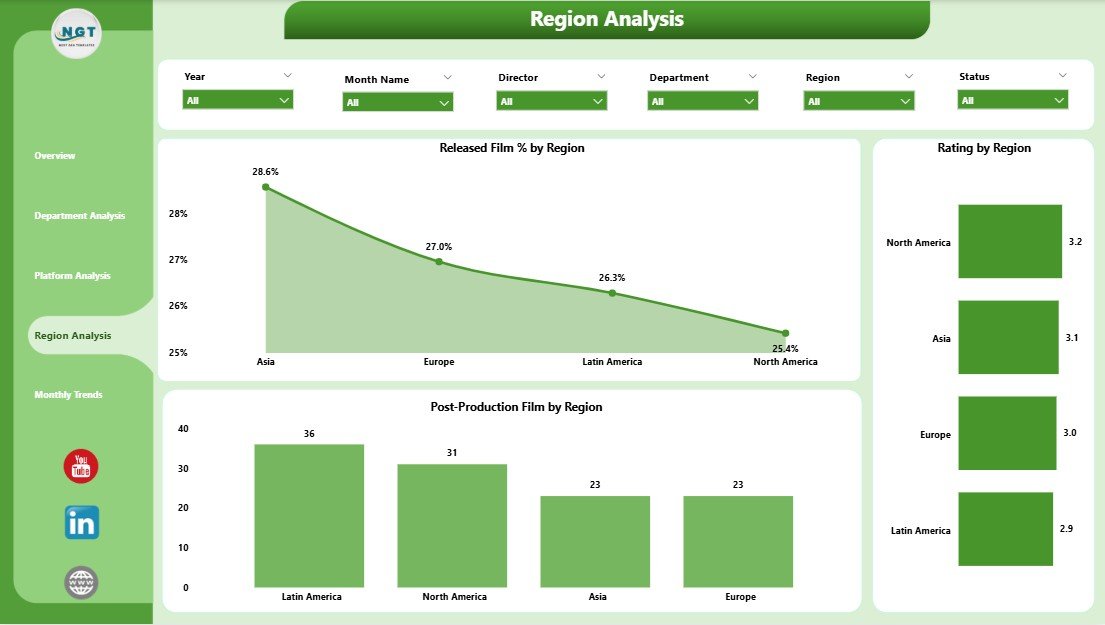
The film and television industry is global. Regional preferences, local budgets, and audience tastes vary dramatically. The Region Analysis Page visualizes these differences to inform strategic distribution decisions.
Charts included:
-
Rating by Region
-
Post-Production Films by Region
-
Released Film % by Region
Why it matters:
Producers can identify which regions generate higher ratings and returns, making it easier to prioritize markets for premieres, marketing, and localization efforts. It’s also a valuable tool for spotting underperforming regions that may need better promotion or dubbing strategies.
5️⃣ Monthly Trends — Tracking Time-Based Performance
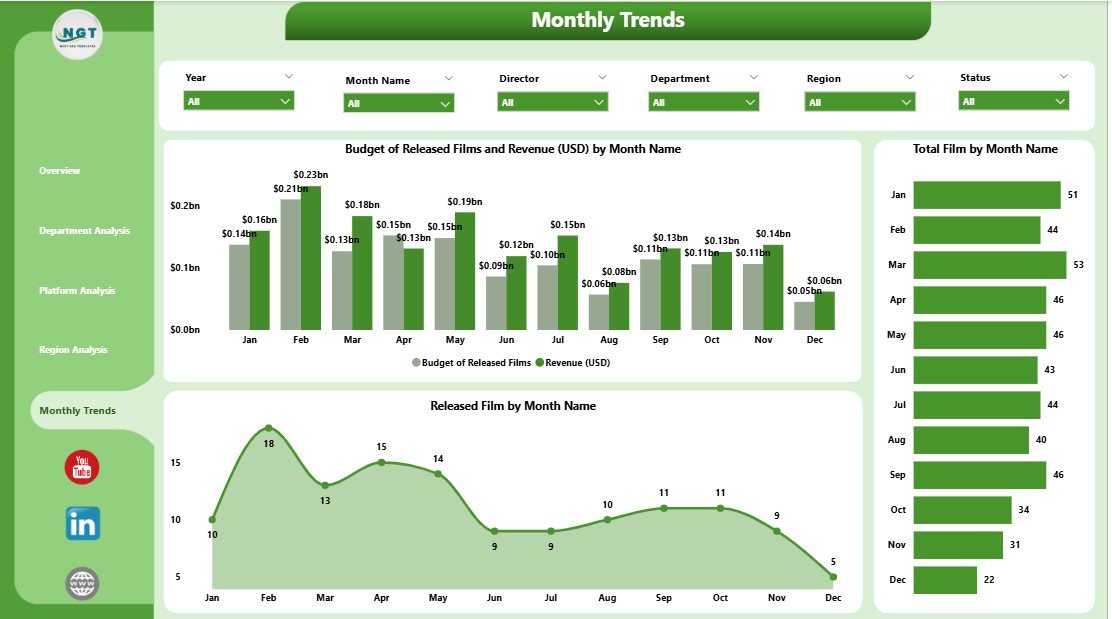
Consistency and timing are key in entertainment. The Monthly Trends Page allows users to track production and performance data month-by-month.
Charts included:
-
Released Films by Month
-
Total Films by Month
-
Rating by Genre
-
Budget of Released Films
-
Revenue (USD) by Month
Insights gained:
You can discover which months deliver more releases, higher ratings, or increased revenue — perfect for planning next year’s production calendar or release schedule.
Why Power BI Is the Perfect Tool for the Film Industry
Microsoft Power BI is one of the most powerful visualization tools available. Here’s why it fits the entertainment industry perfectly:
-
Data Consolidation: Integrates Excel, cloud databases, and third-party tools into one source of truth.
-
Visual Storytelling: Creates visually engaging dashboards — essential for creative industries.
-
Interactivity: Users can slice, filter, and drill down to find insights in seconds.
-
Scalability: Works for small studios and large media conglomerates alike.
-
Automation: Updates data automatically with new Excel uploads or database refreshes.
With Power BI, film professionals no longer rely solely on manual spreadsheets — they use automated intelligence to make faster, smarter decisions.
Advantages of the Film & Television Dashboard in Power BI
Let’s explore the main benefits of using this dashboard for film and TV analytics.
1. Centralized Data View
All production, financial, and performance data sits in one location, eliminating the chaos of multiple spreadsheets and reports.
2. Real-Time Decision-Making
Instant visual updates allow producers to act quickly on trends — such as rising costs or declining ratings — without waiting for manual reports.
3. Departmental Accountability
Each department’s performance becomes transparent, fostering responsibility and efficient resource use.
4. Budget Optimization
Compare planned versus actual spending to identify wastage and ensure every dollar contributes to creative quality or business impact.
5. Audience & Platform Insights
Understand how audiences respond to films by genre, platform, and region to refine marketing and release strategies.
6. Performance Forecasting
Using trend analysis, teams can predict upcoming ratings or revenues and align future projects accordingly.
7. Customization Flexibility
Users can modify visuals, add slicers, or integrate new data sources to tailor the dashboard to their exact needs.
How to Use the Film & Television Dashboard Effectively
Here’s a simple step-by-step process for using this Power BI dashboard efficiently:
-
Import Data: Load your Excel or CSV data into Power BI.
-
Update Parameters: Adjust the slicers for month, platform, and department to filter insights.
-
Analyze KPIs: Start from the Overview Page to get a summary view.
-
Drill Down: Explore Department or Platform pages for detailed performance insights.
-
Compare Trends: Use the Monthly Trends page to assess which months perform best.
-
Refine Strategy: Apply insights to budgeting, distribution, or marketing plans.
By following this process, you can turn raw data into actionable intelligence that drives success across projects.
🛠️ Technical Structure Behind the Dashboard
Click to Purchases Film & Television Dashboard in Power BI
This dashboard is designed for Power BI Desktop, connecting seamlessly with an Excel data source.
Structure Overview:
-
Data Source: Excel workbook containing film data (genre, platform, region, department, budget, revenue, rating).
-
Power Query: Used for data cleaning, merging, and transformation.
-
DAX Measures: Created to calculate KPIs such as Released Film %, Budget Utilization, and Average Rating.
-
Visualizations: Clustered column charts, pie charts, cards, and slicers.
-
Navigation: A sidebar page navigator allows easy movement across all five pages.
Bonus: You can publish this dashboard to Power BI Service for online sharing and collaboration across teams.
💬 Real-World Use Cases of the Film & Television Dashboard
-
Production Studios: Track budgets, timelines, and ROI for each project.
-
Streaming Platforms: Analyze performance by region and platform for content licensing decisions.
-
Marketing Teams: Identify the best months and regions for promotional campaigns.
-
Financial Analysts: Compare production spending vs. revenue to ensure profitability.
-
Creative Directors: Evaluate audience ratings and genre preferences to guide new scripts.
Whether you’re part of a large studio or an independent team, this dashboard offers insights that directly influence success.
🌟 Best Practices for the Film & Television Dashboard in Power BI
To get the most from this powerful tool, follow these best practices:
✅ 1. Keep Data Clean and Updated
Regularly refresh your Excel or database connections so the visuals always reflect current performance.
✅ 2. Define Clear KPIs
Avoid clutter. Focus on KPIs that truly impact financial and creative outcomes, such as ROI, ratings, and audience reach.
✅ 3. Use Interactive Filters
Add slicers for month, platform, and department so users can explore data dynamically.
✅ 4. Maintain Visual Consistency
Use uniform color themes for clarity — for example, blue for revenue and orange for budget metrics.
✅ 5. Combine with Predictive Analytics
Integrate Power BI’s AI visuals or machine-learning models to forecast film performance trends.
✅ 6. Share Insights Across Teams
Publish the dashboard to Power BI Service so producers, editors, and marketers can collaborate in real time.
✅ 7. Protect Sensitive Data
Apply row-level security in Power BI to ensure only authorized users can access confidential financial data.
Following these practices ensures your dashboard remains accurate, actionable, and accessible to everyone involved in the filmmaking process.
Conclusion
The Film & Television Dashboard in Power BI is more than a reporting tool — it’s a storytelling companion for data-driven decision-making in entertainment.
By consolidating production, performance, and revenue data into one interactive workspace, it enables studios to enhance creativity, optimize budgets, and maximize audience satisfaction.
With pages for Overview, Department, Platform, Region, and Monthly Trends, this dashboard offers a complete picture of the film industry’s dynamic environment.
Whether you’re a producer tracking ROI or a data analyst evaluating ratings, this solution helps you turn raw data into meaningful stories that inspire smarter decisions.
❓ Frequently Asked Questions (FAQs)
1. What data sources can be used for the Film & Television Dashboard in Power BI?
You can use Excel, CSV files, SQL databases, or even APIs from streaming platforms. The dashboard is flexible and supports multiple input formats.
2. Can small studios or independent filmmakers use this dashboard?
Absolutely! Power BI scales beautifully. Even small teams can start with Excel-based data and later expand to larger data sources.
3. How often should I update the data?
Ideally, refresh it weekly or after each new film release to ensure the visuals always reflect the latest insights.
4. Can I customize visuals or add more KPIs?
Yes. Power BI allows full customization. You can easily add new visuals, rename metrics, or change the theme colors.
5. Does this dashboard work offline?
Yes, the Power BI Desktop version works offline. You only need an internet connection when publishing to Power BI Service for sharing.
6. Is any technical expertise required?
Not much. If you’re familiar with Excel, you can easily learn Power BI basics. The dashboard comes ready-to-use, so you can start analyzing immediately.
7. Can it handle historical data for multiple years?
Yes, Power BI efficiently manages large datasets, so you can track multi-year trends and performance analytics effortlessly.
Visit our YouTube channel to learn step-by-step video tutorials