Running a successful home décor store requires more than creative designs and attractive products. In today’s competitive retail environment, store owners and managers must track performance, control costs, and respond quickly to changing customer demand. Therefore, data-driven decision-making becomes essential.
That is exactly where a Home Decor Stores KPI Dashboard in Power BI plays a critical role.
In this detailed article, you will learn what a Home Decor Stores KPI Dashboard in Power BI is, why it is important, how it works, its page-wise structure, key KPIs, data requirements, advantages, best practices, and frequently asked questions. Moreover, the language stays simple, clear, and practical so that both business users and analysts can easily understand and apply it.
Click to Purchases Home Decor Stores KPI Dashboard in Power BI
What Is a Home Decor Stores KPI Dashboard in Power BI?
A Home Decor Stores KPI Dashboard in Power BI is a centralized, interactive, and visual reporting solution designed to monitor the performance of home décor retail stores using key performance indicators (KPIs).
Instead of reviewing multiple Excel sheets or manual reports, this dashboard brings all KPIs together in one place. As a result, store owners, retail managers, and analysts can quickly evaluate whether the business is meeting its goals.
Furthermore, Power BI transforms raw Excel data into meaningful insights using charts, tables, slicers, and indicators. Consequently, decision-makers save time and gain clarity.
Why Do Home Decor Stores Need a KPI Dashboard?
Home décor stores manage several operational and financial activities every day. For instance, they track sales, inventory, margins, customer trends, and seasonal demand. However, without a structured dashboard, monitoring these metrics becomes difficult.
Here is why a KPI dashboard becomes essential:
-
It provides real-time performance visibility
-
It highlights target achievements and gaps
-
It improves accountability across KPI groups
-
It supports faster and smarter decisions
-
It reduces manual reporting efforts
Therefore, a Home Decor Stores KPI Dashboard in Power BI acts as a single source of truth for performance management.
Click to Purchases Home Decor Stores KPI Dashboard in Power BI
How Does a Home Decor Stores KPI Dashboard in Power BI Work?
The dashboard works by connecting Power BI to an Excel data source. You update the Excel file with actual and target values, and Power BI automatically refreshes visuals and calculations.
The workflow looks like this:
-
Enter KPI data into Excel input sheets
-
Load the Excel file into Power BI
-
Power BI calculates MTD, YTD, and variance metrics
-
Visuals update automatically based on slicers
-
Users analyze performance and take action
As a result, the dashboard remains dynamic, flexible, and easy to maintain.
Page-Wise Structure of the Home Decor Stores KPI Dashboard in Power BI
This dashboard contains three well-structured pages, each designed for a specific analytical purpose.
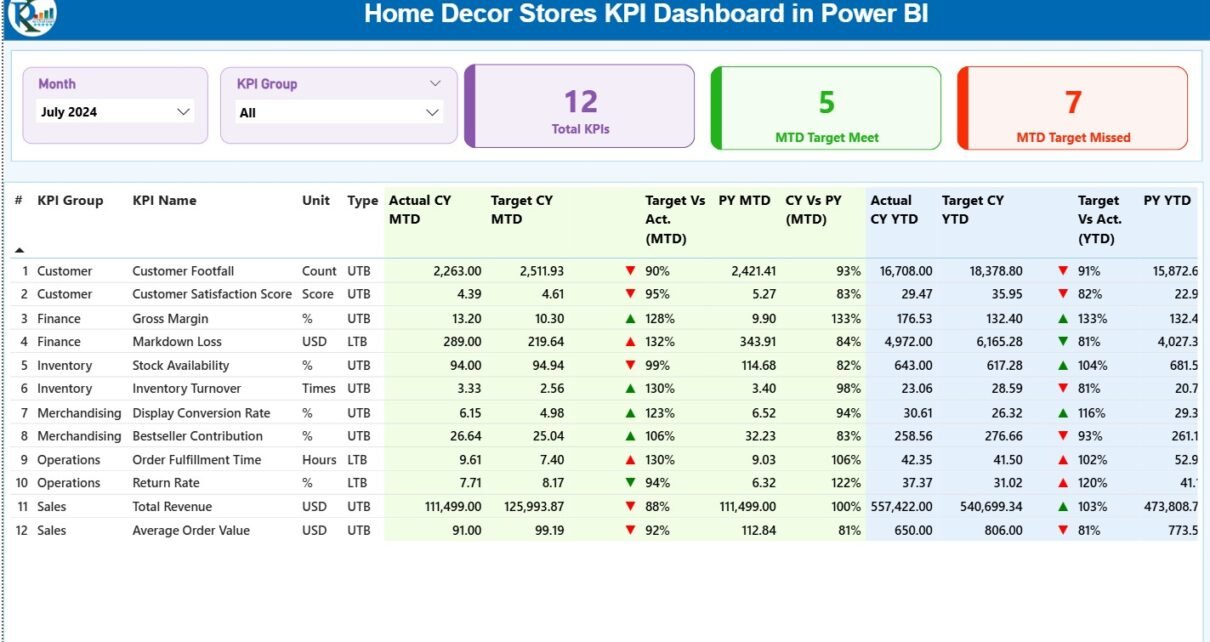
1. Summary Page: How Does the Main Dashboard Help Decision-Makers?
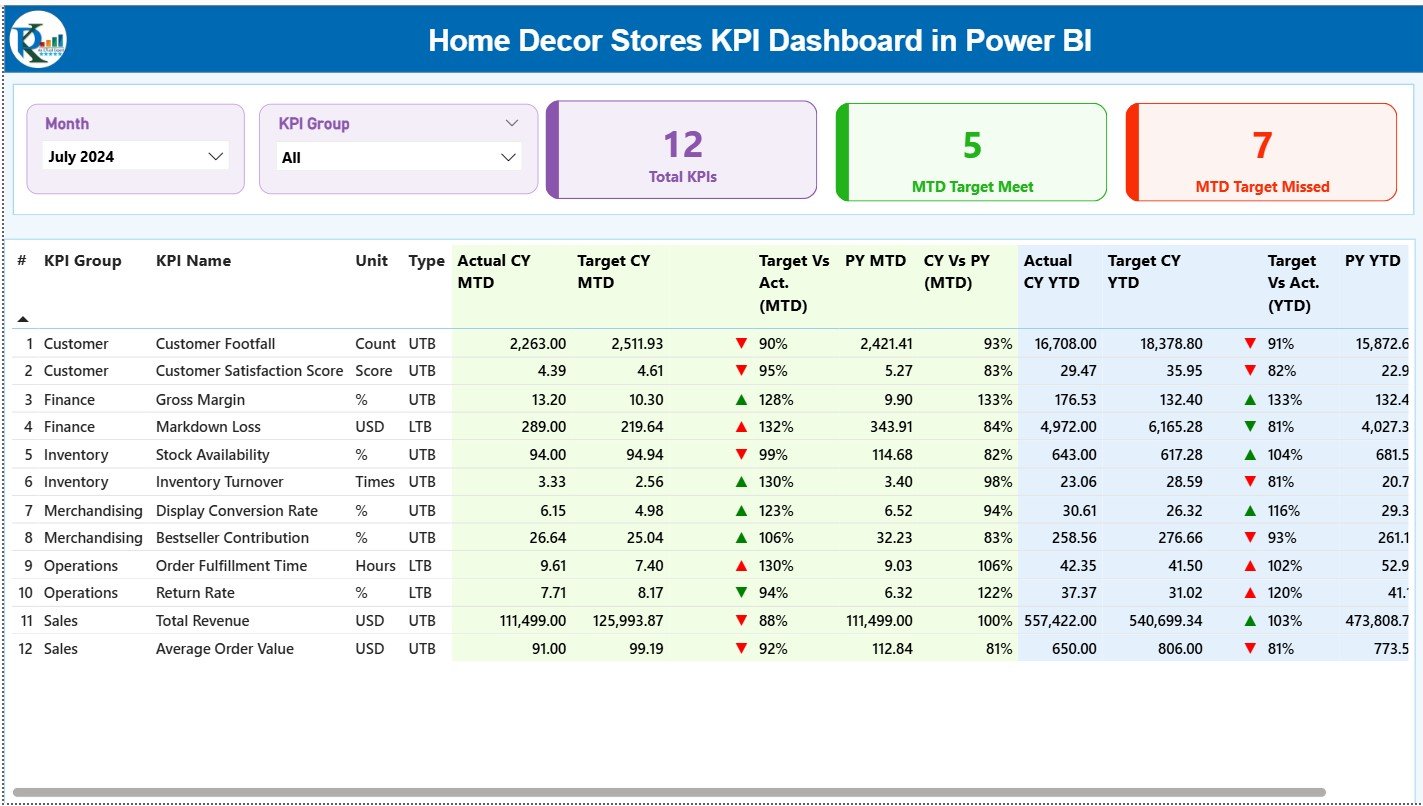
The Summary Page is the main landing page of the dashboard. It provides a complete snapshot of performance at a glance.
Key Slicers on the Summary Page
At the top of the page, you will find two important slicers:
-
Month slicer – Allows users to select a specific reporting month
-
KPI Group slicer – Enables filtering KPIs by category
Because of these slicers, users can quickly focus on relevant KPIs without scrolling or switching pages.
KPI Cards on the Summary Page
Just below the slicers, three KPI cards provide instant insights:
-
Total KPIs Count – Displays the total number of KPIs being tracked
-
MTD Target Met Count – Shows how many KPIs met their monthly targets
-
MTD Target Missed Count – Highlights KPIs that failed to meet targets
These cards help decision-makers instantly understand overall performance health.
Detailed KPI Performance Table
Below the KPI cards, the dashboard displays a detailed KPI table with comprehensive metrics.
Columns Explained Clearly
-
KPI Number
A unique sequence number assigned to each KPI. -
KPI Group
The category or group to which the KPI belongs. -
KPI Name
The name of the KPI being tracked. -
Unit
The measurement unit such as %, USD, count, or quantity. -
Type (LTB / UTB)
Indicates whether the KPI is:-
LTB (Lower the Better)
-
UTB (Upper the Better)
-
Monthly Performance Metrics (MTD)
-
Actual CY MTD
Actual current year month-to-date value. -
Target CY MTD
Target value set for the current month. -
MTD Icon
Displays ▲ (green) or ▼ (red) to indicate target achievement. -
Target vs Actual (MTD)
Calculated as:
Actual MTD / Target MTD -
PY MTD
Previous year’s MTD value for the same period. -
CY vs PY (MTD)
Calculated as:
Current Year MTD / Previous Year MTD
Year-to-Date Performance Metrics (YTD)
-
Actual CY YTD
Current year cumulative actual value. -
Target CY YTD
Current year cumulative target value. -
YTD Icon
Visual indicator of YTD performance status. -
Target vs Actual (YTD)
Calculated as:
Actual YTD / Target YTD -
PY YTD
Previous year YTD value. -
CY vs PY (YTD)
Calculated as:
Current Year YTD / Previous Year YTD
As a result, users can analyze both short-term and long-term performance in one place.
Click to Purchases Home Decor Stores KPI Dashboard in Power BI
2. KPI Trend Page: How Can You Analyze KPI Trends Over Time?
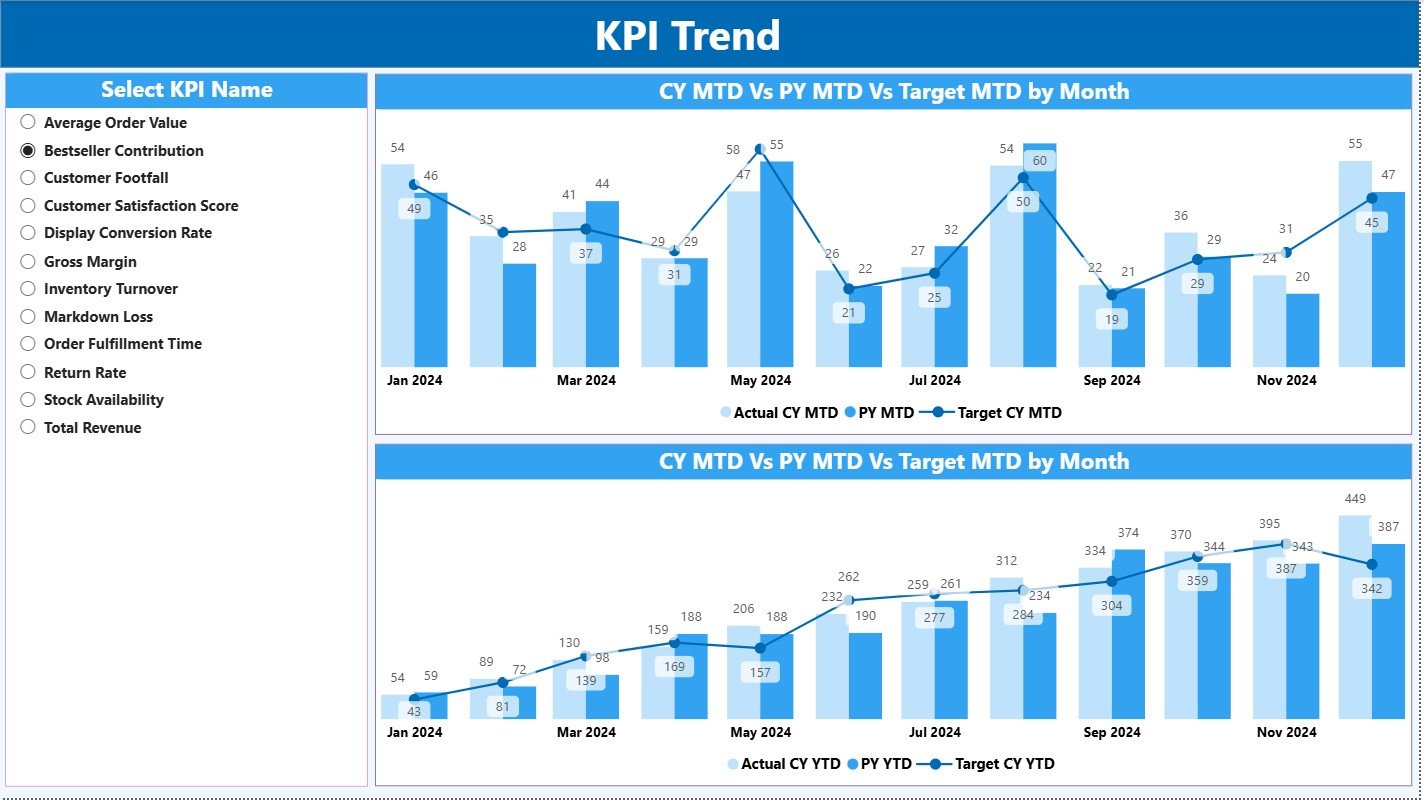
The KPI Trend Page focuses on performance movement rather than static values.
Key Features of the KPI Trend Page
-
Two combo charts for:
-
MTD trends
-
YTD trends
-
-
Each chart compares:
-
Current Year Actual
-
Previous Year Actual
-
Target values
-
-
A KPI Name slicer on the left side
Because of this design, users can analyze trends for one KPI at a time.
Why Trend Analysis Matters for Home Decor Stores
Trend analysis helps identify:
-
Seasonal demand patterns
-
Consistent underperformance
-
Growth opportunities
-
Target-setting accuracy
Therefore, this page supports proactive planning instead of reactive decision-making.
3. KPI Definition Page: Why Is KPI Clarity Important?
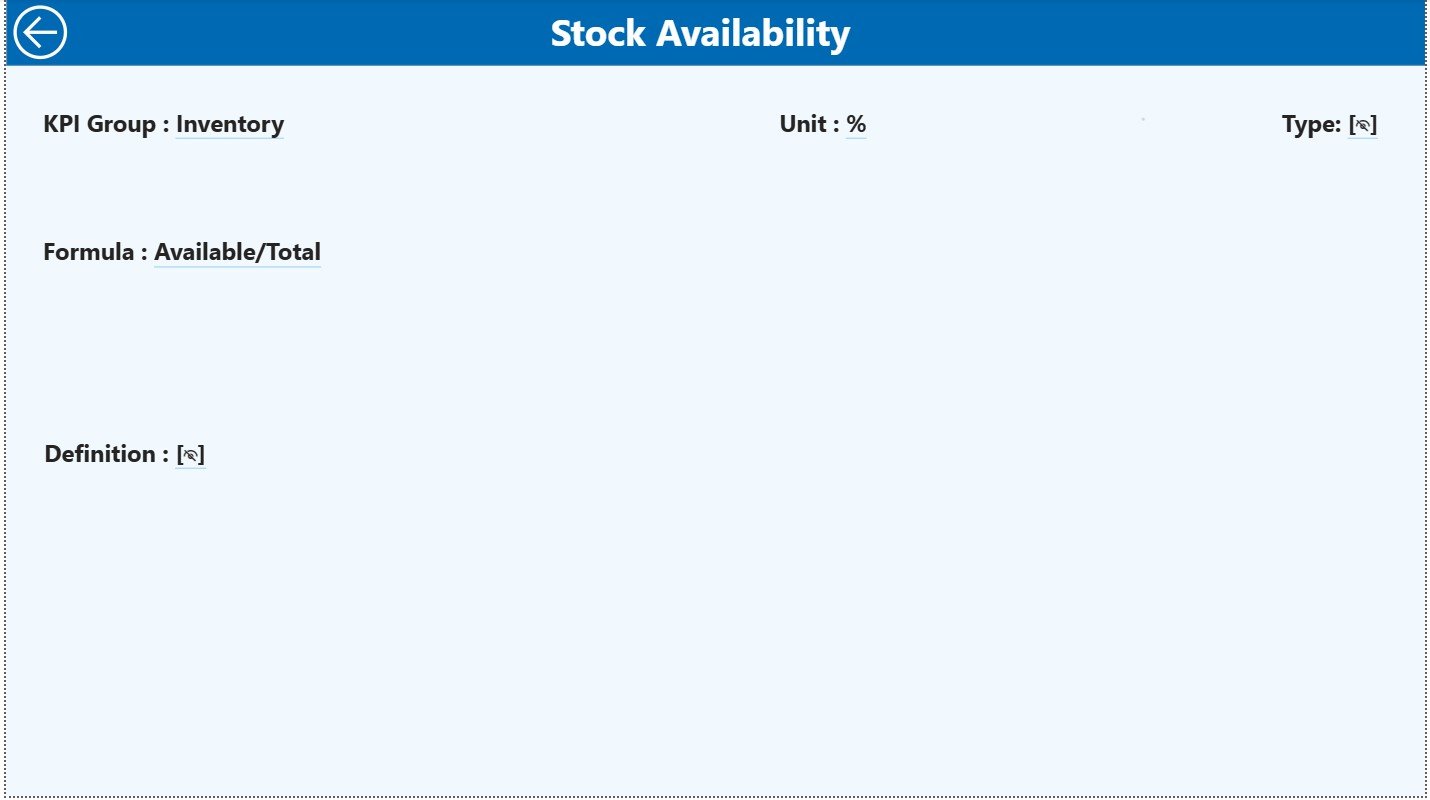
The KPI Definition Page is a drill-through page designed to explain each KPI in detail.
Key Details Available on This Page
-
KPI Formula
-
KPI Definition
-
KPI Type (LTB or UTB)
This page remains hidden by default. However, users can drill through from the Summary Page to access it.
To return to the main page, users simply click the Back button located at the top-left corner.
As a result, the dashboard remains clean while still providing full KPI transparency.
What Excel Data Is Required for the Dashboard?
The dashboard uses an Excel file as its data source. This approach keeps data entry simple and flexible.
1. Input_Actual Sheet: How Do You Enter Actual Performance Data?
In the Input_Actual sheet, users enter actual KPI values.
Required Columns
-
KPI Name
-
Month (use the first date of the month)
-
MTD value
-
YTD value
This sheet captures real performance numbers.
2. Input_Target Sheet: How Do You Set KPI Targets?
In the Input_Target sheet, users enter target values.
Required Columns
-
KPI Name
-
Month (use the first date of the month)
-
MTD target
-
YTD target
Targets drive variance analysis and performance tracking.
Click to Purchases Home Decor Stores KPI Dashboard in Power BI
3. KPI Definition Sheet: How Do You Define KPIs Properly?
The KPI Definition sheet stores metadata.
Required Columns
-
KPI Number
-
KPI Group
-
KPI Name
-
Unit
-
Formula
-
Definition
-
Type (LTB or UTB)
This sheet ensures consistency and clarity across all KPIs.
Advantages of Home Decor Stores KPI Dashboard in Power BI
Using this dashboard offers several strong advantages.
Key Advantages Explained
-
Centralized reporting
All KPIs stay in one interactive dashboard. -
Time-saving automation
Power BI eliminates manual calculations. -
Clear performance visibility
Icons and percentages show results instantly. -
Better decision-making
Managers act quickly using real insights. -
Scalable structure
You can add more KPIs anytime. -
User-friendly interface
Even non-technical users can operate it. - Click to Purchases Home Decor Stores KPI Dashboard in Power BI
Best Practices for Home Decor Stores KPI Dashboard in Power BI
Following best practices ensures maximum value.
Recommended Best Practices
-
Keep KPI definitions simple and consistent
-
Update Excel data regularly
-
Use meaningful KPI groups
-
Review MTD and YTD trends monthly
-
Avoid tracking too many KPIs at once
-
Align targets with business goals
-
Train users on slicers and drill-through
By following these practices, the dashboard stays effective and reliable.
Who Can Use This Dashboard?
This dashboard benefits multiple roles:
-
Home décor store owners
-
Retail managers
-
Regional heads
-
Sales and operations teams
-
Business analysts
Because of its simple design, it suits both small and large retail setups.
Conclusion: Why Should You Use a Home Decor Stores KPI Dashboard in Power BI?
A Home Decor Stores KPI Dashboard in Power BI transforms scattered data into meaningful insights. It simplifies performance tracking, improves accountability, and supports smarter decisions.
Instead of guessing outcomes, store managers rely on real numbers. Moreover, the Excel-based data structure keeps the system flexible and easy to maintain.
If you want better control, clearer insights, and faster decisions, this dashboard becomes an essential tool for your home décor business.
Frequently Asked Questions (FAQs)
What is the main purpose of a Home Decor Stores KPI Dashboard?
The main purpose is to track, analyze, and improve store performance using KPIs.
Do I need Power BI expertise to use this dashboard?
No. Basic Power BI knowledge is sufficient for daily usage.
Can I customize KPIs in this dashboard?
Yes. You can add, remove, or modify KPIs using the Excel data file.
How often should I update the Excel data?
You should update it monthly or as frequently as required.
Can this dashboard handle multiple stores?
Yes. With minor customization, it can support multiple stores.
Is this dashboard suitable for small home decor shops?
Yes. It works well for both small and large businesses.
Click to Purchases Home Decor Stores KPI Dashboard in Power BI
Visit our YouTube channel to learn step-by-step video tutorials