Managing inventory can be overwhelming, especially when you have hundreds—or even thousands—of products to track across multiple locations. But what if you could visualize all your key stock data in one place? That’s exactly what an Inventory Management Dashboard in Excel delivers. Whether you’re a small business or a large enterprise, this tool can simplify your stock analysis, streamline your reporting, and boost efficiency.
In this article, we’ll explore how to use an Inventory Management Dashboard built in Excel. You’ll learn about its structure, features, benefits, and best practices. Let’s get started!
Click to Purchases Inventory Management Dashboard in Excel
What is an Inventory Management Dashboard in Excel?
An Inventory Management Dashboard in Excel is a centralized interface that allows you to view, monitor, and analyze all key inventory metrics using dynamic charts, slicers, and tables. It offers a visual and interactive way to stay on top of stock levels, warehouse performance, supplier contributions, and restocking needs.
Rather than navigating through raw tables, this dashboard gives you:
- Visual insights into stock health
- Instant overviews by category, warehouse, and supplier
- Easy restocking analysis
- Drill-down capabilities
Key Features of the Inventory Dashboard
Our Inventory Management Dashboard is built in Excel and comes with five interactive analytical pages and supporting data sheets. Here’s what makes it powerful and user-friendly:
Page Navigator
A top-mounted navigation bar helps users switch between different dashboard pages quickly. This saves time and avoids confusion.
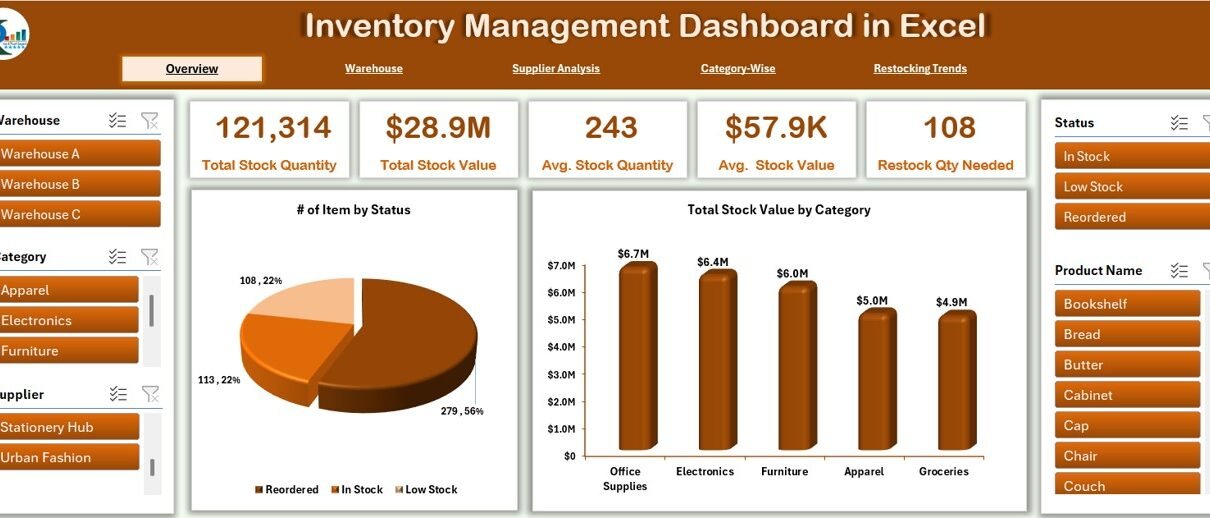
Overview Page

This is your control center. It includes:
- Left and right slicers for dynamic filtering
- 5 summary cards displaying KPIs
2 charts:
- Number of Items by Status
- Total Stock Value by Category
Warehouse Performance Page

Dive deeper into how each warehouse is performing:
- Slicers for dynamic filtering
- 5 summary cards
3 charts:
- Total Stock Quantity by Warehouse
- Total Stock Value by Warehouse
- Average Stock Value by Warehouse
Supplier Analysis Page

Track how well your suppliers are fulfilling inventory needs:
- 5 summary cards
3 charts:
- Total Stock Quantity by Supplier
- Total Stock Value by Supplier
- Restock Quantity Needed by Supplier
Category-Wise Drilldown Page
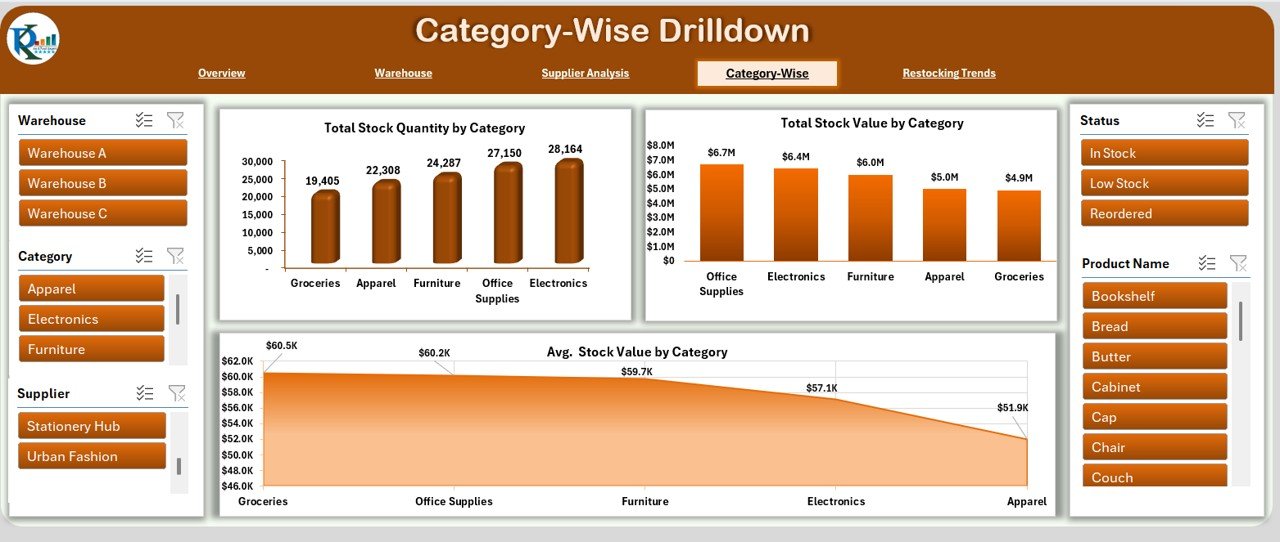
Understand product performance by category:
- 5 summary cards
3 charts:
- Total Stock Quantity by Category
- Total Stock Value by Category
- Average Stock Value by Category
Restocking Trends Page
Stay ahead of your stockouts:
- 5 summary cards
2 charts:
- Recently Ordered Quantity by Product Name
- Available Quantity by Product Name (to be Ordered)
Data Sheet
Click to Purchases Inventory Management Dashboard in Excel
All calculations and visualizations feed from this well-organized data table. It includes:
- Item ID
- Product Name
- Category
- Warehouse
- Supplier
- Stock Quantity
- Reorder Level
- Unit Price (USD)
- Total Value (USD)
- Status
- Last Restocked
- Recently Restocked
- Restock Needed
Support Sheet
This contains all the backend dropdown lists, validation ranges, and helper formulas to keep the dashboard dynamic and user-friendly.
Advantages of an Inventory Management Dashboard in Excel
✅ Real-Time Insights
Get updated visualizations every time you refresh or update the data.
✅ No Coding Required
Built fully in Excel—no macros or third-party tools required.
✅ Cost-Effective
Excel is already available in most business environments, making this dashboard a budget-friendly solution.
✅ Fully Customizable
Easily tailor it to suit different industries, products, or warehouse setups.
✅ Better Decision-Making
With clear visuals and actionable metrics, you can make faster, smarter decisions.
Best Practices for Using the Inventory Management Dashboard
Click to Purchases Inventory Management Dashboard in Excel
To get the most out of this tool, follow these best practices:
🔄 Keep Data Updated
Regularly update your Data Sheet to ensure accuracy in the dashboard insights.
📂 Backup Regularly
Always keep a backup version before making major changes to formulas or visuals.
📝 Use Consistent Data Entry
Avoid typos and inconsistencies in product names, suppliers, and categories.
⚖️ Define Reorder Points Clearly
Ensure that each product has a well-thought-out reorder level to automate restocking flags.
🔮 Train Your Team
If others will use this dashboard, provide a quick walkthrough or user manual.
❓ Why Should You Use Excel for Inventory Dashboards?
🧵 Familiar Tool
Most users already understand Excel, so there is no steep learning curve.
✏️ Flexible Layouts
You can easily modify or expand the dashboard as your business grows.
⚖️ High Compatibility
Excel dashboards can be shared via email or cloud without worrying about version mismatches.
What Analysis Can You Perform with This Dashboard?
- Stock Status Overview: Monitor which items are in stock, low, or out-of-stock.
- Warehouse Trends: Identify which warehouses need attention.
- Supplier Performance: Evaluate which suppliers contribute the most.
- Category Contribution: Understand stock distribution by category.
- Restock Planning: Predict restocking needs based on reorder levels.
Frequently Asked Questions (FAQs)
1. Can I use this dashboard without advanced Excel knowledge?
Yes! The dashboard is designed for anyone with basic Excel skills. Slicers and charts are easy to navigate.
2. Can I add more KPIs or charts to the existing layout?
Absolutely. The Excel layout is modular. You can duplicate existing charts or add new pivot charts as needed.
3. Will this work on older versions of Excel?
Yes, it works best with Excel 2016 and above, but it can also function in Excel 2013 with minor adjustments.
4. Is the dashboard mobile-friendly?
While Excel is primarily a desktop application, you can view the file using Excel mobile or OneDrive. However, for full functionality, desktop use is recommended.
This will flag items that need restocking.
6. Can I connect this dashboard to live inventory systems?
Yes, with Power Query or linked Excel files, you can automate data import from external systems like ERP or inventory apps.
Conclusion
If you’re still managing your inventory through manual tables or fragmented tools, now is the time to switch to a smarter system. An Inventory Management Dashboard in Excel transforms raw data into clear, actionable insights. It empowers your team to make quicker decisions, avoid stockouts, and stay in full control of stock across multiple warehouses and suppliers.
With powerful visuals, dynamic filtering, and zero-code implementation, this dashboard is a must-have for any inventory manager looking to simplify operations and maximize stock efficiency.
Click to Purchases Inventory Management Dashboard in Excel
Visit our YouTube channel to learn step-by-step video tutorials