Managing customer service and support functions without clear timelines and performance metrics often results in missed deadlines, frustrated clients, and wasted resources. To overcome these challenges, businesses now turn to Customer Service and Support Project Timeline KPI Dashboards in Excel—a powerful, ready-to-use solution that helps track performance, enhance visibility, and boost accountability.
In this article, we’ll explore how this Excel-based dashboard works, its key features, benefits, implementation strategies, and best practices. Whether you’re managing a small support team or overseeing enterprise-wide service operations, this dashboard provides an efficient and easy-to-use framework.
Click to Purchases Customer Service and Support Project Timeline KPI Dashboard in Excel
What is a Customer Service and Support Project Timeline KPI Dashboard?
A Customer Service and Support Project Timeline KPI Dashboard is an Excel-based performance monitoring tool designed to:
-
Track project timelines across service functions
-
Measure key performance indicators (KPIs) related to customer support
-
Compare current performance against monthly targets and previous years
-
Present real-time insights using conditional formatting and visual charts
It allows service managers to take data-driven decisions, ensure deadline adherence, and monitor service quality across different projects and timeframes.
Key Components of the Dashboard Template
The Excel template comes pre-built with 7 structured worksheet tabs, each serving a unique role in managing KPIs and timelines.
Home Sheet – Your Central Control Panel

The Home tab acts as the index page of the dashboard. It provides six quick-access buttons to jump directly to the relevant sheets, ensuring smooth navigation and a professional look and feel.
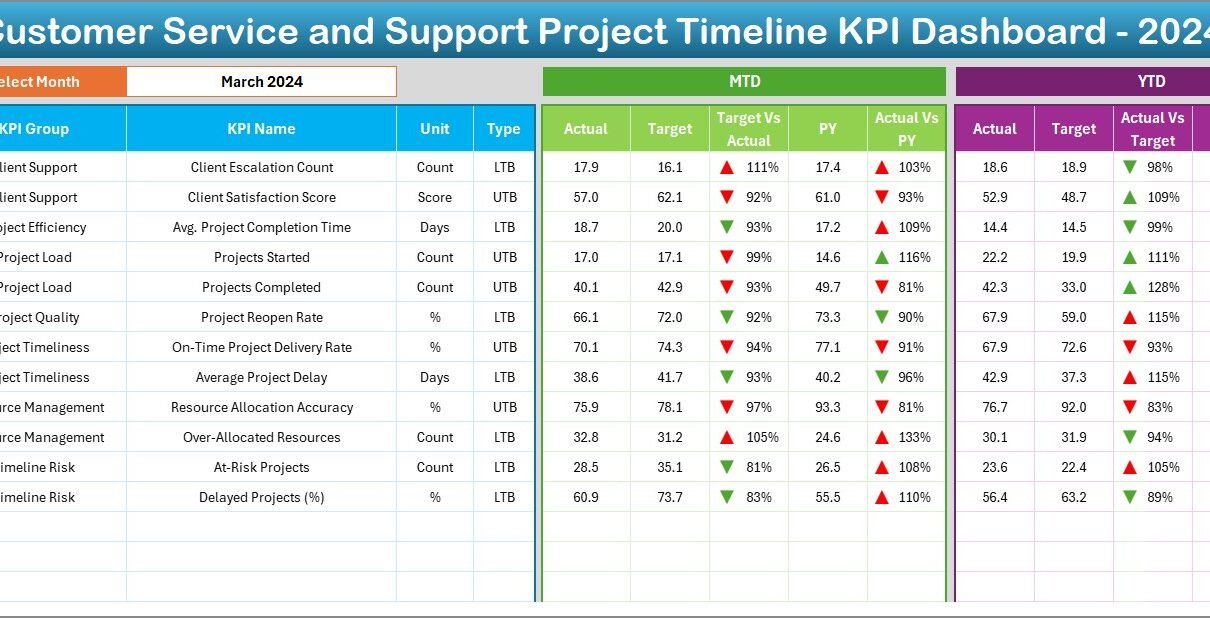
Dashboard Sheet – Real-Time KPI Overview
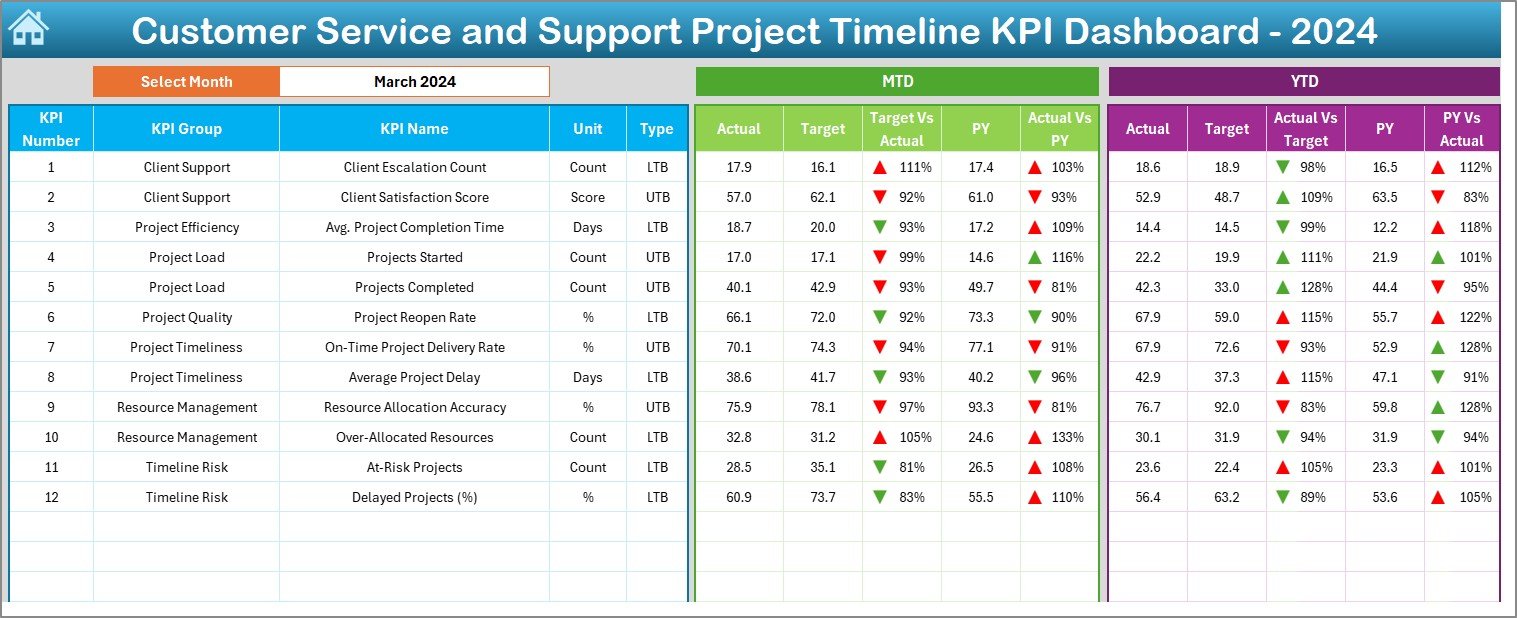
The Dashboard sheet is the heart of this system. It provides:
-
A drop-down month selector (Cell D3) to dynamically update the dashboard for a selected month
-
KPIs shown as MTD (Month-To-Date) and YTD (Year-To-Date) values
-
Instant comparison of Actual vs Target and Actual vs Previous Year
-
Conditional formatting arrows (up/down) to highlight performance trends
This sheet gives an executive snapshot of how the support function performs over time.
KPI Trend Sheet – In-Depth Performance Trends
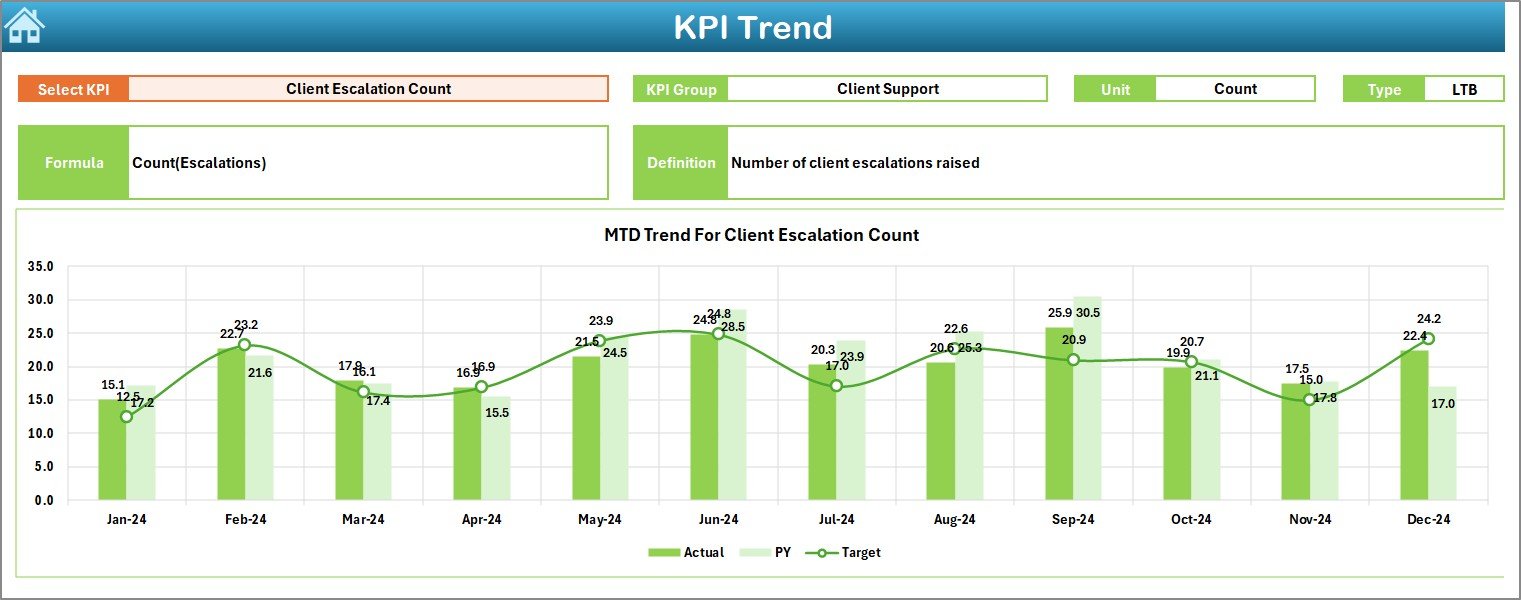
In the KPI Trend tab, users can:
-
Select a KPI using the dropdown in Cell C3
-
View KPI Group, Unit, Type (LTB or UTB), Formula, and Definition
-
Analyze line charts showing the trend of Actual vs Target vs Previous Year for both MTD and YTD
This is crucial for identifying seasonal trends and anomalies.
Actual Numbers Input Sheet – Feeding Real Data

This is where you input real performance figures. The control cell in E1 lets you define the start month of your fiscal or calendar year. Just enter monthly MTD and YTD numbers for each KPI—these automatically reflect in the dashboard and trend sheets.
Target Sheet – Setting Performance Goals

Here, you input monthly target values for both MTD and YTD across all KPIs. This sheet acts as a benchmark for performance evaluation, ensuring every KPI has a measurable goal.
Click to Purchases Customer Service and Support Project Timeline KPI Dashboard in Excel
Previous Year Number Sheet – Historical Benchmarking

This tab captures the previous year’s data. It’s essential for YoY (Year-over-Year) analysis, helping you see whether your performance is improving or declining.
KPI Definition Sheet – Master Data Reference

This sheet stores essential KPI metadata:
-
KPI Group
-
KPI Name
-
Unit of Measure
-
Formula
-
Brief Definition
-
Type (LTB – Lower the Better, UTB – Upper the Better)
This ensures that everyone on your team speaks the same data language.
Advantages of Using This Excel-Based KPI Dashboard
Let’s dive into why this tool is essential for any customer service and support department.
🔹 1. Centralized View of Project Timelines
-
No more scattered data across emails or spreadsheets
-
Everything is neatly organized and accessible
🔹 2. MTD and YTD Tracking
-
Keep track of short-term and long-term performance
-
Easily measure whether your goals are being met
🔹 3. Easy Historical Comparisons
-
Track progress versus last year
-
Identify performance dips and spikes
🔹 4. Automated Visual Cues
-
Conditional arrows instantly indicate if you’re above or below target
-
Makes analysis quick and actionable
🔹 5. Customizable and Scalable
-
Add new KPIs
-
Update units, formulas, and definitions without coding knowledge
How to Use This Dashboard Effectively?
Click to Purchases Customer Service and Support Project Timeline KPI Dashboard in Excel
Using the dashboard is very straightforward. Follow these steps:
-
Start at the Home Tab to navigate to different sheets.
-
In the KPI Definition Sheet, define all your KPIs, their groups, units, and types.
-
Move to the Target Sheet and enter your monthly target values.
-
Use the Previous Year Number Sheet to input last year’s data.
-
In the Actual Numbers Input Sheet, update your current MTD and YTD figures monthly.
-
Go to the Dashboard Sheet to see real-time performance.
-
Use the KPI Trend Sheet for deeper performance analysis and to spot patterns.
Best Practices for Using the KPI Dashboard
To get the most from your dashboard:
✅ Keep KPI Definitions Clear
Avoid complex formulas or vague descriptions
✅ Update Data Regularly
Make data input a monthly routine
✅ Use Conditional Formatting Wisely
Let visual cues guide decision-making
✅ Train Team Members
Ensure everyone knows how to read and use the dashboard
✅ Backup the File
Store versions in the cloud for easy recovery
✅ Review Trends Monthly
Don’t just rely on one month—look at moving averages
Why Excel is Still the Best Tool for Project Timeline Dashboards
You might wonder—why use Excel when there are hundreds of other tools? Here’s why:
✅ No learning curve – Everyone knows Excel
✅ Full control – Customize formulas, formats, and layouts
✅ Offline Access – No internet? No problem
✅ Data Privacy – Your data stays on your machine
Excel remains a go-to tool for small to mid-sized teams who need agility, simplicity, and cost-efficiency.
How This Dashboard Improves Customer Service Outcomes
When you use this dashboard consistently:
-
You reduce project delays
-
You improve communication with internal teams
-
You identify and resolve service bottlenecks
-
You enhance client satisfaction with timely delivery
-
You increase overall service team accountability
By aligning timelines with actual performance, this tool drives both efficiency and quality in service delivery.
Conclusion
The Customer Service and Support Project Timeline KPI Dashboard in Excel is more than a tracking tool—it’s a strategic enabler. It empowers teams to monitor what matters, react faster to deviations, and deliver excellence in every customer interaction.
With its simple yet powerful structure, this dashboard provides clarity, control, and consistency across all your service initiatives. Whether you’re in telecom, e-commerce, healthcare, or IT services, adopting this dashboard ensures your support operations are always aligned with business goals.
Frequently Asked Questions (FAQs)
❓1. Who should use this dashboard?
Answer: Customer service managers, support leads, business analysts, and project coordinators across any industry can use this dashboard to track performance and timelines.
❓2. Can I customize the KPIs?
Answer: Yes, the dashboard is fully editable in Excel. You can add, remove, or rename KPIs, change formulas, or adjust targets as needed.
❓3. Is the dashboard suitable for beginners?
Answer: Absolutely! It comes with predefined formulas, drop-downs, and visual indicators that make it easy for even non-technical users.
❓4. Does it support multi-year tracking?
Answer: Yes. By updating the sheets regularly and saving past data files, you can track progress over multiple years.
❓5. Can I share this with my team?
Answer: Yes, since it’s in Excel, you can easily email it or store it in shared drives like Google Drive or OneDrive for team collaboration.
❓6. Does this dashboard work on Mac?
Answer: Yes, as long as you have Microsoft Excel installed. However, ensure all formulas and conditional formatting render correctly on your version.
❓7. How often should I update the data?
Answer: Ideally, update the MTD and YTD numbers monthly, preferably in the first week of each new month to maintain data accuracy.
Visit our YouTube channel to learn step-by-step video tutorials