In today’s fast-evolving IT landscape, retaining skilled tech professionals is more critical than ever. High turnover not only disrupts project timelines but also increases hiring costs and drains team morale. So how can organizations keep a pulse on employee retention effectively?
That’s where an IT and Tech Employee Retention KPI Dashboard in Excel comes into play.
This comprehensive article will walk you through everything you need to know about building and using a Retention KPI Dashboard — from what it is, why it matters, its features, advantages, best practices, and even frequently asked questions. If you’re serious about tracking employee stability in the tech sector, keep reading!
Click to Purchases IT and Tech Employee Retention KPI Dashboard in Excel
What Is an IT and Tech Employee Retention KPI Dashboard?
An Employee Retention KPI Dashboard is a centralized tool that helps HR teams and managers track and visualize key performance indicators related to employee retention. These KPIs reflect workforce stability, identify potential risks of attrition, and highlight opportunities to improve engagement.
Specifically designed for the IT and tech industry, this dashboard focuses on metrics such as Turnover Rate, Retention Rate, Average Tenure, Cost of Attrition, and more.
Built in Microsoft Excel, this dashboard is easy to use, highly customizable, and ideal for companies that want to monitor retention performance without investing in complex HR software.
Key Features of the Retention KPI Dashboard in Excel
This ready-to-use Excel template includes 7 well-structured worksheets designed to simplify data entry, analysis, and visualization:
Home Sheet

-
Acts as the control center of the dashboard.
-
Includes six clickable buttons for easy navigation to each worksheet.
-
Provides a user-friendly interface, especially helpful for non-technical users.
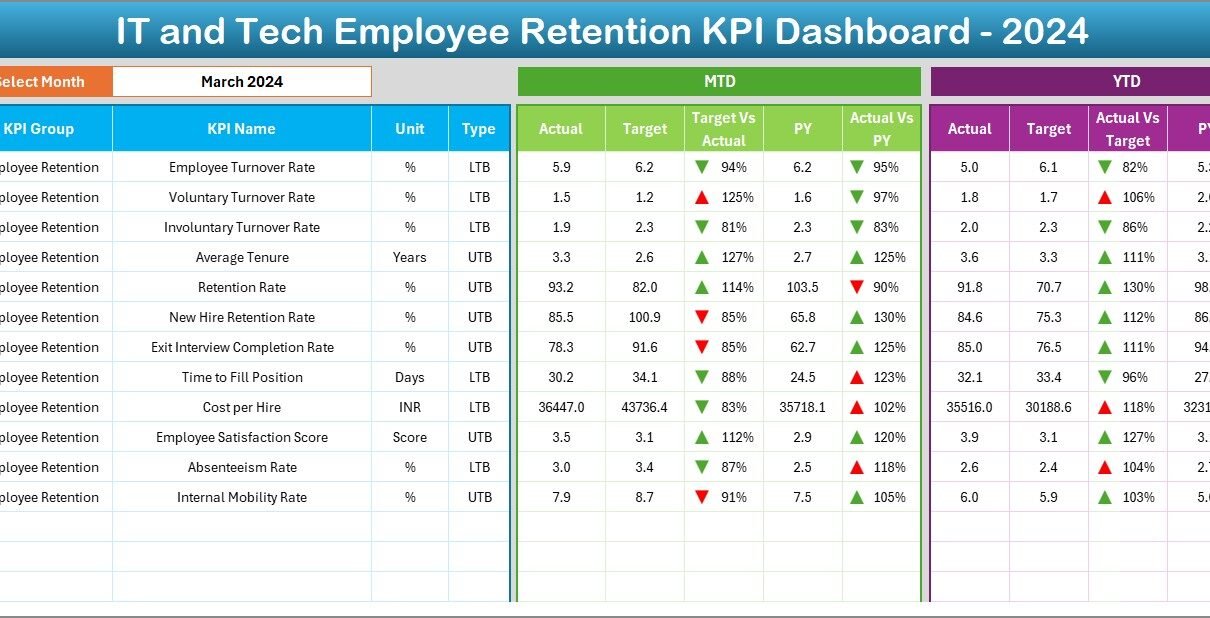
Dashboard Sheet

-
Displays all key metrics in one view.
-
Includes Month Selector (cell D3) for dynamic updates of monthly and yearly data.
Shows:
- MTD (Month-To-Date) Actual vs Target vs Previous Year
- YTD (Year-To-Date) Actual vs Target vs Previous Year
-
Uses conditional formatting with arrows to highlight positive or negative trends.
Click to Purchases IT and Tech Employee Retention KPI Dashboard in Excel
KPI Trend Sheet

-
Allows you to select any KPI from the drop-down in cell C3.
-
Displays detailed info: KPI Group, Unit, Formula, Type (LTB/UTB), and Definition.
-
Includes dynamic charts to visualize trends across MTD, YTD, and Previous Year.
Actual Numbers Input Sheet

-
Input monthly actuals for MTD and YTD performance.
-
Easily change the starting month (cell E1) to match your financial year.
-
Enables simple and flexible data entry without complex formulas.
Target Sheet

-
Store monthly targets for each KPI.
-
Separate fields for MTD and YTD ensure accurate comparisons.
Previous Year Numbers Sheet

-
Enter historical retention data.
-
Enables side-by-side comparisons with current performance.
KPI Definition Sheet

-
Clearly defines each KPI for transparency and consistency.
Includes:
- KPI Name
- KPI Group
- Unit of Measurement
- Formula
- Definition
- Type (Lower the Better or Upper the Better)
Why Is Employee Retention Important in IT and Tech?
Click to Purchases IT and Tech Employee Retention KPI Dashboard in Excel
The IT industry is highly competitive. Talented professionals often switch jobs for better pay, benefits, or growth opportunities. Tracking employee retention helps:
-
Reduce hiring and onboarding costs
-
Improve team morale and productivity
-
Predict and prevent workforce churn
-
Align talent strategies with business goals
Retention metrics also help HR teams identify which departments or job roles are most at risk and require immediate attention.
Advantages of Using This Excel Dashboard
Using this IT and Tech Employee Retention Dashboard offers several practical benefits:
✅ Centralized View of Retention Metrics
You don’t need to switch between reports or spreadsheets — everything is in one place.
📊 Real-Time Insights
Change the selected month to get instant updates across MTD and YTD comparisons.
⚙️ Easy Customization
Whether you want to add a new KPI or modify existing ones, it’s all doable with Excel.
💼 Ideal for HR and Managers
This tool empowers HR professionals and team leads to make faster, data-backed decisions.
🔁 Supports Year-on-Year Comparison
Visuals comparing current year with the previous year help spot long-term trends.
Best Practices for the Retention KPI Dashboard
To get the most out of your KPI dashboard, follow these best practices:
1. Update Monthly
Regular updates ensure your insights reflect the latest changes and allow early detection of red flags.
2. Use Clean and Accurate Data
Validate data before entry. Even small errors can skew your KPI trends.
3. Define KPIs Clearly
Use the KPI Definition tab to keep all stakeholders aligned on what each metric means.
4. Visualize Trends, Not Just Numbers
Use charts to understand patterns and predict future retention issues.
5. Set SMART Targets
Specific, Measurable, Achievable, Relevant, and Time-bound goals improve KPI tracking.
6. Monitor High-Risk Roles
Pay special attention to job roles with high turnover or those that are hard to fill.
7. Integrate Exit Interview Insights
Use qualitative data to enhance the interpretation of your dashboard metrics.
How to Customize the Dashboard for Your Organization
This dashboard is flexible enough to fit various IT business sizes, from startups to large enterprises. Here’s how you can personalize it:
-
Add new KPIs to reflect company-specific retention goals.
-
Modify dropdown options in the KPI Trend sheet to match your organizational structure.
-
Use Excel formulas to automate conditional formatting or alerts.
-
Change themes or color codes to match your branding.
If you’re working with international teams, you can also adjust the month/year format, currency, or language settings.
How to Maintain and Share the Dashboard
Once your dashboard is up and running:
-
Save monthly versions for historical tracking.
-
Share as PDF for stakeholders who prefer static formats.
-
Use Excel’s protection features to prevent unauthorized edits.
-
Back up your file regularly to avoid data loss.
Conclusion
In the IT and tech sector, where demand for talent is sky-high, employee retention is not just an HR metric — it’s a strategic priority. An Employee Retention KPI Dashboard in Excel helps you keep track of what really matters. You gain visibility into trends, improve decision-making, and ultimately retain top talent more effectively.
Whether you’re a team lead, HR professional, or C-suite executive, this dashboard offers the insights you need — all in one place, without any complex software.
Frequently Asked Questions (FAQs)
1. What is an Employee Retention KPI?
An Employee Retention KPI is a metric that measures how well an organization retains its staff. It includes indicators like Turnover Rate, Average Tenure, and Promotion Rate.
2. Why use Excel for the KPI Dashboard?
Excel offers flexibility, ease of use, and does not require any advanced software skills. It allows organizations to track and visualize retention data effectively without additional costs.
3. Can I customize this template for my company?
Yes, the template is fully customizable. You can add new KPIs, change formats, update formulas, and redesign visuals to match your organizational needs.
4. How often should I update the dashboard?
It is recommended to update the dashboard once a month to ensure the accuracy of your metrics and enable proactive decision-making.
5. What types of KPIs are included in this dashboard?
The dashboard includes metrics like Turnover Rate, Retention Rate, Average Employee Tenure, New Hire Retention, and more.
6. Is this template suitable for small tech startups?
Absolutely! The dashboard is designed to be scalable. Whether you’re a team of 10 or 1000, you can easily adapt it to your size.
7. What does LTB and UTB mean in the dashboard?
LTB stands for “Lower The Better” (e.g., Turnover Rate), while UTB means “Upper The Better” (e.g., Retention Rate or Promotion Rate).
Visit our YouTube channel to learn step-by-step video tutorials
Click to Purchases IT and Tech Employee Retention KPI Dashboard in Excel