Managing leases without clear visibility often creates confusion, financial leakage, and compliance risks. Many organizations still rely on scattered spreadsheets, emails, and manual calculations to track lease costs, renewals, and performance. As a result, decision-making becomes slow, inaccurate, and reactive.
That is exactly why a Lease Management KPI Dashboard in Excel becomes an essential tool for modern businesses.
In this detailed and easy-to-understand article, you will learn what a Lease Management KPI Dashboard in Excel is, why it is important, how it works, its page-wise structure, key features, advantages, best practices, and frequently asked questions. Moreover, the language stays simple, practical, and business-focused throughout.
Click to buy Lease Management KPI Dashboard in Excel
What Is a Lease Management KPI Dashboard in Excel?
A Lease Management KPI Dashboard in Excel is a centralized, interactive reporting tool designed to track, monitor, and analyze all critical lease-related performance indicators from a single Excel file.
Instead of managing multiple lease registers and reports, this dashboard brings everything together in one structured view. Therefore, lease managers, finance teams, accountants, and decision-makers gain full visibility into lease performance at both monthly (MTD) and year-to-date (YTD) levels.
What Does This Dashboard Help You Track?
This dashboard helps organizations monitor:
- Lease costs and expenses
- Target vs Actual lease performance
- Previous Year vs Current Year comparisons
- Month-wise and year-wise lease trends
- KPI-level performance signals
- Lease efficiency and cost control
Because the dashboard runs entirely in Excel, it offers flexibility, affordability, and zero dependency on expensive lease management software.
Why Do Organizations Need a Lease Management KPI Dashboard?
Lease portfolios grow complex as businesses expand across locations, assets, and contracts. However, without structured reporting, organizations often miss critical insights.
Here is why a Lease Management KPI Dashboard in Excel becomes crucial:
- Lease costs increase without early warning signs
- Renewals and escalations go unnoticed
- Performance tracking stays inconsistent
- Compliance monitoring becomes difficult
- Reporting takes too much manual effort
On the other hand, a centralized KPI dashboard solves these challenges by providing clarity, control, and confidence.
How Does a Lease Management KPI Dashboard in Excel Work?
The dashboard works on a simple yet powerful logic.
First, you define all lease-related KPIs. Then, you input Actual, Target, and Previous Year numbers. After that, the dashboard automatically calculates variances, trends, and performance indicators.
Because everything links dynamically, selecting a month instantly updates the entire dashboard.
As a result, you always see the latest and most relevant information.
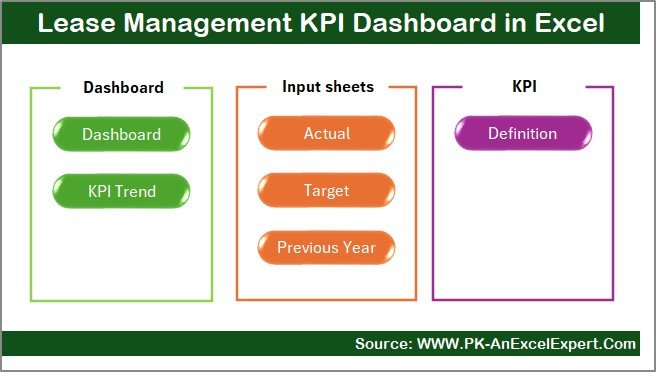
Page-Wise Structure of the Lease Management KPI Dashboard in Excel
This dashboard contains 7 well-structured worksheets, each designed for a specific purpose. Let us understand each sheet in detail.
Summary Page – How Does the Navigation Work?
The Summary Page works as the index of the dashboard.
Key Highlights of the Summary Page
- Clean and professional layout
- 6 navigation buttons for easy movement
- One-click access to all major sheets
- User-friendly design for non-technical users
Because of this page, users never feel lost while navigating the dashboard. Instead, they jump directly to the required analysis section.
Click to buy Lease Management KPI Dashboard in Excel
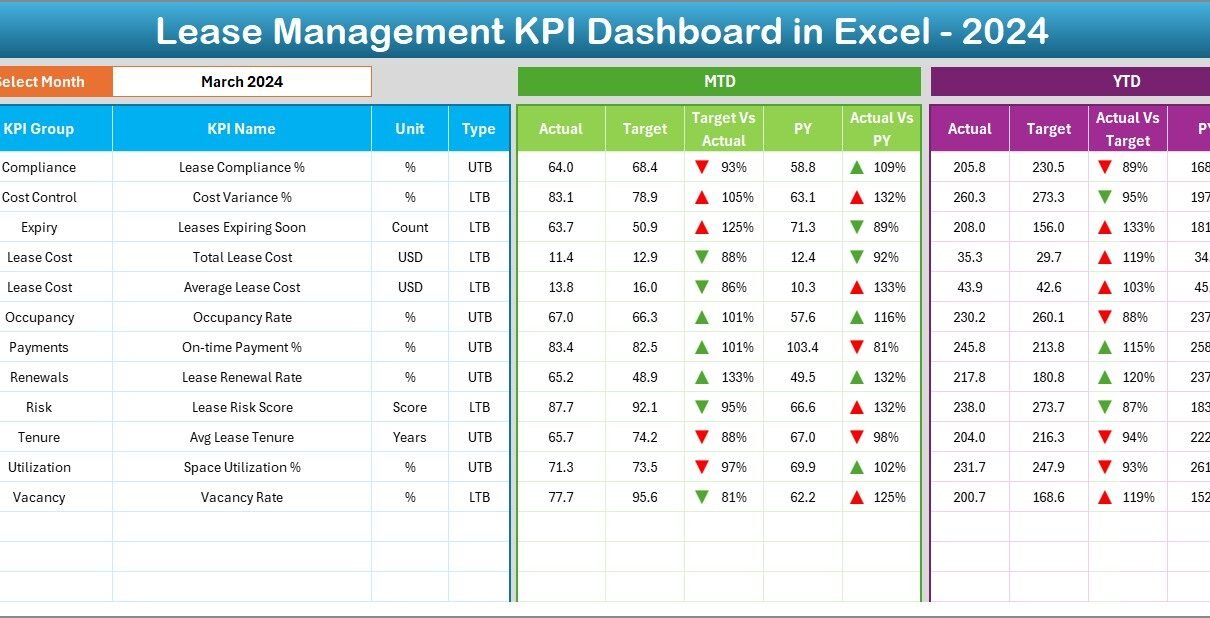
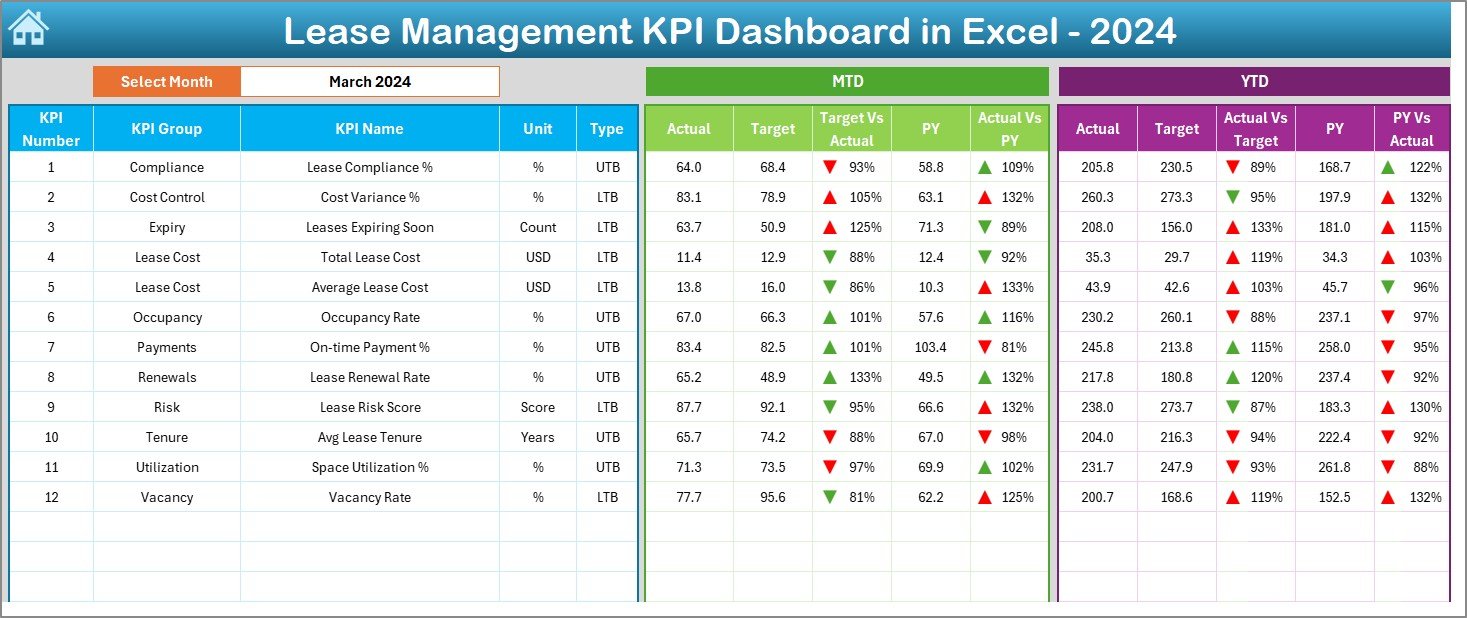
Dashboard Sheet – What Information Does the Main Dashboard Show?
The Dashboard sheet is the heart of the Lease Management KPI Dashboard in Excel.
Month Selector for Dynamic Reporting
- A Month dropdown is available at cell D3
- Selecting a month updates the entire dashboard instantly
- No manual recalculation required
Click to buy Lease Management KPI Dashboard in Excel
KPIs Displayed on the Dashboard
This sheet displays:
MTD (Month-to-Date) Section
- Actual
- Target
- Previous Year
- Target vs Actual variance
- PY vs Actual variance
YTD (Year-to-Date) Section
- Actual
- Target
- Previous Year
- Target vs Actual variance
- PY vs Actual variance
Visual Performance Indicators
- Up and down arrows using conditional formatting
- Instant identification of good or poor performance
- Clear signals for management review
Because of this structure, decision-makers quickly understand where leases perform well and where action is required.
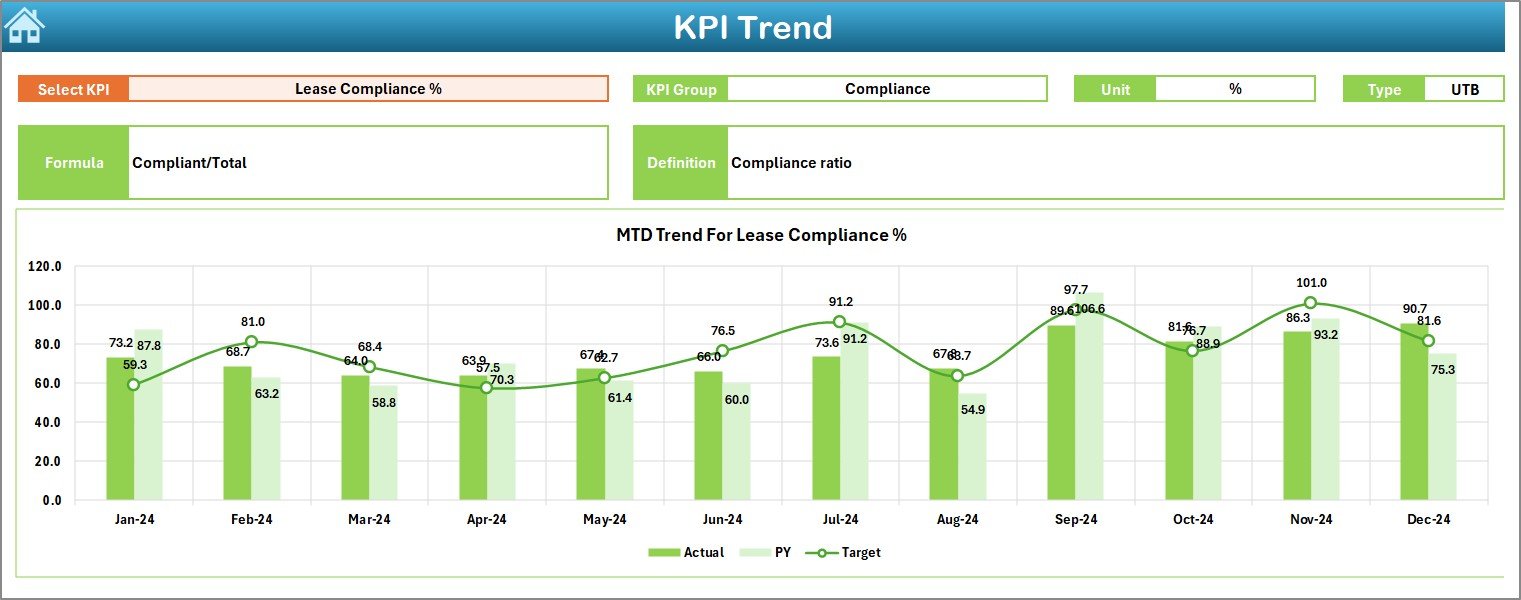
Trend Sheet – How Can You Analyze KPI Performance Over Time?
The Trend sheet focuses on deep analysis of individual KPIs.
KPI Selector for Detailed Analysis
- Select KPI name from dropdown at cell C3
- Automatically displays related KPI details
KPI Information Displayed
For the selected KPI, the sheet shows:
- KPI Group
- Unit of measurement
- KPI Type (Lower the Better or Upper the Better)
- KPI Formula
- KPI Definition
Trend Charts for Better Insights
- MTD trend chart for Actual, Target, and Previous Year
- YTD trend chart for Actual, Target, and Previous Year
Because of these trends, users easily identify patterns, improvements, or risks across months.
Click to buy Lease Management KPI Dashboard in Excel
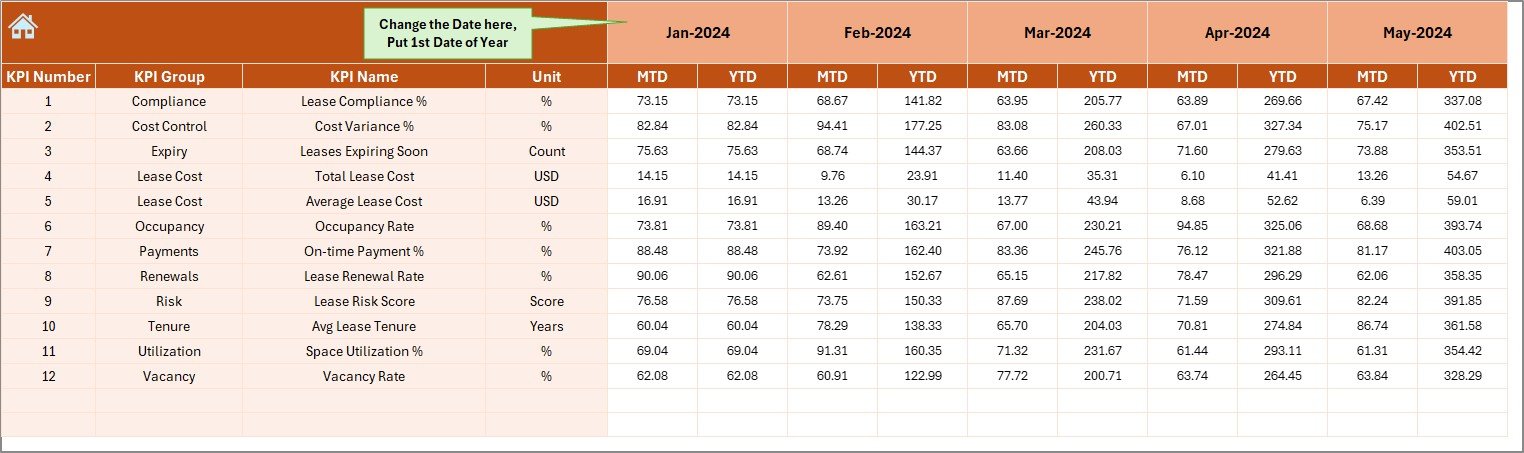
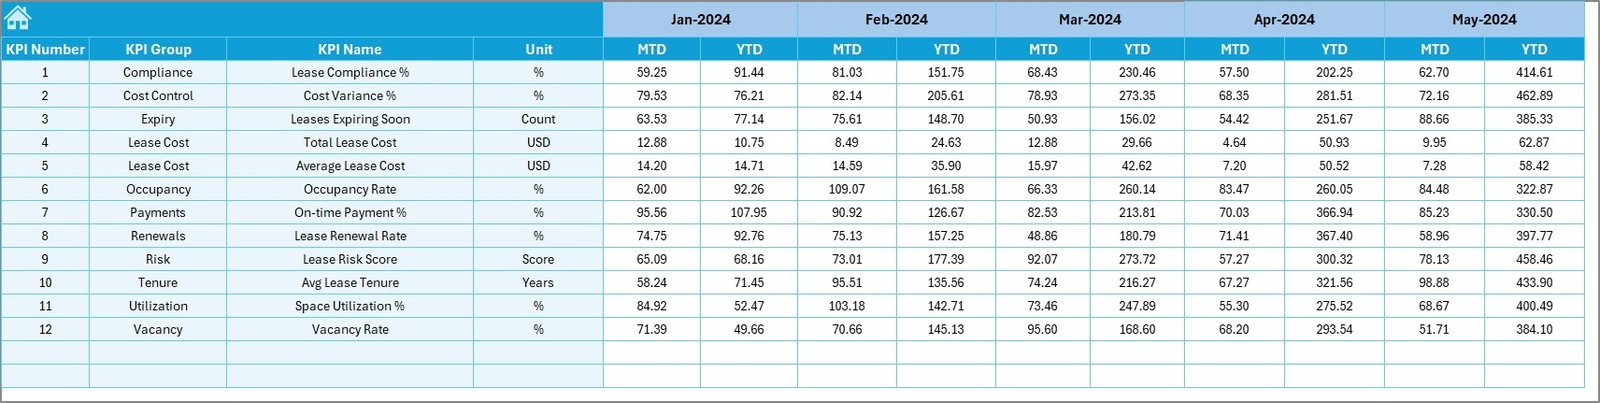
Actual Numbers Input Sheet – Where Do You Enter Actual Data?
The Actual Numbers Input sheet is where you enter real performance data.
How Does This Sheet Work?
- Select the starting month of the year in cell E1
- Enter MTD and YTD Actual numbers for each KPI
- Month-wise structure ensures consistency
Because this sheet feeds the entire dashboard, accurate data entry ensures reliable insights.
Click to buy Lease Management KPI Dashboard in Excel
Target Sheet – How Do You Define Performance Goals?
The Target sheet tab captures performance expectations.
What Data Do You Enter Here?
- Monthly MTD targets for each KPI
- YTD targets for cumulative performance
By comparing targets with actuals, the dashboard highlights gaps and achievements clearly.
Click to buy Lease Management KPI Dashboard in Excel
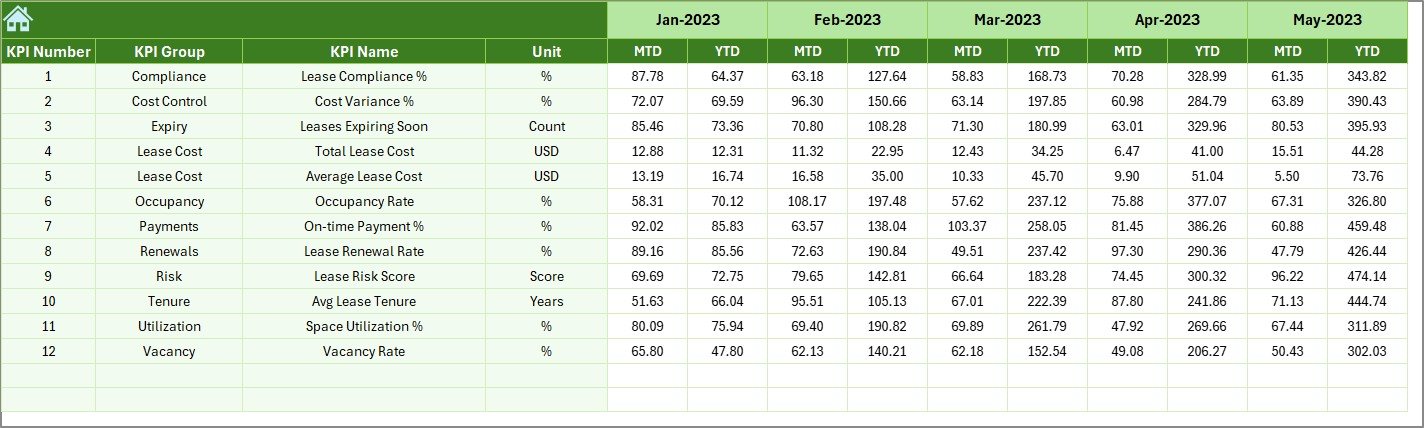
Previous Year Number Sheet – Why Is Historical Comparison Important?
The Previous Year Number sheet stores last year’s data.
Benefits of This Sheet
- Enables year-over-year analysis
- Identifies improvement or decline
- Helps set realistic future targets
Because this sheet mirrors the structure of the current year, comparisons remain consistent and meaningful.
Click to buy Lease Management KPI Dashboard in Excel
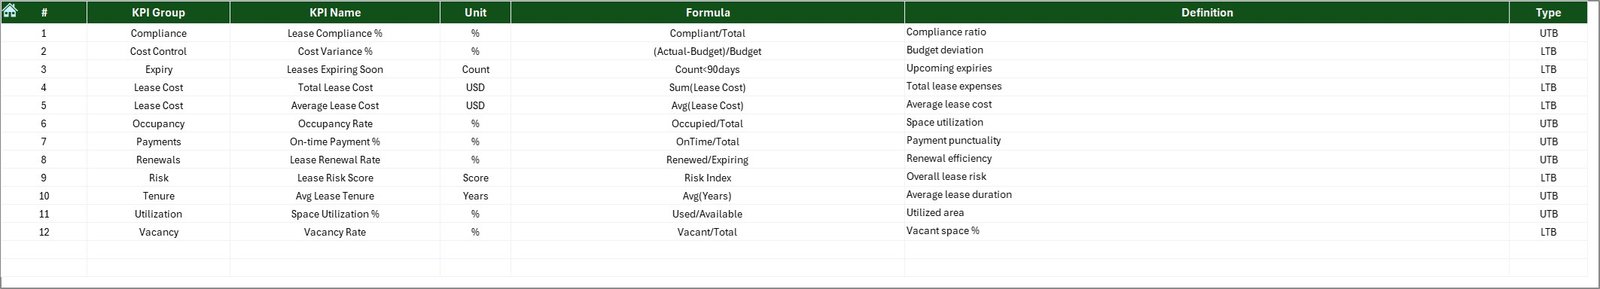
KPI Definition Sheet – How Do You Customize KPIs?
The KPI Definition sheet allows full customization.
Information Captured in This Sheet
- KPI Name
- KPI Group
- Unit
- KPI Formula
- KPI Definition
Because of this flexibility, the dashboard adapts easily to different industries, lease types, and business needs.
Click to buy Lease Management KPI Dashboard in Excel
What Are the Key Features of a Lease Management KPI Dashboard
in Excel?
This dashboard includes several powerful features that improve lease monitoring.
Key Features at a Glance
- Fully dynamic month selection
- MTD and YTD performance tracking
- Target vs Actual comparison
- Previous Year vs Actual comparison
- Conditional formatting with arrows
- Dedicated trend analysis
- Centralized KPI definitions
- Easy data input sheets
- No coding required
- 100% Excel-based solution
Advantages of a Lease Management KPI Dashboard in Excel
Now let us explore why organizations prefer this dashboard.
- Complete Visibility in One Place
The dashboard consolidates all lease KPIs into one view. Therefore, users no longer search across multiple files.
- Faster and Better Decision-Making
Because insights update instantly, managers act quickly and confidently.
- Cost Control and Risk Reduction
Tracking variances helps identify cost overruns early. As a result, organizations prevent financial leakage.
- Easy Customization
Users modify KPIs, targets, and definitions without technical skills.
- No Expensive Software Needed
Excel eliminates the need for costly lease management tools.
- Improved Accountability
Clear targets and trends improve ownership and accountability across teams.
Who Can Use a Lease Management KPI Dashboard in Excel?
This dashboard benefits multiple roles.
Ideal Users Include:
- Lease Managers
- Finance Teams
- Accounts Departments
- Real Estate Teams
- Facility Managers
- Business Owners
- Senior Management
Because of its simplicity, both technical and non-technical users use it comfortably.
Best Practices for the Lease Management KPI Dashboard in Excel
- To get maximum value, follow these best practices.
- Define KPIs Clearly
- Always use clear definitions and formulas. This avoids confusion later.
- Maintain Consistent Data Entry
- Update actual, target, and previous year data regularly.
- Review Trends Monthly
- Monthly trend reviews help detect issues early.
- Use Targets Realistically
- Set achievable targets based on historical performance.
- Validate Data Before Review Meetings
- Always double-check inputs to ensure accurate insights.
- Customize KPI Groups by Lease Type
- Group KPIs based on property, asset, or lease category.
- How Does This Dashboard Support Strategic Lease Planning?
This dashboard supports strategy in multiple ways.
- Identifies high-cost leases
- Highlights underperforming assets
- Supports renegotiation decisions
- Improves budgeting accuracy
- Strengthens compliance monitoring
As a result, organizations move from reactive management to proactive planning.
What Makes Excel a Powerful Platform for Lease Dashboards?
Excel remains a preferred tool because:
- It offers universal availability
- It supports powerful formulas and charts
- It allows easy customization
- It integrates with other data sources
- It requires no IT dependency
Therefore, Excel dashboards remain practical and scalable.
Conclusion: Why Should You Use a Lease Management KPI Dashboard in Excel?
A Lease Management KPI Dashboard in Excel transforms raw lease data into meaningful insights. Instead of manual reporting and guesswork, organizations gain clarity, control, and confidence.
With structured worksheets, dynamic analysis, and visual indicators, this dashboard simplifies lease monitoring and strengthens decision-making. Most importantly, it grows with your business and adapts to changing requirements.
If you manage leases and want better visibility, this dashboard becomes a smart and cost-effective solution.
Frequently Asked Questions (FAQs)
- What is the main purpose of a Lease Management KPI Dashboard in Excel?
The main purpose is to track, analyze, and monitor lease performance using structured KPIs in one Excel file.
- Can I customize KPIs in this dashboard?
Yes, you can fully customize KPIs, formulas, units, and definitions using the KPI Definition sheet.
- Does the dashboard support MTD and YTD analysis?
Yes, it supports both Month-to-Date and Year-to-Date analysis with comparisons.
- Do I need advanced Excel skills to use this dashboard?
No, basic Excel knowledge is sufficient to use and update the dashboard.
- Can this dashboard replace lease management software?
For many small to mid-sized organizations, yes. It provides strong reporting without software costs.
- How often should I update the data?
You should update actual and target data monthly for accurate insights.
- Is this dashboard suitable for multiple lease types?
Yes, you can group KPIs by lease type, property, or asset category.
Visit our YouTube channel to learn step-by-step video tutorials
Watch the step-by-step video tutorial:
Click to buy Lease Management KPI Dashboard in Excel