In today’s dynamic financial landscape, microfinance institutions (MFIs) must stay agile, data-driven, and performance-focused. Managing risk, increasing outreach, improving recovery rates, and ensuring financial sustainability all depend on real-time insights. That’s where the Microfinance KPI Dashboard in Power BI steps in as a game-changer.
This article explores everything you need to know about this ready-to-use dashboard—from key features to advantages, best practices, and frequently asked questions. Whether you are a credit officer, MFI manager, or data analyst, this tool will help you align strategy with execution.
Click to Purchases Microfinance KPI Dashboard in Power BI
What Is the Microfinance KPI Dashboard in Power BI?
The Microfinance KPI Dashboard in Power BI is an interactive, plug-and-play analytics tool designed to monitor and evaluate performance across microfinance operations. Built with Power BI and backed by Excel data, it offers a seamless way to track monthly and yearly KPIs, enabling informed decisions at every level.
Unlike complex BI platforms, this dashboard is easy to use and requires no coding. It connects directly to a structured Excel file, making updates fast and efficient.
Key Features of the Dashboard
The dashboard is structured into three insightful pages, each offering a unique perspective on your data:
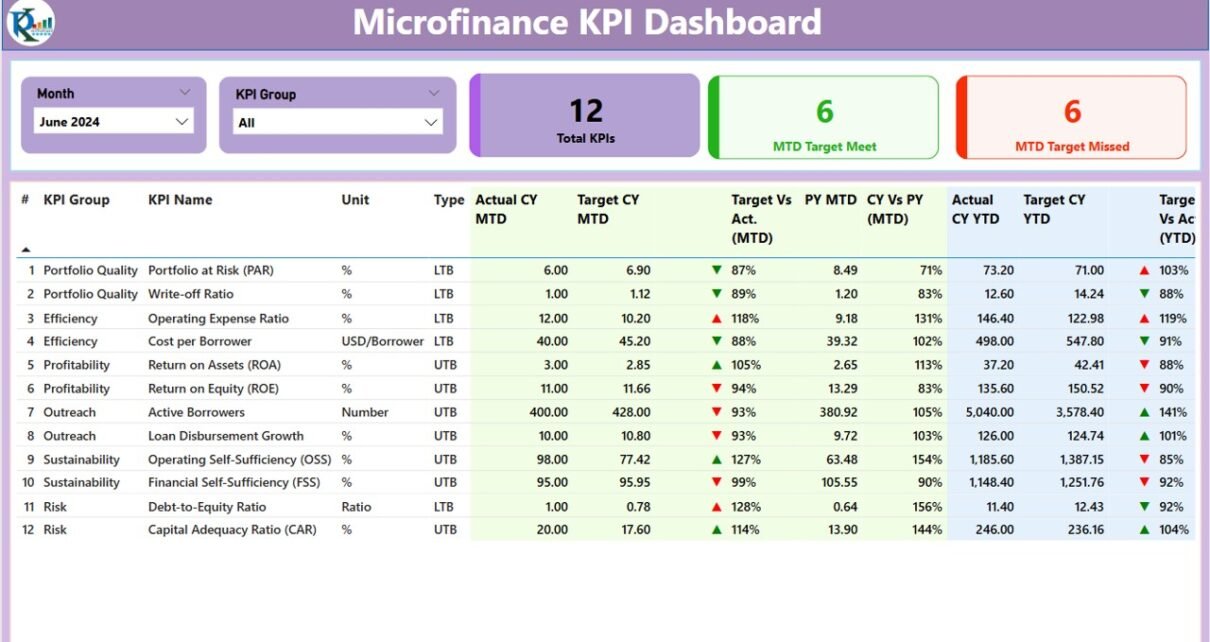
Summary Page – Your Performance Overview
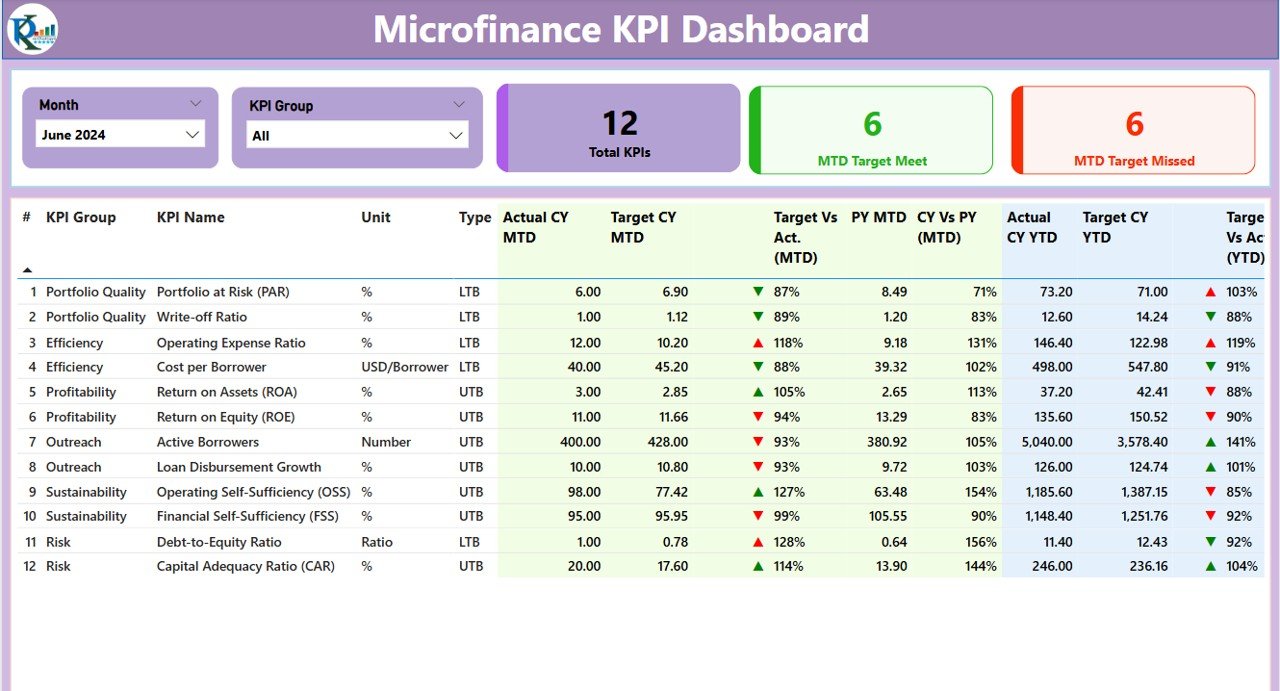
This is the central hub of the dashboard. At the top, you can filter data using Month and KPI Group slicers. You’ll also find 3 KPI summary cards displaying:
- Total KPIs Tracked
- MTD (Month-to-Date) KPIs Meeting Targets
- MTD KPIs Missing Targets
Below that, a detailed table presents the following:
- KPI Number (auto-sequenced)
- KPI Group (e.g., Portfolio, Risk, Operational)
- KPI Name (such as Loan Disbursement or Recovery Rate)
- Unit of Measurement (%, count, days, etc.)
- KPI Type (UTB: Upper the Better, LTB: Lower the Better)
- Actual CY MTD and Target CY MTD
- MTD Icon (⬇️ / ⬆️ in red/green to show performance)
- MTD Target vs Actual %
- Previous Year MTD and CY vs PY MTD %
- Actual CY YTD, Target CY YTD
- YTD Icon and YTD Target vs Actual %
- Previous Year YTD and CY vs PY YTD %
This structure ensures quick performance reviews and easy tracking of KPI trends.
KPI Trend Page – Visualizing the Journey
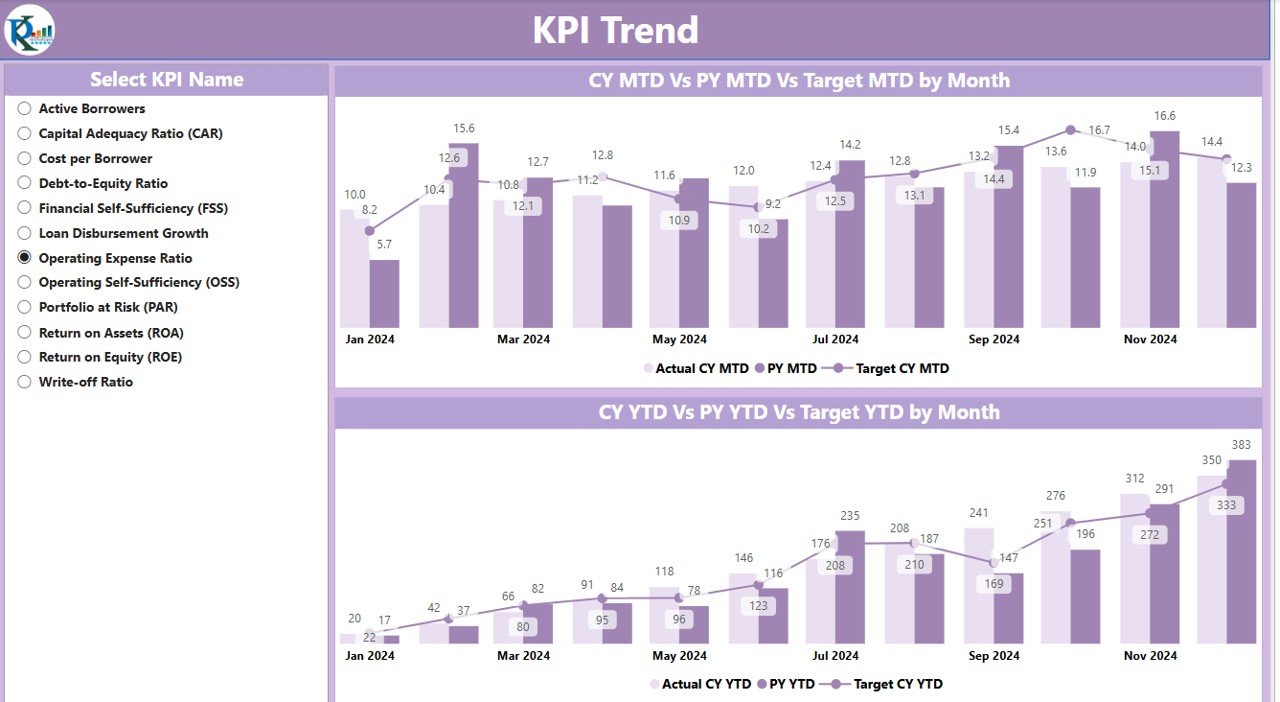
This page includes two combo charts to visualize:
- MTD: Current Year vs Previous Year vs Target
- YTD: Current Year vs Previous Year vs Target
Use the slicer to select any KPI and instantly see its historical and real-time performance.
KPI Definition Page – Know What You’re Measuring
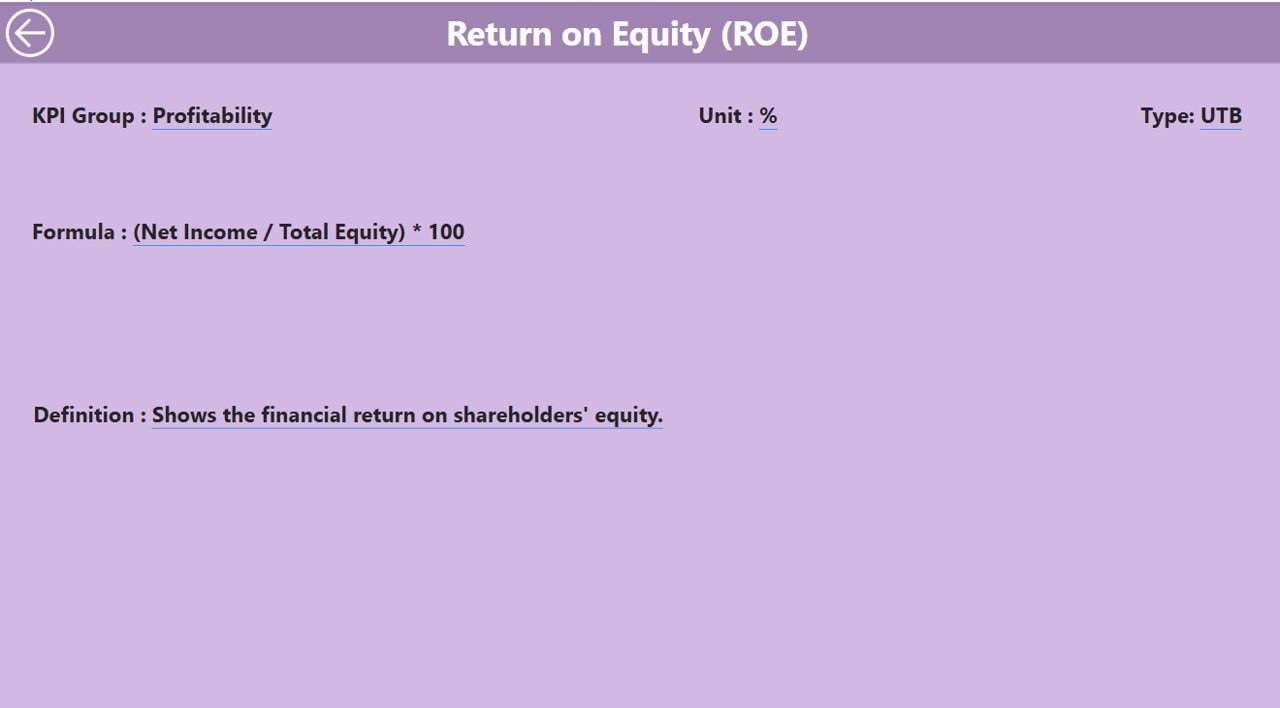
This is a hidden drill-through page designed for deeper understanding. From the summary table, right-click any KPI and view its:
- Formula
- Full Definition
- Unit and Type (UTB/LTB)
To return, just click the back button on the top left.
Excel as the Data Source
The dashboard is powered by an Excel file with three key worksheets:
Click to Purchases Microfinance KPI Dashboard in Power BI
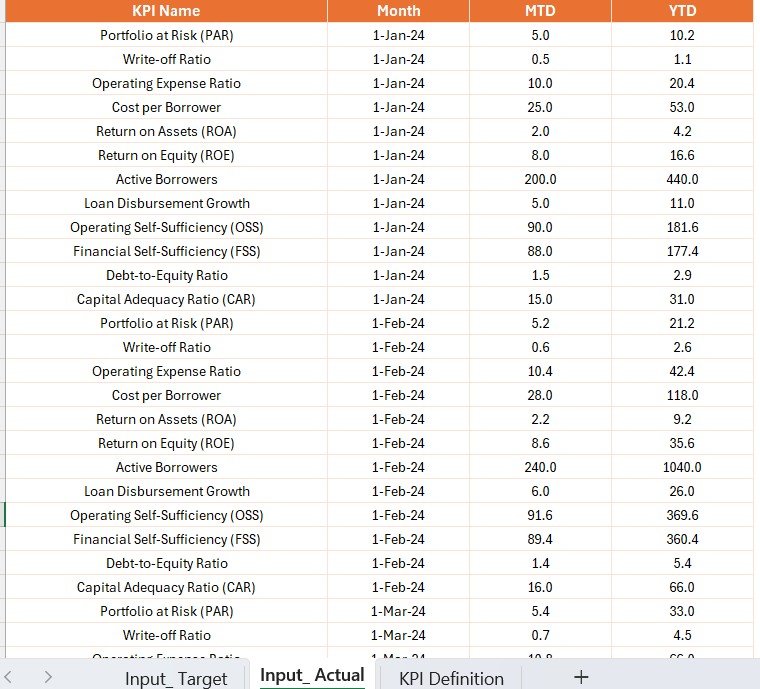
1. Input_Actual Sheet
- Fill in Actual KPI data by Month (use the 1st day of the month)
- Input MTD and YTD numbers for each KPI
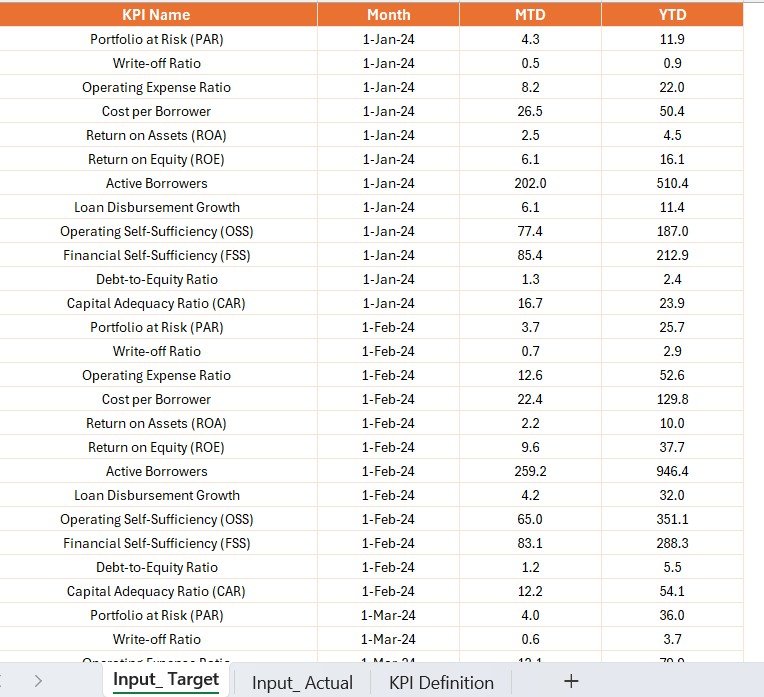
2. Input_Target Sheet
- Input Target values for each KPI and period
- Use the same month format (first day of the month)
3. KPI Definition Sheet
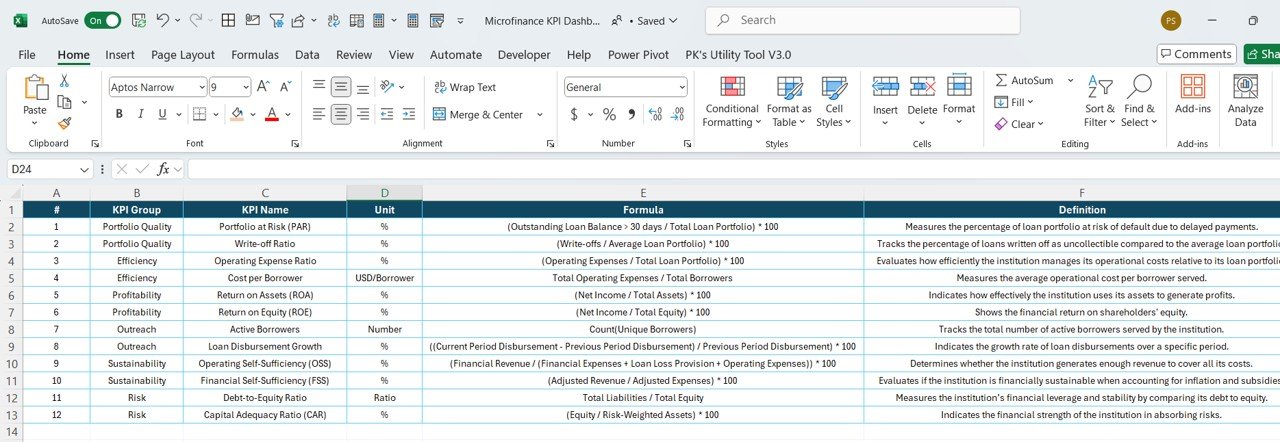
- Define each KPI: Number, Group, Name, Unit, Formula, Definition, and Type (UTB/LTB)
Advantages of the Microfinance KPI Dashboard
This dashboard goes beyond traditional spreadsheets. Here’s why it stands out:
🔄 Real-Time Performance Tracking: Monitor MTD/YTD numbers instantly
🌐 Excel Integration: Simple to update, no technical skills needed
🔄 Interactive Visuals: Use slicers and charts for dynamic exploration
📈 KPI Comparisons: Evaluate performance vs target and previous year
🔜 Clarity & Transparency: Track accountability across departments
📆 Time-Saving: Automated calculations and visual indicators
Click to Purchases Microfinance KPI Dashboard in Power BI
Best Practices for Using the Dashboard
To make the most of your dashboard:
🔺 Update the Excel File Monthly: Keep input sheets current
🤝 Involve Stakeholders: Use it in regular performance reviews
🔄 Focus on Key KPIs: Don’t overload the dashboard
📊 Use Trends for Action: Adjust strategy based on trend charts
🌟 Keep Definitions Clear: Ensure all team members understand KPIs
Frequently Asked Questions (FAQs)
1. Can I customize the KPIs tracked in this dashboard?
Yes! Just update the Excel KPI Definition sheet and refresh your Power BI file.
2. Do I need Power BI Pro to use this dashboard?
No. You can use it on Power BI Desktop. However, Pro is needed for cloud sharing.
3. Is this dashboard only for microfinance institutions?
No. While tailored for MFIs, any financial organization can adapt it with minimal changes.
4. How often should I update the data?
Ideally, every month. You can also update more frequently for real-time monitoring.
5. What skills do I need to manage this dashboard?
Basic Excel and Power BI knowledge are enough. No advanced coding required.
Conclusion
The Microfinance KPI Dashboard in Power BI offers a powerful, intuitive way to manage performance, monitor risk, and drive smarter growth. With seamless Excel integration and real-time visual tracking, this tool turns numbers into strategy.
In a competitive and regulation-heavy environment like microfinance, timely and accurate performance monitoring isn’t optional—it’s essential. So if you’re ready to streamline your reporting, empower your team, and elevate your decision-making, this dashboard is the solution you need.
Click to Purchases Microfinance KPI Dashboard in Power BI
Visit our YouTube channel to learn step-by-step video tutorials