Managing maintenance tasks in a busy office environment can quickly get out of hand if not tracked properly. That’s where an Office Maintenance Dashboard in Excel comes in handy. This dashboard simplifies task tracking, cost analysis, and time monitoring, all within a powerful yet user-friendly Excel interface.
In this article, we’ll walk you through everything you need to know about the Office Maintenance Dashboard in Excel, including its features, advantages, best practices, and frequently asked questions.
Click to Purchases Office Maintenance Dashboard in Excel
What is the Office Maintenance Dashboard in Excel?
The Office Maintenance Dashboard in Excel is a ready-to-use template designed to monitor and analyze all maintenance-related activities in an office setting. This tool helps facilities managers, admin staff, and HR teams to keep track of maintenance requests, costs, priority levels, resolution timelines, and more — all from one centralized location.
This dashboard includes five interactive pages and two supporting sheets. You can easily navigate through the dashboard, identify trends, and take action based on data-driven insights.
Key Features of the Office Maintenance Dashboard
Let’s explore the dashboard page by page to understand what each one offers:
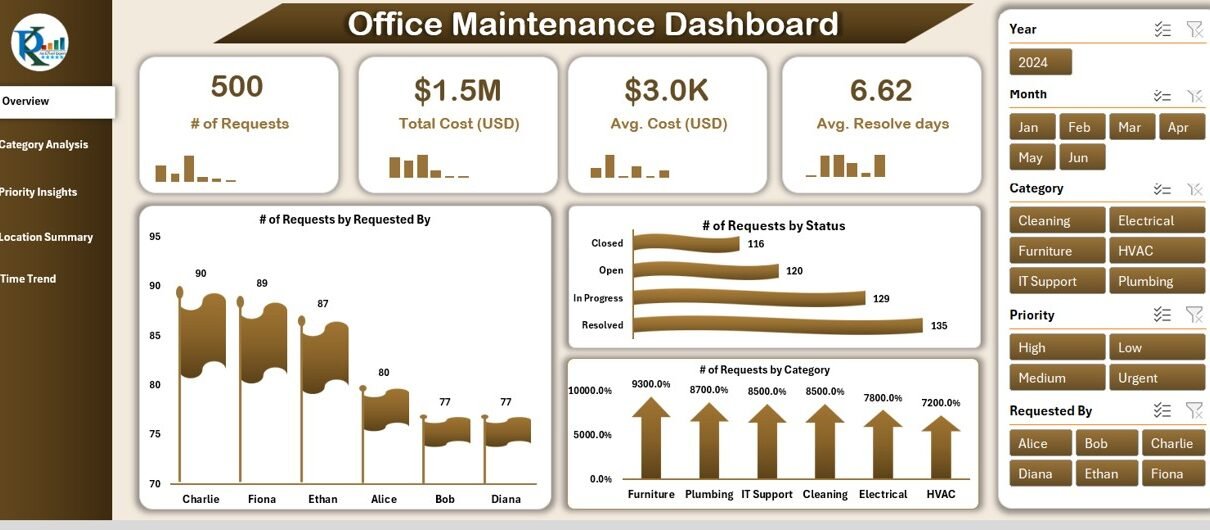
Overview Page
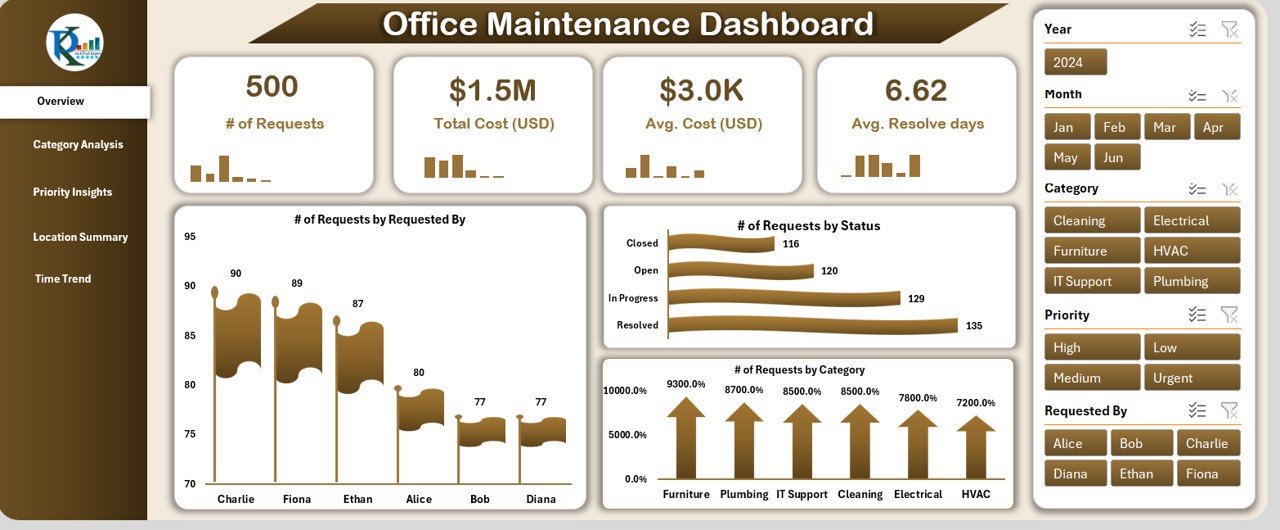
This is the main landing page of the dashboard.
- Slicers on the right-hand side allow you to filter data by category, location, or status.
- Cards show KPIs such as Total Requests, Completed Requests, Pending Requests, and Average Resolution Time.
Charts display:
- Number of Requests by “Requested By”
- Number of Requests by Status
- Number of Requests by Category
Category Level Analysis

Dive deeper into maintenance categories.
- Filter using slicers for a custom view.
Click to Purchases Office Maintenance Dashboard in Excel
Charts include:
- Total Cost (USD) by Category
- Average Cost (USD) by Category
- Average Time to Resolve (Days) by Category
Priority-Based Insights
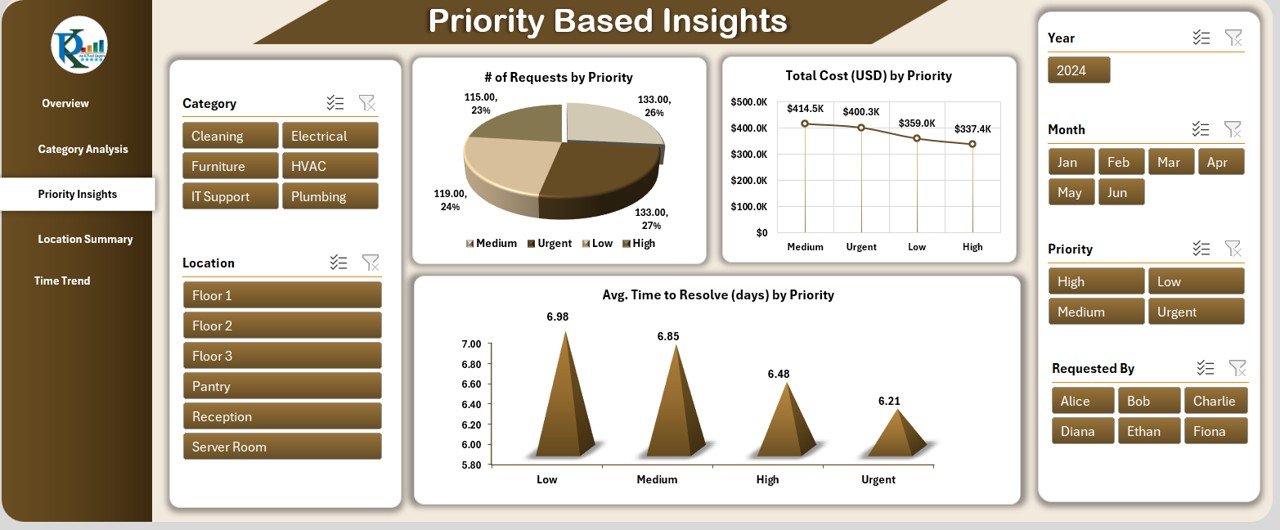
Understand which requests are urgent and how they’re handled.
View charts on:
- Number of Requests by Priority
- Total Cost (USD) by Priority
- Average Time to Resolve (Days) by Priority
Location Summary
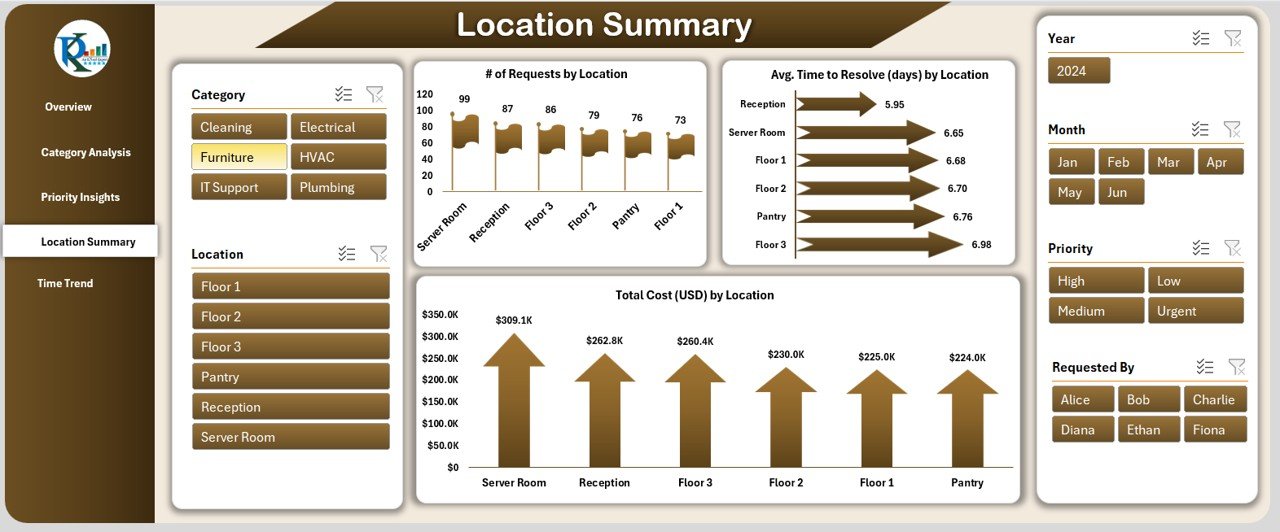
Track where requests are coming from and which locations are cost-intensive.
Charts include:
- Number of Requests by Location
- Average Time to Resolve (Days) by Location
- Total Cost (USD) by Location
Time Trend

Visualize performance over time to identify peaks and bottlenecks.
Charts include:
- Total Cost (USD) by Month
- Average Time to Resolve (Days) by Month
Supporting Sheets
Data Sheet:
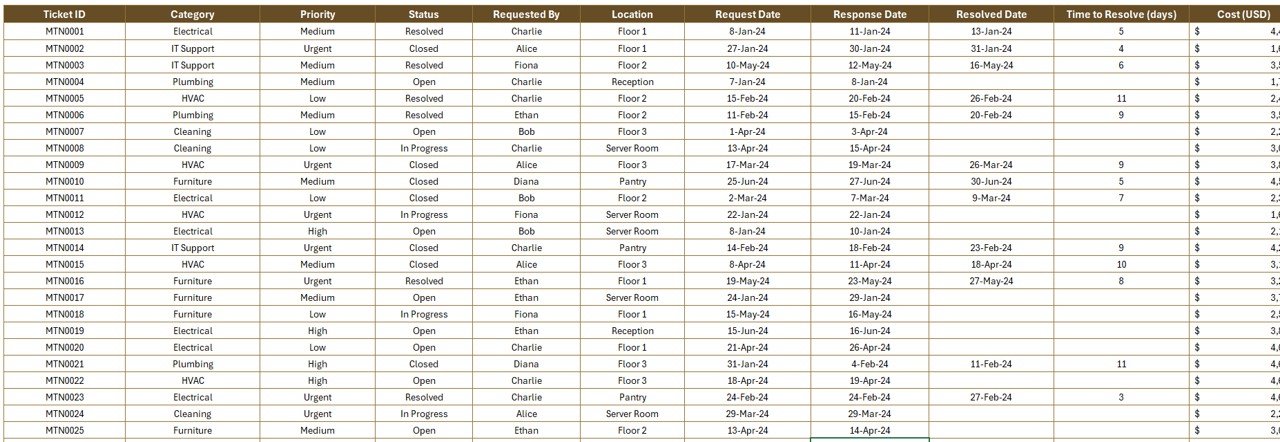
Stores all raw data, including Ticket ID, Category, Priority, Status, Requested By, Location, Request Date, Response Date, Resolved Date, Time to Resolve (days), Cost (USD), Month, and Year.
Support Sheet:
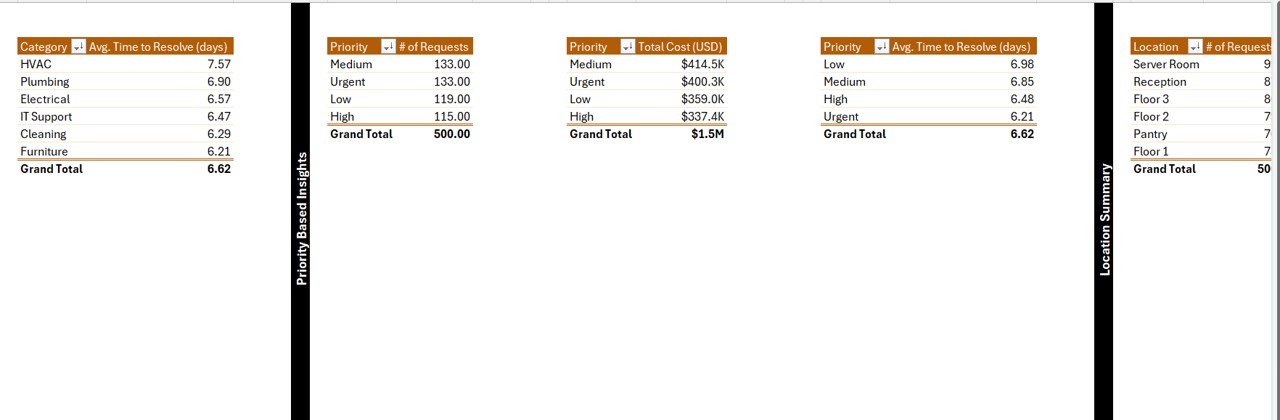
Contains reference lists such as categories, priorities, and locations to enable drop-down selections.
Why Should You Use an Office Maintenance Dashboard?
Click to Purchases Office Maintenance Dashboard in Excel
Using a structured dashboard offers several significant advantages:
📅 Saves Time
You no longer need to sift through emails or spreadsheets. Everything is accessible in one place.
📊 Improves Visibility
Get clear insights into where problems occur most frequently, how much they cost, and how long it takes to resolve them.
🚀 Boosts Efficiency
Prioritize tasks more effectively by understanding what matters most.
📈 Supports Data-Driven Decisions
Base your maintenance strategy on real metrics instead of guesswork.
Advantages of the Office Maintenance Dashboard
Let’s take a closer look at the specific benefits:
1. Centralized Data Management
Having all maintenance data in one place simplifies record-keeping and reporting.
2. Real-Time Filtering
Interactive slicers allow quick data filtering by location, priority, or status.
3. Cost Analysis Made Simple
Visual breakdowns of costs per category or location help in managing the budget effectively.
4. Time Tracking Insights
Easily identify delays or slow response times and take corrective measures.
5. User-Friendly Interface
Even non-technical users can operate the dashboard without any training.
Best Practices for the Office Maintenance Dashboard
To get the most out of your dashboard, follow these best practices:
✅ Keep the Data Sheet Updated
Ensure new maintenance requests are entered regularly and accurately.
✅ Use Drop-down Lists for Data Entry
Limit errors by using predefined drop-down lists for fields like Category, Priority, and Location.
✅ Define Consistent Status Labels
Stick to status values like “Pending,” “In Progress,” and “Resolved” to maintain clean data.
✅ Use Conditional Formatting for Quick Insights
Highlight overdue items or high-cost tasks using Excel’s conditional formatting tools.
✅ Protect Sheets and Cells
Lock formula-based or reference cells to avoid accidental deletion.
How to Customize the Dashboard for Your Office?
Every office is unique. You can easily customize the Excel file:
- Add New Categories in the support sheet to track specific maintenance types.
- Change KPI Cards to reflect metrics that matter most to your team.
- Insert Company Logo and color theme to personalize the dashboard.
- Add More Charts using pivot tables if new insights are required.
Tips to Maintain Clean Data
Clean data ensures accurate reporting. Here are a few tips:
- Avoid blank rows in the Data Sheet.
- Use consistent spelling for names and categories.
- Regularly archive older records to keep the file size manageable.
- Back up the dashboard weekly.
Who Can Use This Dashboard?
This dashboard suits various roles and teams:
- Facility Managers to track requests and spending.
- HR/Admin Teams to manage staff complaints and ensure comfort.
- IT Teams to monitor equipment-related issues.
- Finance Teams to control maintenance budgets.
Conclusion
An Office Maintenance Dashboard in Excel is not just a reporting tool; it’s a complete management solution. From cost control to efficient task resolution, this dashboard empowers your team to stay organized and proactive. By adopting this template, you’ll create a cleaner, more functional office space where issues don’t fall through the cracks.
Frequently Asked Questions (FAQs)
1. Can I use this dashboard without Excel expertise?
Yes. The dashboard is easy to use with drop-down lists and automated charts. You don’t need advanced Excel skills.
2. Can I track maintenance requests by location?
Absolutely. The Location Summary page shows request counts, resolution time, and total cost per location.
3. Is it possible to filter data by category or status?
Yes. The dashboard includes slicers to filter by category, status, priority, and more.
4. Can I add more KPIs to this dashboard?
Yes. You can customize it by adding new pivot tables and charts based on your needs.
5. How often should I update the data?
Ideally, you should update the data sheet daily or at least weekly for accurate tracking.
6. Is this dashboard compatible with Excel Online?
The dashboard works best in the Excel desktop version. Some interactive features may not work fully in Excel Online.
Click to Purchases Office Maintenance Dashboard in Excel
Visit our YouTube channel to learn step-by-step video tutorials
Watch the step-by-step video tutorial: