Managing office supplies can become overwhelming—especially when requests pile up, approvals lag, and costs increase without clear tracking. If you’re tired of juggling spreadsheets and purchase records manually, it’s time to consider the Office Supplies Dashboard in Excel—your all-in-one solution to monitor supply usage, costs, approvals, and delivery trends with just a few clicks.
What is the Office Supplies Dashboard in Excel?
The Office Supplies Dashboard in Excel is a ready-to-use, interactive template that helps you visualize and track everything related to office supply management. From monitoring requests by department to analyzing spending patterns by category, this dashboard turns raw data into actionable insights.
With built-in slicers, charts, and cards, it offers real-time visibility into procurement activity, making it ideal for admin teams, office managers, finance departments, and even facility coordinators.
Click to Purchases Office Supplies Dashboard in Excel
Key Pages in the Office Supplies Dashboard
This dashboard is designed with five powerful analytical pages and supporting data sheets. Let’s break them down:
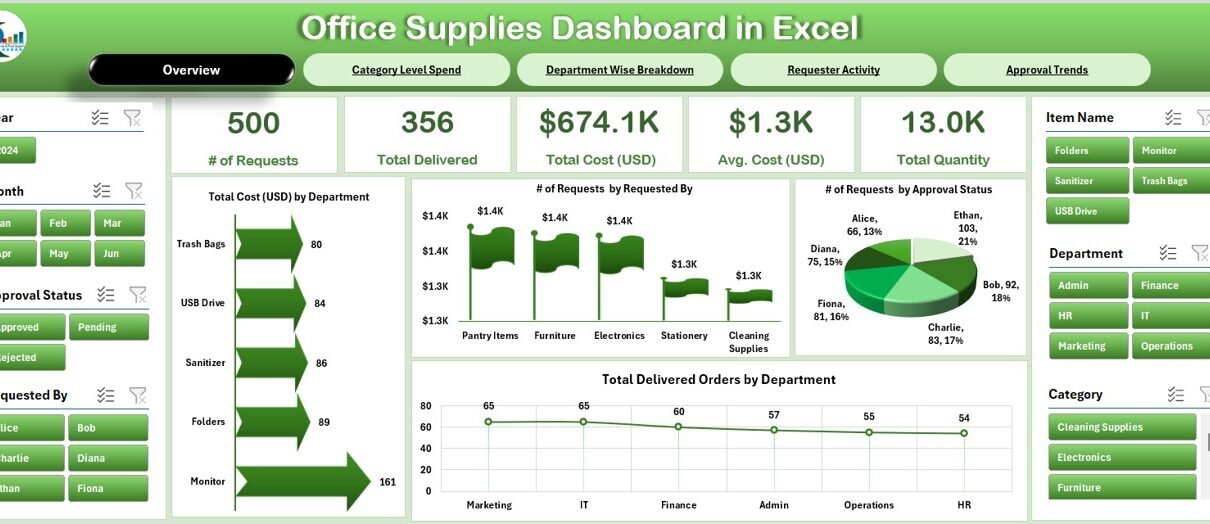
Overview Page
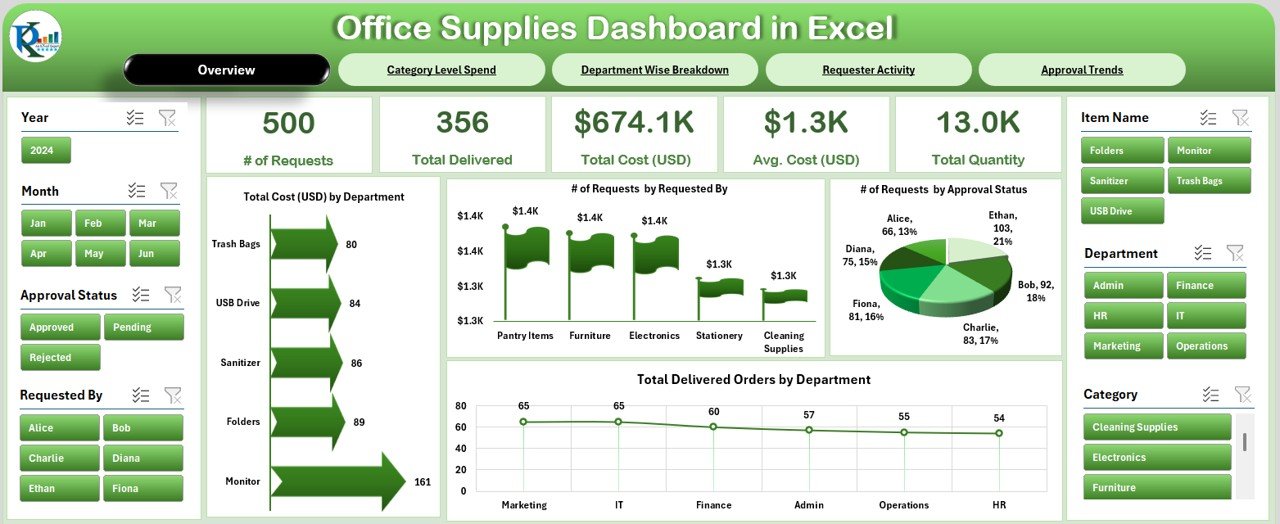
This is the heart of the dashboard. The top page navigator helps users jump between different views quickly.
-
Cards Display: Total Requests, Approved Requests, Delivered Orders, Total Spend, Average Cost
Click to Purchases Office Supplies Dashboard in Excel
Charts Include:
- Total Cost (USD) by Department
- Number of Requests by Employee
- Requests by Approval Status
- Delivered Orders by Department
Category Level Spend
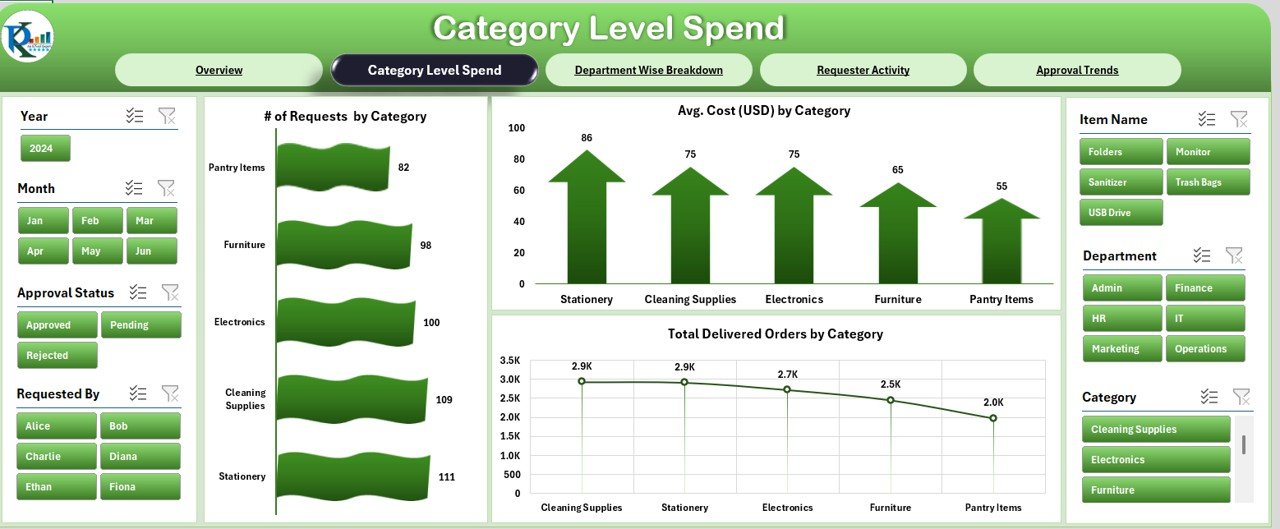
Gain deep insights into spending by supply categories.
Charts Include:
- Requests by Category
- Average Cost by Category
- Delivered Orders by Category
Department Wise Breakdown
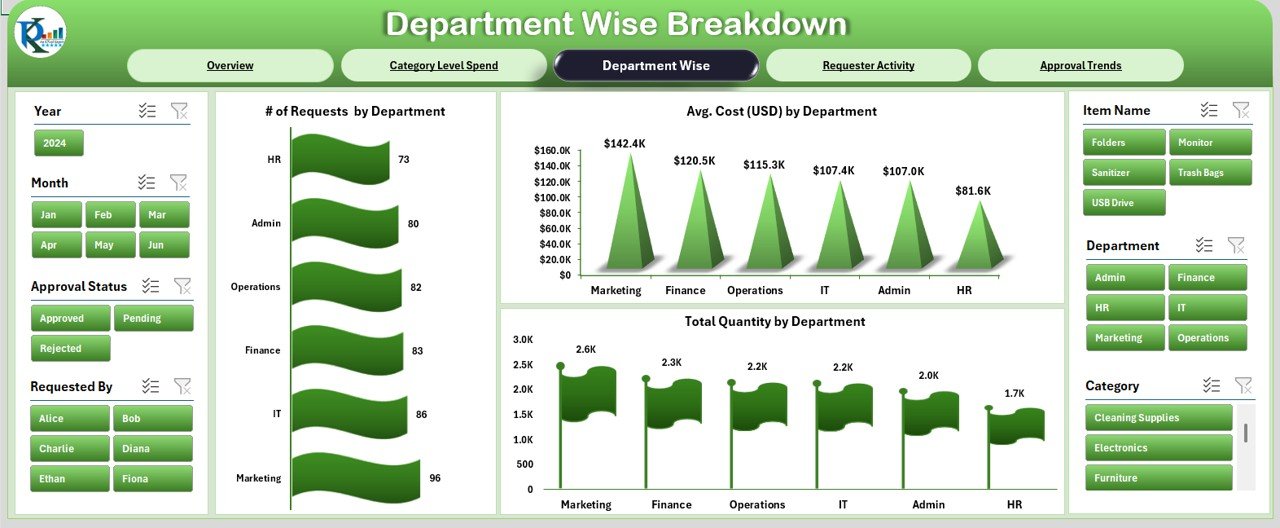
Here, you’ll find a comprehensive view of how departments interact with office supplies.
Charts Include:
- Requests by Department
- Average Cost per Department
- Total Quantity Ordered by Department
Requester Activity
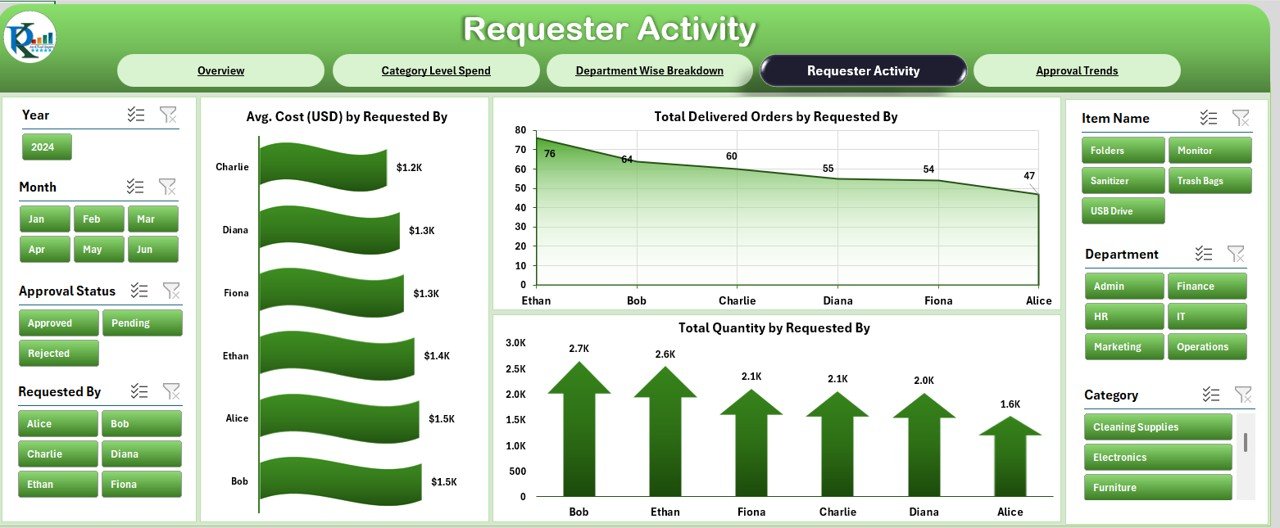
Identify the most active requesters and their cost impact.
Charts Include:
- Average Cost by Requester
- Delivered Orders by Requester
- Total Quantity by Requester
Click to Purchases Office Supplies Dashboard in Excel
Approval Trends
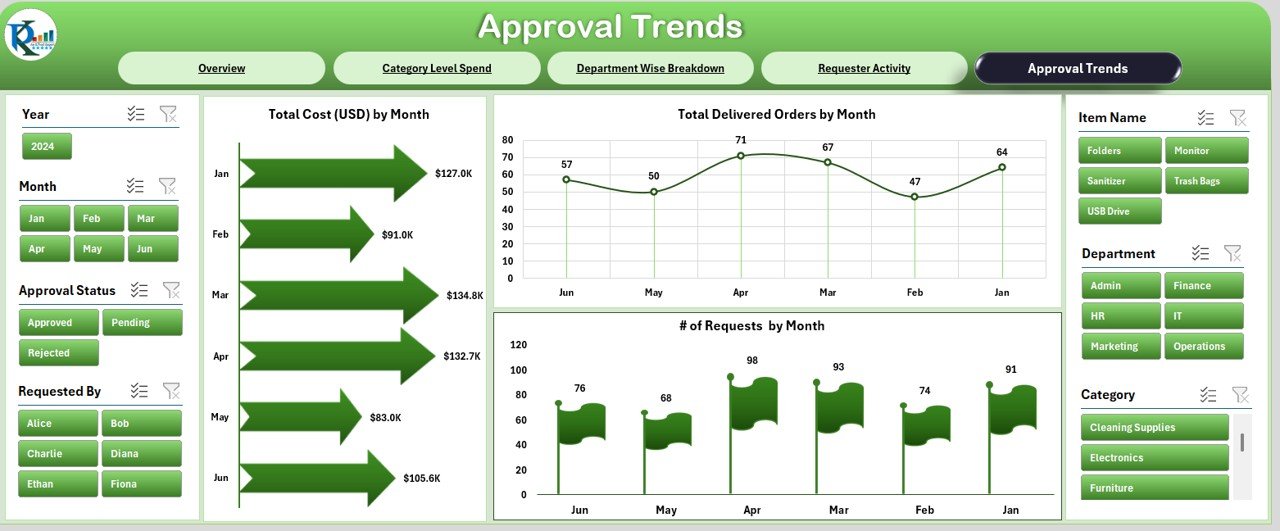
Keep an eye on how approvals and deliveries trend over time.
Charts Include:
- Monthly Total Cost (USD)
- Monthly Delivered Orders
- Number of Requests by Month
What’s Inside the Data Sheet?
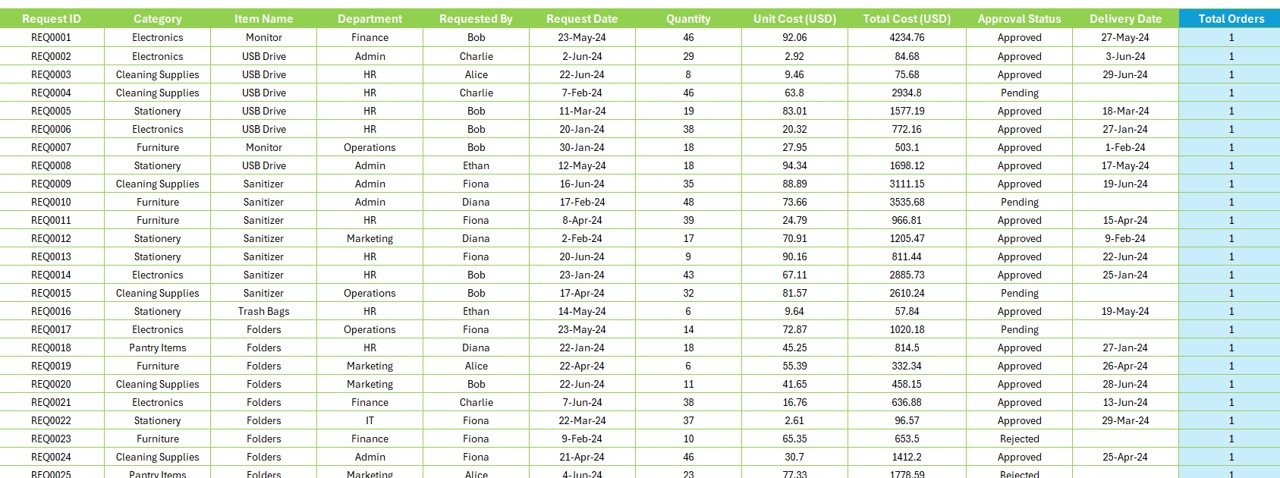
To fuel this dashboard, the Data Sheet includes:
-
Request ID
-
Category & Item Name
-
Department & Requested By
-
Request & Delivery Dates
-
Quantity & Unit Cost
-
Total Cost
-
Approval Status
-
Delivered Orders
-
Month and Year
Advantages of the Office Supplies Dashboard in Excel
Using this dashboard gives you multiple advantages:
🔍 Improved Visibility: Instantly understand spending patterns and request behaviors.
📉 Cost Control: Identify which departments or categories are overspending.
⏱️ Faster Approvals: Spot delays in approvals and streamline workflows.
📦 Inventory Monitoring: Track delivered vs. requested quantities efficiently.
📊 Data-Driven Decisions: Make informed decisions backed by visuals, not guesswork.
Best Practices for Using the Office Supplies Dashboard
To make the most of this dashboard, follow these best practices:
-
Update Data Regularly
Refresh your data sheet weekly or monthly to keep analytics current. -
Standardize Data Entries
Use dropdown lists or data validation to avoid typos and inconsistent department names. -
Use Slicers Smartly
Filter by department, category, or requester to focus on specific areas. -
Set Approval SLAs
Monitor the approval timeline and hold teams accountable for delays. -
Back-Up the Dashboard
Always save a version before updating. Excel dashboards are sensitive to changes.
Why Choose Excel for Supply Dashboards?
You might wonder, why Excel? Here’s why this solution is perfect:
✅ Easy to customize
✅ No expensive software required
✅ Ideal for small to medium-sized offices
✅ Supports visual storytelling with slicers and conditional formatting
✅ Quick to implement—no training needed
Conclusion
Managing office supplies effectively doesn’t need to be a complex or costly process. With the Office Supplies Dashboard in Excel, you gain full control over your inventory, requests, costs, and departmental activities—all in a familiar and user-friendly environment.
Whether you’re overseeing a small office or a large organization, this dashboard provides the tools to stay efficient, accountable, and organized.
Frequently Asked Questions (FAQs)
1. Can I customize this dashboard for my company’s needs?
Yes! You can easily change categories, departments, or KPIs based on your office structure.
2. Do I need advanced Excel skills to use it?
Not at all. It’s designed for regular users. If you can filter and click, you can use this dashboard.
3. How often should I update the data sheet?
Weekly or monthly updates are recommended to keep reports accurate and useful.
4. Can this dashboard track purchase orders too?
Yes, you can add additional fields for PO Numbers and Supplier Details if needed.
5. Is it compatible with older versions of Excel?
It works best on Excel 2016 and above, especially for slicers and advanced charts.
Visit our YouTube channel to learn step-by-step video tutorials
Click to Purchases Office Supplies Dashboard in Excel