In today’s fast-paced business environment, organizations are continually striving to streamline their processes and enhance operational efficiency. One such area that benefits immensely from data-driven insights is the management of office supplies. The Office Supplies Dashboard in Power BI is a cutting-edge tool designed to monitor and optimize the supply chain of office supplies within an organization.
This article will delve into the key features, benefits, best practices, and how the Office Supplies Dashboard in Power BI can be an essential asset for any organization.
Click to Purchases Office Supplies Dashboard in Power
What Is the Office Supplies Dashboard in Power BI?
The Office Supplies Dashboard in Power BI is a robust reporting tool that consolidates data from an Excel file and presents it in an interactive, user-friendly interface within Power BI. It offers an in-depth view of the purchasing, ordering, and delivery processes of office supplies. The dashboard is designed to help organizations keep track of their office supply usage, control costs, and optimize supply chain activities.
By integrating data visualization and reporting capabilities, the dashboard allows decision-makers to access key performance indicators (KPIs), view historical trends, and monitor real-time data, all in one centralized location.
Key Features of the Office Supplies Dashboard in Power BI
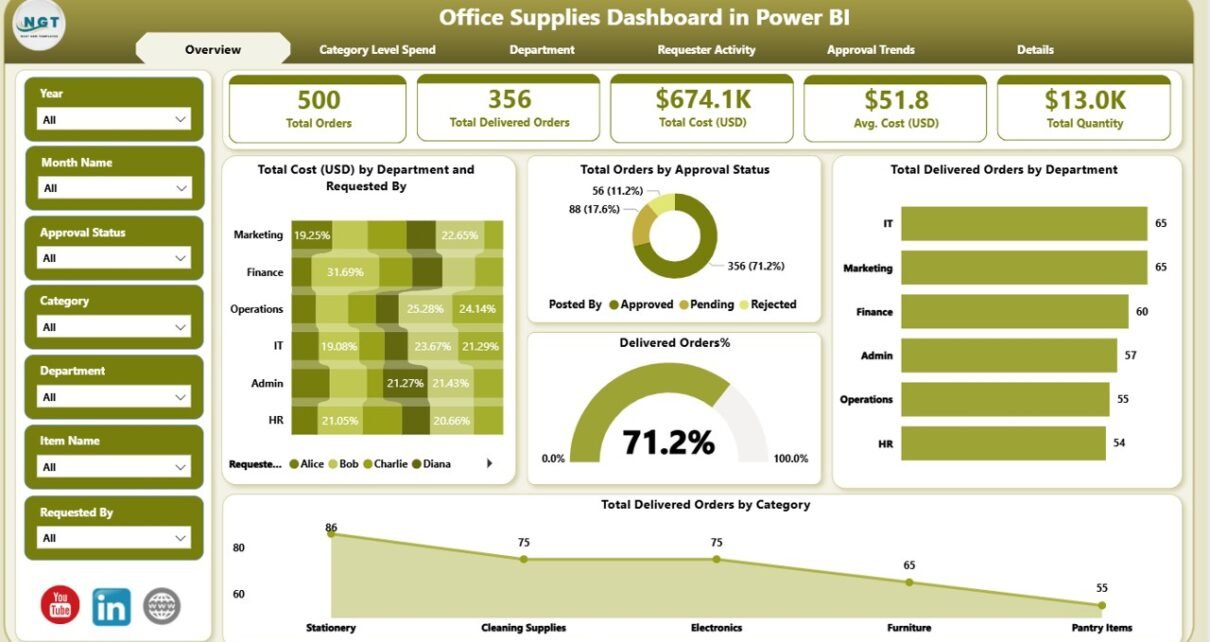
The Office Supplies Dashboard in Power BI is structured into five main pages, each offering distinct insights and metrics. These pages are designed to cater to various stakeholders within the organization, from department managers to supply chain teams. Let’s explore the key pages and the insights they provide:
Overview Page: A Comprehensive Snapshot
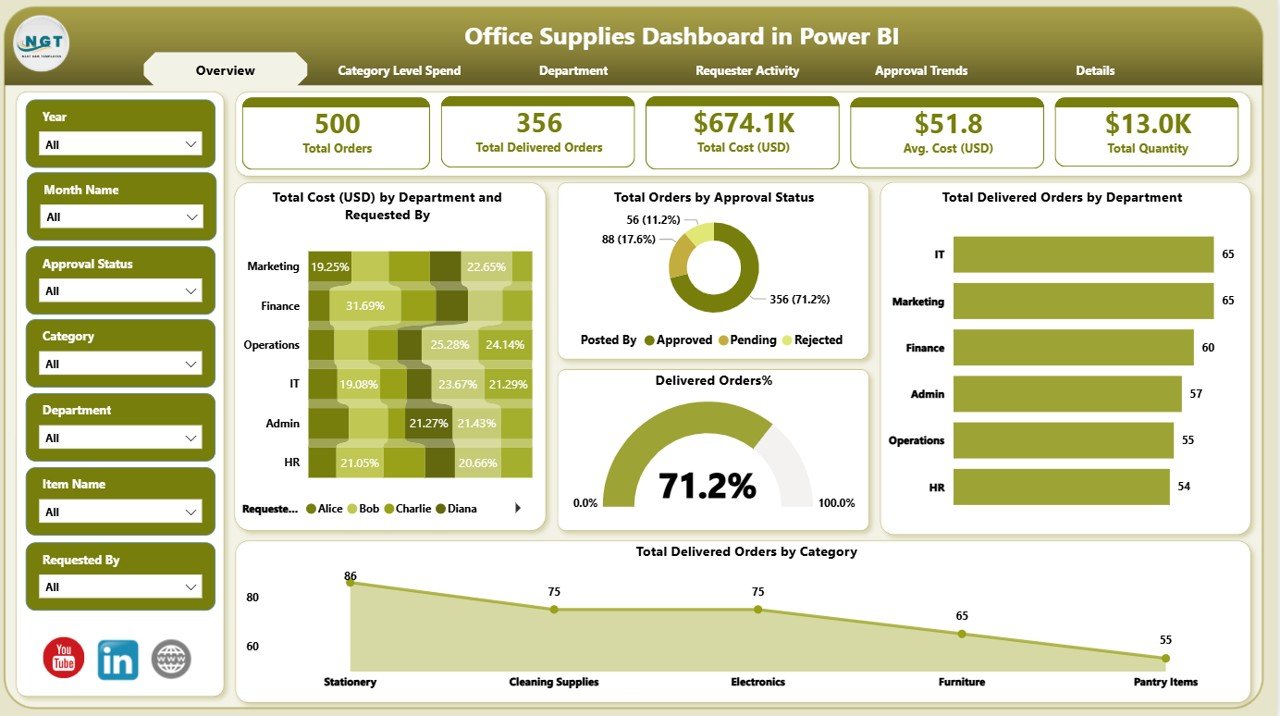
The Overview Page serves as the main dashboard where users get an at-a-glance view of the office supplies data. Here’s what you will find:
-
Slicers: 6 slicers allow users to filter data based on different criteria, providing flexibility in how the data is viewed.
-
Cards: 5 interactive cards display crucial metrics, including the Total Cost (USD) by Department and Requested By, the Total Orders by Approval Status, and Total Delivered Orders by Category.
-
Charts: Several charts visualize the data, showing metrics such as the percentage of Delivered Orders, Total Delivered Orders by Category, and Total Cost (USD) by Department and Requested By.
This page gives decision-makers an overall summary of key performance indicators (KPIs), helping them understand how well office supplies are being managed across the organization.
Category Level Spend Page: In-Depth Cost Analysis
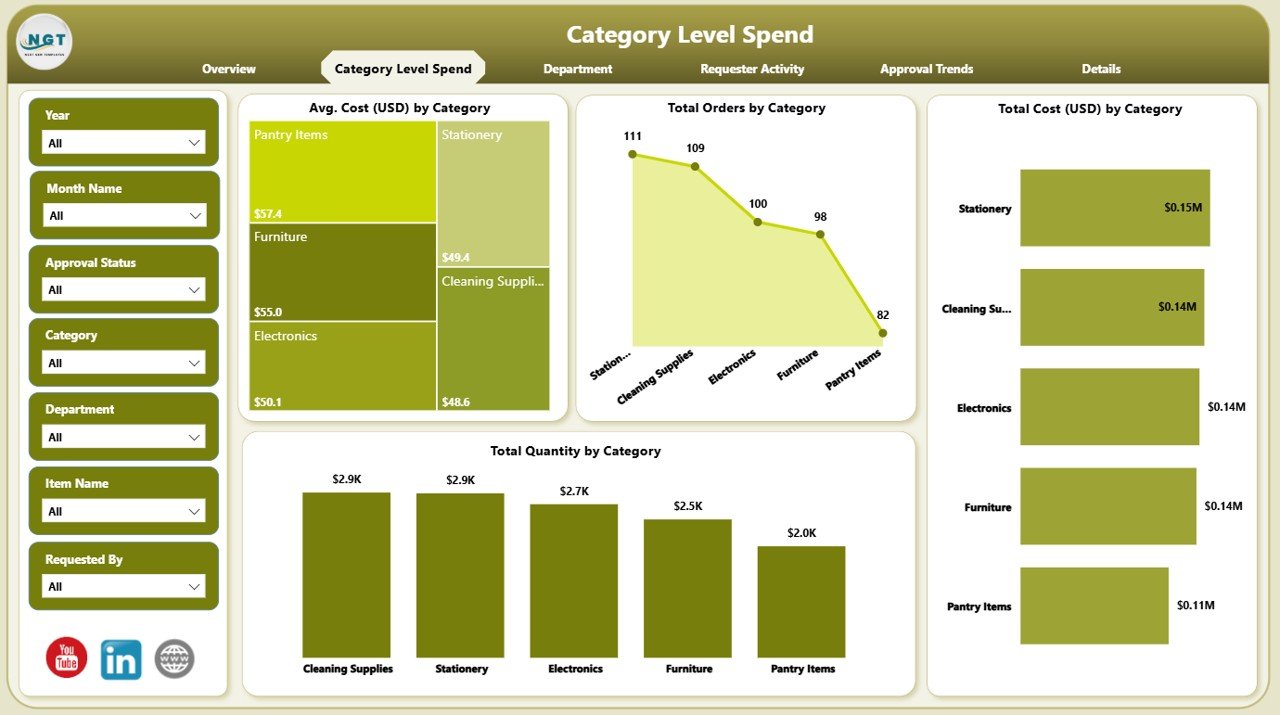
The Category Level Spend Page focuses on providing detailed insights into the cost associated with different categories of office supplies. This page helps users track and control spending, ensuring that the supply chain is both cost-effective and optimized. Key features include:
-
Slicers: 6 slicers allow for data filtering based on category-specific criteria.
Charts: The page presents 4 visualizations, including:
- Avg. Cost (USD) by Category
- Total Orders by Category
- Total Cost (USD) by Category
- Total Quantity by Category
Click to Purchases Office Supplies Dashboard in Power
These charts enable managers to identify which categories are consuming the most resources and adjust purchasing behavior accordingly.
Department Page: Analyzing Supply Chain Efficiency by Department
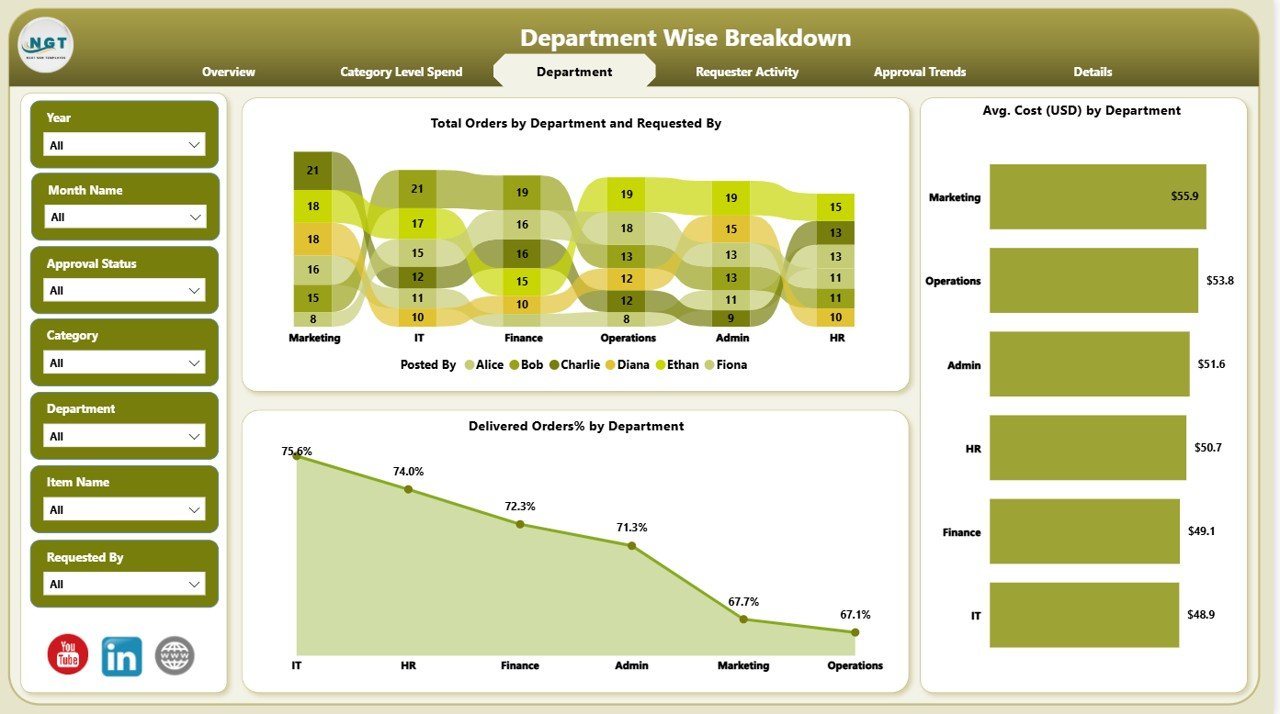
The Department Page provides insights into how different departments are managing their office supplies. It helps track departmental spending and order fulfillment, ensuring that each department adheres to its budget. Key components of this page include:
-
Slicers: 6 slicers that filter data by department and other relevant criteria.
Charts: 3 key charts display:
- Total Orders by Department and Requested By
- Delivered Orders % by Department
- Avg. Cost (USD) by Department
This page helps in monitoring departmental efficiency and identifying areas where cost reduction strategies can be applied.
Requester Activity Page: Tracking Order Requests
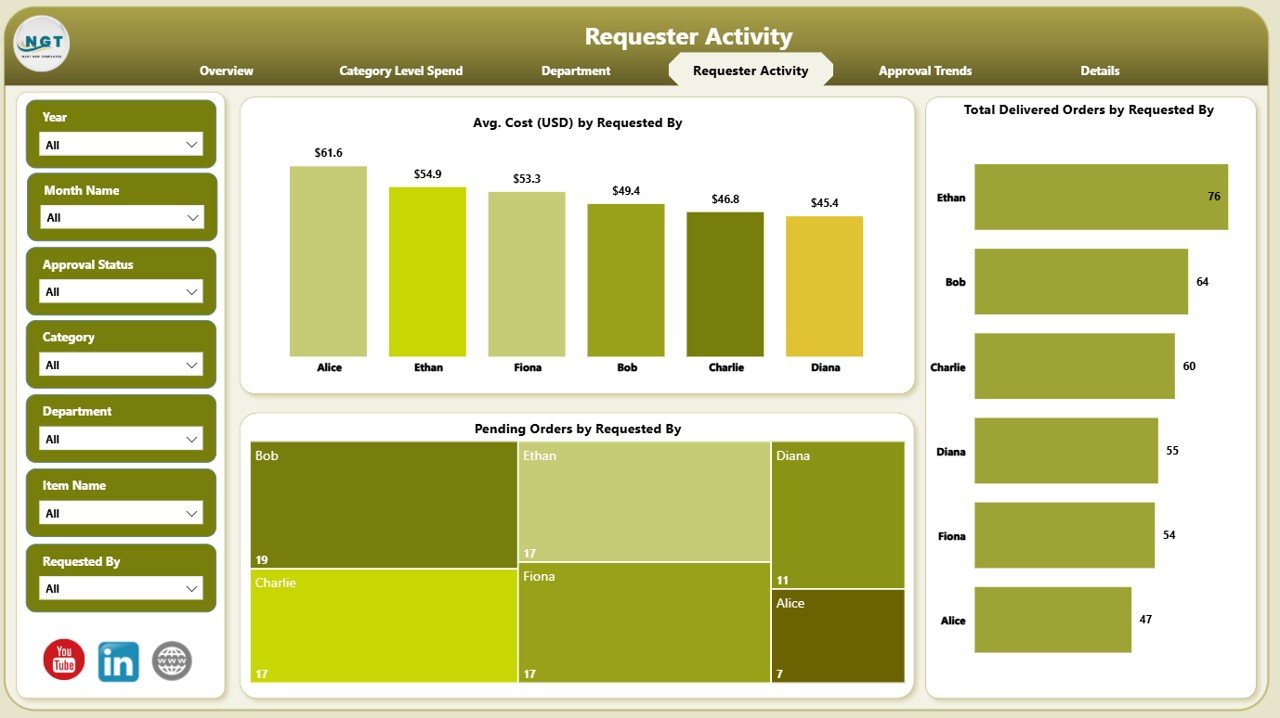
The Requester Activity Page is essential for understanding the behavior of individual requesters and the efficiency of order fulfillment. This page allows organizations to track who is ordering what and how efficiently those orders are being delivered. It includes:
-
Slicers: 6 slicers that allow filtering of data based on requesters and other parameters.
Charts: 3 charts that show:
- Avg. Cost (USD) by Requested By
- Total Delivered Orders by Requested By
- Pending Orders by Requested By
By understanding requester activity, organizations can identify patterns in office supply usage and optimize purchasing decisions.
Approval Trends Page: Analyzing Order Approval Patterns
The Approval Trends Page provides valuable insights into the approval process for office supply orders. It helps track approval trends over time, ensuring that the approval process remains smooth and timely. Key features include:
-
Slicers: 6 slicers for filtering data by approval status, time periods, and more.
Charts: 3 charts that track:
- Total Cost (USD) by Month Name
- Total Orders by Month Name
- Total Delivered Orders by Month Name
These charts are essential for tracking approval workflows, ensuring that any delays in the approval process are quickly identified.
Click to Purchases Office Supplies Dashboard in Power
Advantages of Using the Office Supplies Dashboard in Power BI
Implementing the Office Supplies Dashboard in Power BI brings numerous advantages to any organization. Some key benefits include:
-
Real-time Insights: The dashboard provides real-time visibility into office supply usage, helping teams make informed decisions quickly.
-
Cost Control: With detailed data on spending, organizations can easily identify areas of overspending and take corrective actions.
-
Optimized Supply Chain: By analyzing order trends, categories, and departmental activity, businesses can optimize the supply chain, reducing waste and improving resource allocation.
-
Customizable Views: With interactive slicers, users can filter data based on their needs, ensuring they get the most relevant insights.
-
Improved Decision Making: The dashboard’s easy-to-read charts and metrics help executives and department managers make better, data-driven decisions.
Best Practices for Managing Office Supplies Using Power BI
To make the most out of the Office Supplies Dashboard in Power BI, follow these best practices:
-
Regular Data Updates: Ensure that the data feeding into the dashboard is regularly updated to reflect current trends and activities.
-
Set Clear KPIs: Define clear key performance indicators (KPIs) that align with organizational goals. This will help focus on the most important metrics.
-
Optimize Filters and Slicers: Use slicers effectively to filter data by departments, categories, or requesters. This helps you focus on the most relevant information.
-
Encourage Cross-Department Collaboration: Use the dashboard to foster collaboration between departments, ensuring that everyone has visibility into office supply usage and spending.
-
Use the Approval Trends Page for Workflow Efficiency: Track and optimize the approval process by ensuring timely and accurate approvals.
Frequently Asked Questions (FAQs)
1. How can the Office Supplies Dashboard in Power BI help reduce costs?
By analyzing the data, the dashboard helps identify areas of overspending, which can be controlled by adjusting procurement strategies and optimizing order quantities.
2. Can I customize the dashboard to fit my organization’s specific needs?
Yes, the dashboard is highly customizable. You can add or remove slicers, change chart types, and adjust filters to align with your business requirements.
3. How often should the data in the dashboard be updated?
For the best results, it’s recommended to update the data regularly, ideally on a weekly or monthly basis, to ensure accurate and timely insights.
4. Can this dashboard be used for other types of inventory management?
Yes, while this dashboard is designed for office supplies, the same framework can be adapted to manage other types of inventory, including IT equipment or office furniture.
5. How do I integrate Excel data into Power BI?
Power BI allows easy integration with Excel by importing the data directly into the Power BI platform. From there, you can create visualizations and manage your data as needed.
Conclusion
The Office Supplies Dashboard in Power BI is a powerful tool for organizations looking to optimize their office supply management. With its user-friendly interface, real-time data insights, and interactive features, it empowers businesses to take control of their office supply chains. By leveraging the advantages and best practices outlined in this article, businesses can improve cost efficiency, streamline processes, and make more informed decisions.\
Visit our YouTube channel to learn step-by-step video tutorials