In today’s digital world, businesses rely heavily on online payments. From e-commerce platforms to subscription services, payment gateways are the lifeline of revenue operations. However, managing multiple gateways, monitoring transaction fees, analyzing refund trends, and tracking customer satisfaction can quickly become complex without the right tools.
That’s where the Payment Gateways Dashboard in Excel comes into play — a ready-to-use, interactive, and data-driven solution that helps finance and business teams analyze performance, detect anomalies, and make data-backed decisions in real time.
This article explores everything you need to know about this Excel dashboard — from its structure and features to the advantages and best practices for using it effectively.
Click to Purchases Payment Gateways Dashboard in Excel
What Is a Payment Gateways Dashboard in Excel?
A Payment Gateways Dashboard in Excel is a comprehensive visual analytics tool designed to track, compare, and optimize payment transactions across different gateways, countries, and industries.
Built entirely in Microsoft Excel, it consolidates all payment data into one interactive workbook — allowing you to monitor transaction volume, net revenue, refund rates, fees, and satisfaction scores with clarity and precision.
Instead of toggling between multiple reports from PayPal, Stripe, Razorpay, or other providers, you can analyze everything in one place. With built-in charts, slicers, and KPIs, the dashboard helps you uncover patterns and gain valuable insights into your financial operations.
Key Features of the Payment Gateways Dashboard in Excel
The Payment Gateways Dashboard is designed with usability and data clarity in mind. It contains five main analytical pages, each with unique charts, metrics, and filters that give you a 360° view of your payment operations.
Let’s explore each page in detail:
1. Overview Page
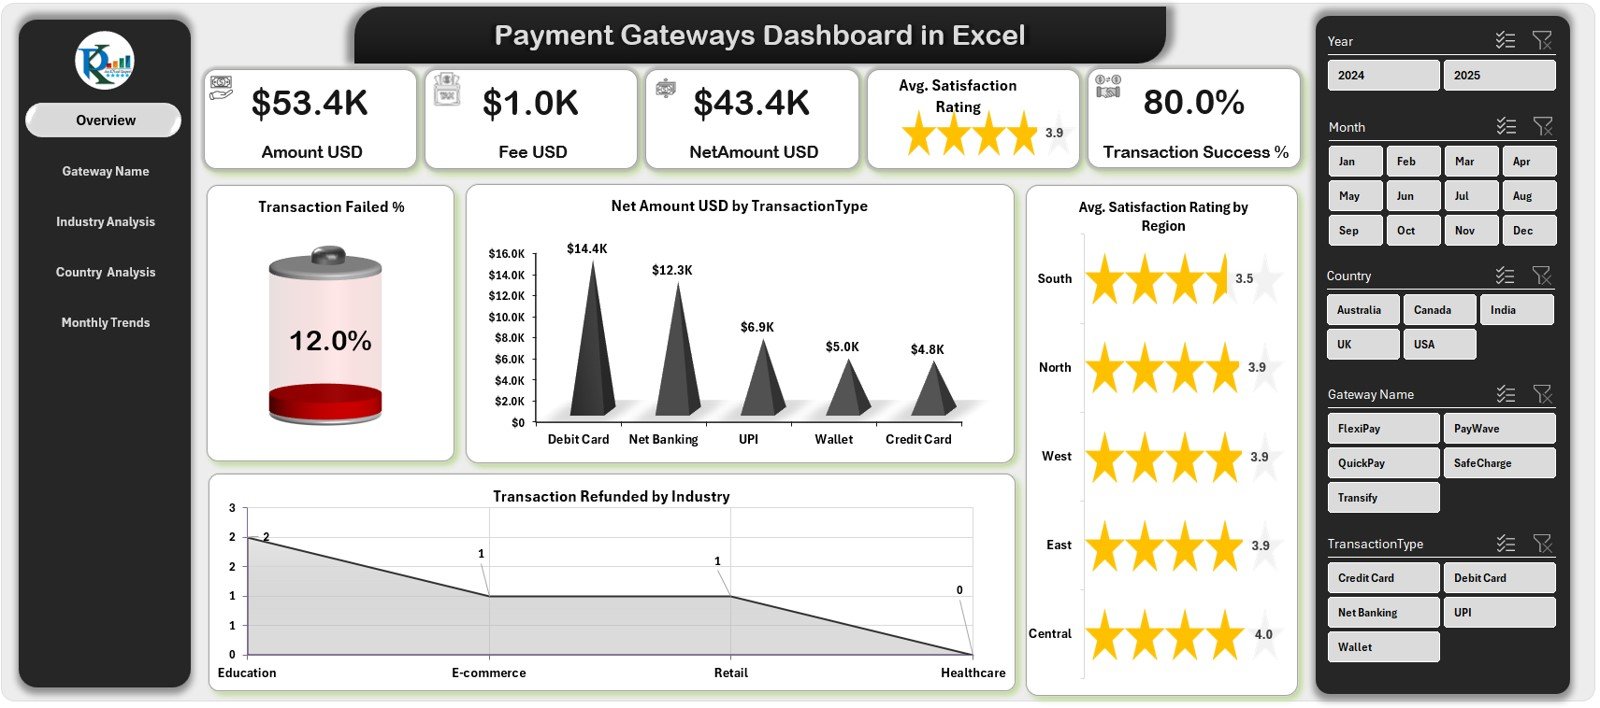
The Overview Page serves as the control center of the entire dashboard.
It provides a high-level summary of all major KPIs, enabling you to assess your performance at a glance.
Key Highlights:
-
🎯 Page Navigator: Positioned on the left side, it lets you jump between different analytical pages instantly.
-
📊 Five KPI Cards: These display total transaction volume, success rate, refund percentage, total net revenue (USD), and customer satisfaction score.
-
📈 Charts Included:
-
Transaction Failed %
-
Net Amount (USD) by Transaction Type
-
Transaction Refunded by Industry
-
Average Satisfaction Rating by Region
-
This page helps decision-makers quickly identify which regions, transaction types, or industries are performing well — and which ones need improvement.
2. Gateway Name Analysis Page
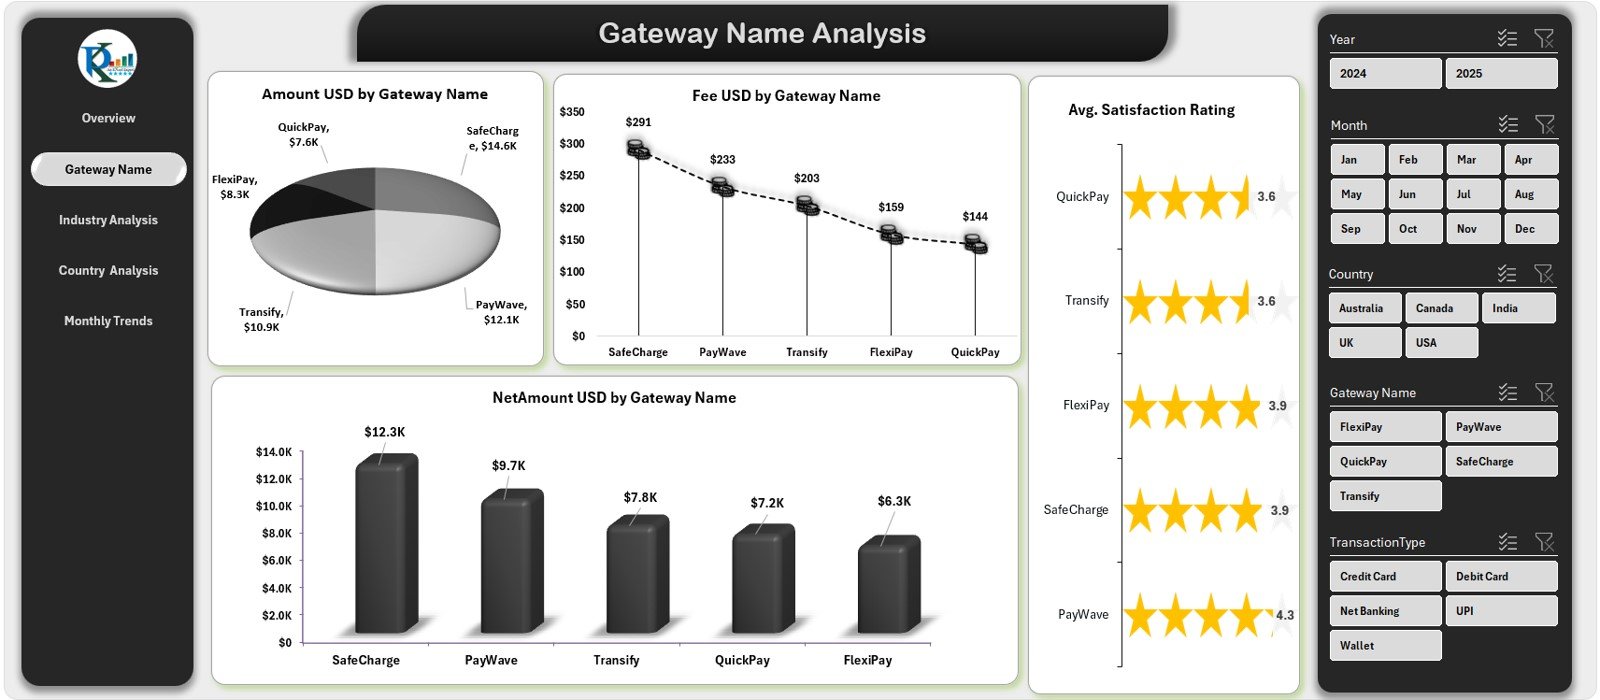
Different payment gateways often charge different fees, offer different processing speeds, and have varying reliability.
This page helps you compare and analyze each gateway individually.
Key Charts:
-
Total Amount (USD) by Gateway Name
-
Fee (USD) by Gateway Name
-
Net Amount (USD) by Gateway Name
-
Average Satisfaction Rating by Gateway Name
Using slicers on the right-side panel, you can filter data by month, industry, or country, allowing for quick comparisons and trend analysis.
Click to Purchases Payment Gateways Dashboard in Excel
3. Industry Analysis Page
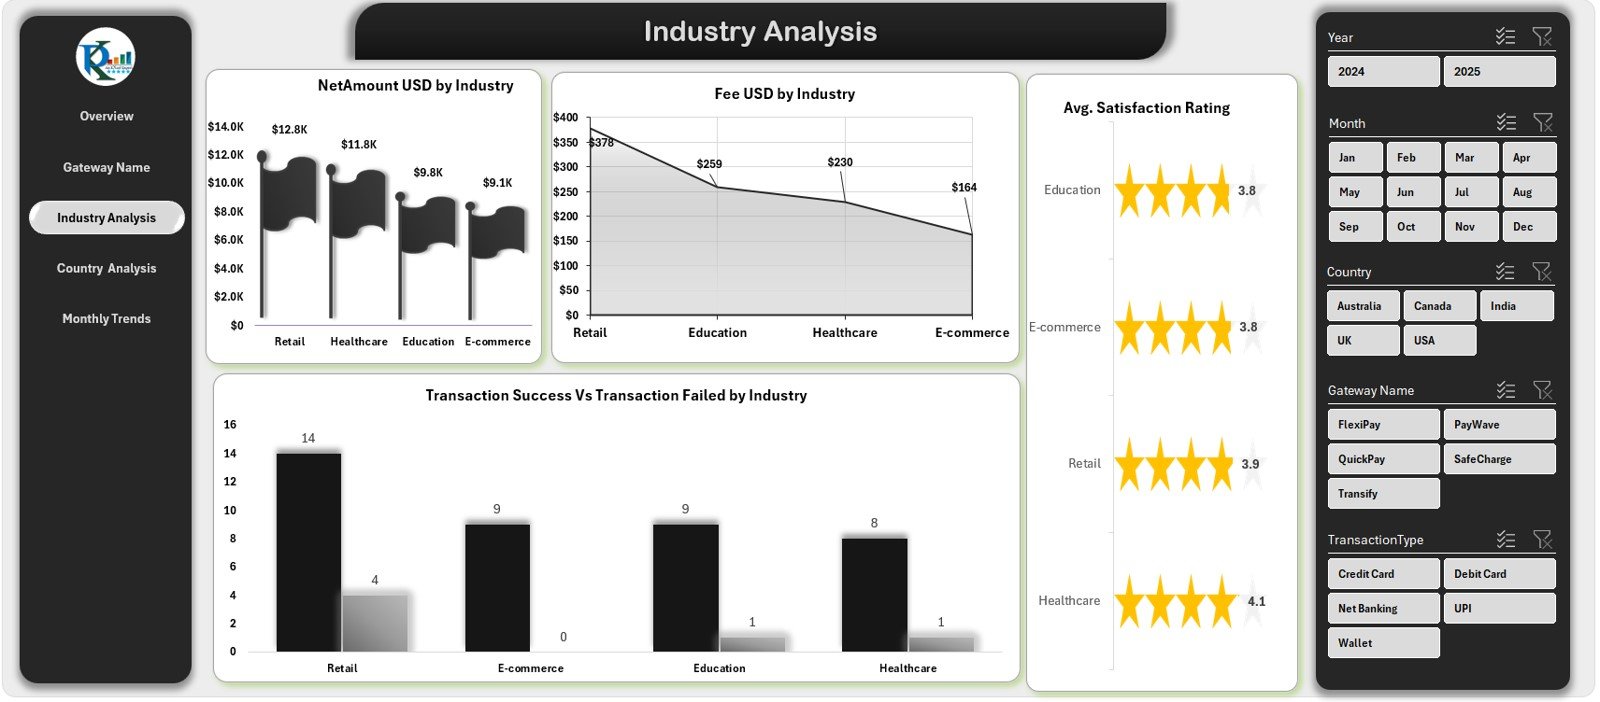
If your organization serves multiple industries — such as retail, travel, finance, or technology — understanding payment performance by industry is crucial.
Key Charts:
-
Net Amount (USD) by Industry
-
Fee (USD) by Industry
-
Transaction Success vs. Transaction Failed by Industry
-
Average Satisfaction Rating by Industry
This page helps identify which industries have higher transaction fees, which ones experience frequent failures, and where customer satisfaction can be improved.
4. Country Analysis Page

Payment behavior varies significantly across countries due to currency, infrastructure, and customer preferences.
Key Charts:
-
Amount (USD) by Country
-
Fee (USD) by Country
-
Net Amount (USD) by Country
-
Transaction Success % by Country
With this page, global finance teams can monitor regional performance, evaluate transaction health, and understand fee structures across geographies.
5. Monthly Trends Page

Trends reveal the bigger picture — and this page brings that clarity to your financial analysis.
Key Charts:
-
Amount (USD) by Month
-
Net Amount (USD) by Month
-
Fee (USD) by Month
-
Transaction Refunded % by Month
With slicers on the right side, you can analyze performance over time, identify seasonal fluctuations, and forecast future revenue trends.
6. Support and Data Sheets
Apart from the analytical pages, the workbook also includes:
-
Support Sheet: Houses reference data such as gateway lists, country codes, or satisfaction rating scales.
-
Data Sheet: Stores raw transaction-level data used by all dashboards and pivot tables. This is where you paste or import your monthly payment data.
Why Every Business Needs a Payment Gateways Dashboard
Modern businesses operate in a multi-gateway environment. You may use Stripe for subscriptions, Razorpay for domestic transactions, and PayPal for international clients. Without a centralized system, analyzing performance across these platforms becomes chaotic.
The Payment Gateways Dashboard in Excel solves that problem by providing:
-
A single source of truth for all gateway data
-
Automated calculations for success rates, fees, and refunds
-
Interactive charts and KPIs for faster insights
-
Real-time comparison of gateway performance
This means finance teams no longer spend hours merging CSV files — they can focus on insights and action.
Click to Purchases Payment Gateways Dashboard in Excel
Advantages of Using a Payment Gateways Dashboard in Excel
Let’s explore the key benefits that make this dashboard a must-have for every business handling online transactions.
1. Simplified Financial Analysis
You can analyze all your payment metrics without switching between systems. The dashboard aggregates data and turns it into meaningful visuals.
2. Real-Time Decision-Making
Since Excel automatically updates calculations and charts, you can make timely decisions based on the latest data.
3. Reduced Errors
Manual reporting often leads to data inaccuracies. This automated dashboard ensures accuracy across all metrics — from refunds to transaction fees.
4. Cost Savings
Instead of investing in expensive BI tools, this Excel dashboard provides similar insights at a fraction of the cost.
5. Customizable Design
Every chart, slicer, and metric is fully editable. You can easily adapt the dashboard to your organization’s unique needs.
6. Improved Customer Insights
The inclusion of satisfaction ratings and industry data helps link transaction performance with customer experience.
How to Use the Payment Gateways Dashboard Effectively
Using the dashboard is simple. Here’s a quick guide to get started:
-
Input Your Data:
Paste your transaction data into the Data Sheet — including columns like Transaction ID, Date, Gateway Name, Amount, Fee, Industry, and Country. -
Refresh Pivots:
Click “Refresh All” in Excel to update charts and summaries automatically. -
Navigate Pages:
Use the Page Navigator on the left to switch between Overview, Industry, Gateway, or Monthly pages. -
Filter Using Slicers:
Choose filters like Month, Gateway, or Country to narrow down insights. -
Export Reports:
Save visuals as PDFs or snapshots for quick sharing with management.
Key Metrics You Can Track
A Payment Gateways Dashboard helps track and visualize all critical metrics related to online transactions.
Common KPIs include:
-
💳 Total Transactions Processed
-
📉 Failed Transaction Percentage
-
💵 Net Amount (USD)
-
💰 Total Fees (USD)
-
🔁 Refund Rate (%)
-
🌍 Regional Transaction Distribution
-
⭐ Average Customer Satisfaction Rating
By analyzing these KPIs together, businesses can identify bottlenecks, optimize costs, and enhance user experience.
Understanding the Importance of Payment Analytics
Payment analytics go beyond revenue reporting. They reveal customer trust, platform efficiency, and financial transparency.
-
Detect Fraud: Spot irregular transaction patterns or high refund rates early.
-
Optimize Gateways: Shift traffic toward gateways with lower fees or higher success rates.
-
Enhance User Experience: Monitor satisfaction trends to improve payment reliability.
-
Forecast Revenue: Use monthly trends to plan budgets and campaigns confidently.
When managed effectively, payment analytics transform from numbers into strategic advantage.
Integrating the Dashboard with Your Workflow
You can easily integrate this dashboard into your existing workflow:
-
Finance Teams: For monthly reconciliations and performance reports
-
E-commerce Managers: To monitor sales channels and transaction health
-
Customer Support Teams: To track refund and satisfaction trends
-
Executives: To make data-driven decisions on gateway optimization
With cloud integration through Excel Online or SharePoint, teams can collaborate in real time, ensuring everyone has access to updated insights.
Click to Purchases Payment Gateways Dashboard in Excel
Best Practices for the Payment Gateways Dashboard in Excel
To get the most from this tool, follow these proven best practices:
1. Maintain Data Consistency
Use the same column headers and data formats every month. This ensures smooth refresh and accurate chart updates.
2. Refresh Data Regularly
Update your data at least once a week to keep metrics relevant and actionable.
3. Validate Gateway Fees
Cross-verify transaction fees with your payment provider reports to ensure accuracy.
4. Use Conditional Formatting
Add visual indicators like arrows or color scales to highlight performance changes month over month.
5. Protect Sensitive Data
Since financial data is confidential, apply password protection and restrict access where needed.
6. Monitor Key KPIs
Keep a close eye on failure rates, refund percentages, and satisfaction scores — these directly impact customer trust and revenue.
7. Document Changes
If multiple users maintain the dashboard, document updates or version changes to avoid confusion.
Common Mistakes to Avoid
Even though the dashboard is simple to use, some common errors can limit its effectiveness:
-
Not refreshing data after pasting new records
-
Ignoring slicers or filters while analyzing performance
-
Overloading the file with unnecessary formulas
-
Forgetting to back up the raw data
Avoiding these mistakes keeps the dashboard fast, accurate, and reliable.
How to Customize the Dashboard for Your Business
Every organization has unique reporting needs. Here are some customization ideas:
-
Add new KPIs like “Chargeback Rate” or “Average Processing Time.”
-
Include pivot charts for gateway performance by currency.
-
Use macros or VBA scripts for automated data imports.
-
Integrate Power Query for faster data cleaning and merging.
-
Create dynamic drop-downs for gateways, industries, or months.
Because it’s built in Excel, customization is limitless — you can expand or simplify the dashboard as your operations grow.
Advantages of Excel Over Other Tools
While tools like Power BI or Tableau are powerful, Excel remains the most accessible and flexible platform for most businesses.
Here’s why:
-
✅ No additional licenses needed
-
✅ Easier learning curve
-
✅ Fully offline operation
-
✅ Simple sharing and version control
-
✅ Ideal for small to medium enterprises
With built-in pivot tables, slicers, and charts, Excel delivers powerful analytics without steep learning requirements.
Conclusion
The Payment Gateways Dashboard in Excel is not just a reporting template — it’s a strategic decision-making tool. By consolidating data from multiple payment providers and presenting it through interactive visuals, it helps organizations achieve financial transparency, reduce operational risks, and improve customer trust.
Whether you’re an e-commerce startup or a global enterprise, this dashboard simplifies complex payment data and transforms it into actionable insights — all within the familiarity and flexibility of Excel.
Frequently Asked Questions (FAQs)
1. What is a Payment Gateways Dashboard in Excel used for?
It’s used to analyze, compare, and monitor online transaction data across multiple payment gateways, helping businesses track performance and optimize costs.
2. Can I add more gateways to the dashboard?
Yes. You can easily add new gateway names in the Data Sheet and refresh pivots — the charts will update automatically.
3. Does this dashboard require coding knowledge?
No. It uses Excel formulas, pivot tables, and slicers — no VBA coding is required to operate it.
4. How often should I update the data?
Weekly or monthly updates are ideal to maintain fresh and actionable insights.
5. Can I use this dashboard for multiple currencies?
Yes. You can include a “Currency” column in the data and apply conversion logic or slicers to analyze by region.
6. How can I share the dashboard with my team?
You can share it via email, OneDrive, or Excel Online. For better collaboration, save it in a shared cloud workspace.
7. What file format does it support?
It’s a standard Excel (.xlsx) file compatible with all modern versions of Microsoft Excel.
8. Can I integrate this dashboard with Power BI later?
Yes. Since it’s Excel-based, you can import it into Power BI for advanced visualizations and automation.
9. Does it include customer feedback metrics?
Yes. The dashboard includes Average Satisfaction Rating by region, gateway, and industry.
10. Who can benefit from this dashboard?
Finance teams, e-commerce managers, data analysts, and executives — anyone managing online payments or financial analytics.
Click to Purchases Payment Gateways Dashboard in Excel
Visit our YouTube channel to learn step-by-step video tutorials