In today’s competitive business environment, procurement teams must control costs, manage suppliers, reduce delays, and improve efficiency at every stage of the purchasing cycle. However, when procurement data stays scattered across spreadsheets, ERP systems, and emails, decision-making becomes slow and reactive.
That is exactly where a Procurement Analytics Dashboard in Power BI plays a critical role.
In this detailed, SEO-friendly guide, you will learn what a Procurement Analytics Dashboard in Power BI is, why organizations need it, how it works, its page-wise structure, key advantages, best practices, and frequently asked questions. Moreover, the article uses clear language, practical examples, and question-based headings to help both technical and non-technical users.
Click to Purchases Procurement Analytics Dashboard in power BI
What Is a Procurement Analytics Dashboard in Power BI?
A Procurement Analytics Dashboard in Power BI is a centralized, interactive reporting solution designed to track, analyze, and visualize procurement performance metrics in real time.
Instead of reviewing raw purchase data manually, this dashboard converts procurement data into meaningful insights such as actual cost, planned cost, cost variance, lead time, and delivery delays. As a result, procurement managers can quickly identify risks, control spending, and improve supplier performance.
Because the dashboard runs on Power BI, it offers dynamic filters, interactive visuals, and automated updates. Consequently, procurement teams can focus more on strategy and less on manual reporting.
Why Is a Procurement Analytics Dashboard Important?
Procurement directly impacts profitability, cash flow, and operational efficiency. However, many organizations still rely on static reports that fail to show real-time trends. Therefore, decision-makers often react too late.
A Procurement Analytics Dashboard in Power BI solves this problem by delivering instant visibility into procurement performance.
Key Reasons Why Procurement Teams Need This Dashboard
-
Procurement costs form a major portion of total business expenses
-
Cost overruns directly reduce profit margins
-
Supplier delays affect production and customer satisfaction
-
Lack of transparency increases compliance and audit risks
-
Manual reports consume time and increase errors
Because of these challenges, analytics-driven procurement has become essential rather than optional.
How Does a Procurement Analytics Dashboard in Power BI Work?
The dashboard follows a simple and structured workflow:
-
Procurement data gets collected from ERP systems, Excel files, or databases
-
Power BI cleans, models, and organizes the data
-
KPIs and metrics get calculated automatically
-
Interactive visuals display trends, comparisons, and variances
-
Users apply slicers to analyze data by department, category, region, or time
As a result, stakeholders gain actionable insights within seconds.
Page-Wise Structure of the Procurement Analytics Dashboard in Power BI
This Procurement Analytics Dashboard in Power BI includes five well-structured pages, each designed to answer specific business questions.
What Insights Does the Overview Page Provide?
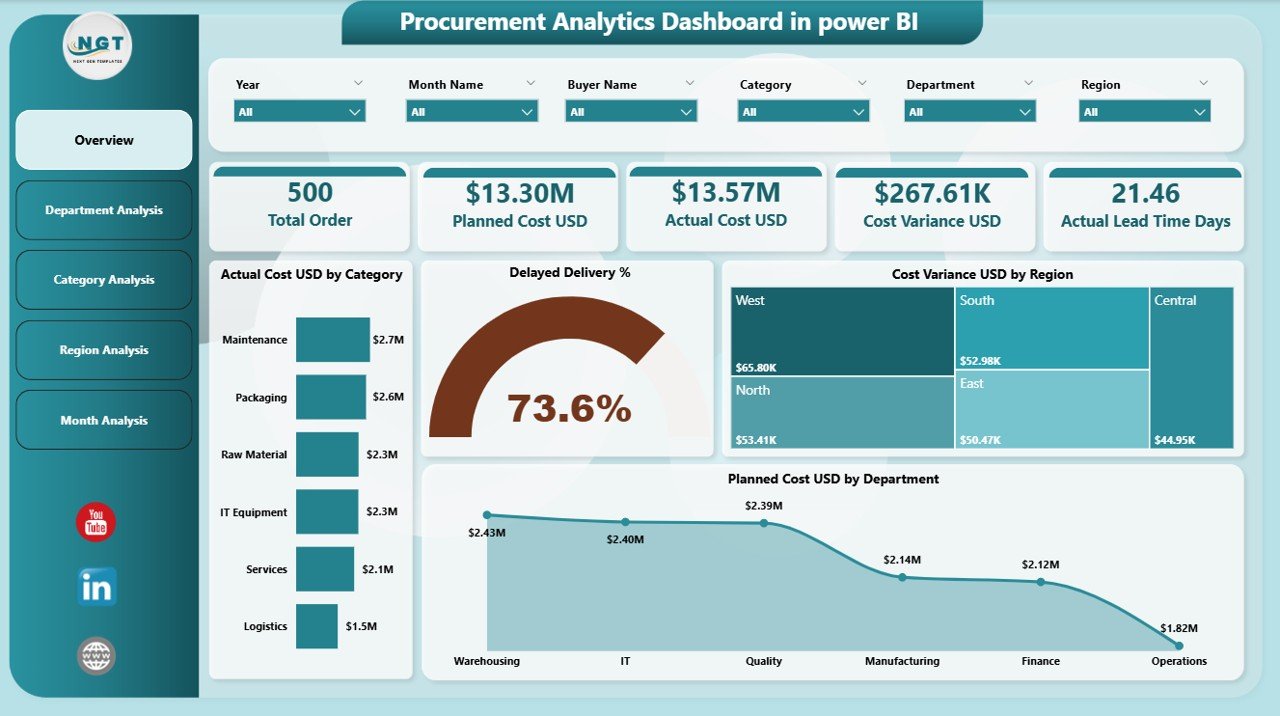
The Overview Page acts as the control center of the entire dashboard. It summarizes procurement performance at a glance.
Key Features of the Overview Page
-
Interactive slicers for quick filtering
-
Four KPI cards for high-level metrics
-
Four charts for cost and delivery analysis
Key Visuals on the Overview Page
-
Actual Cost USD by Category
This chart highlights which procurement categories consume the highest budget. Therefore, managers can identify high-spend areas immediately. -
Delayed Delivery %
This visual shows delivery delays across suppliers or orders. Consequently, procurement teams can take corrective actions early. -
Cost Variance USD by Region
This chart compares actual costs against planned costs across regions. As a result, regional inefficiencies become visible. -
Planned Cost USD by Department
This visual displays budget allocation across departments, helping in financial planning and control.
Because everything appears on a single screen, executives can make quick and informed decisions.
How Does the Department Analysis Page Help Procurement Teams?
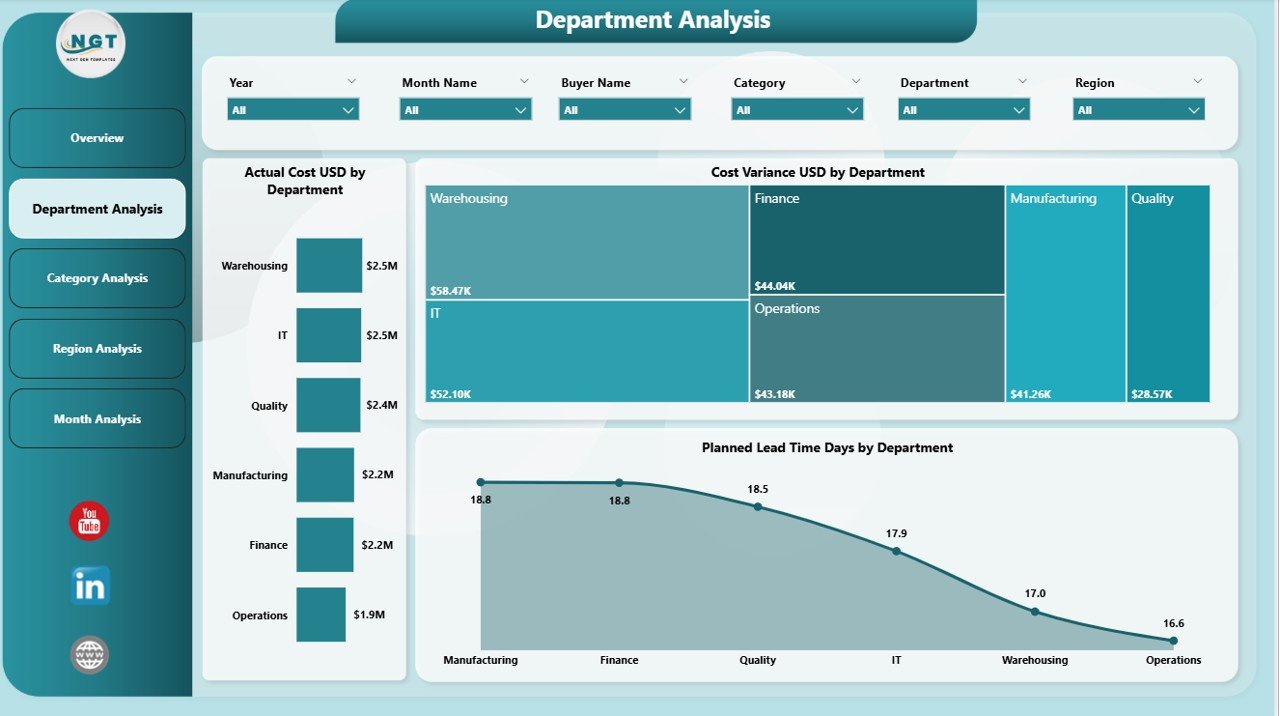
The Department Analysis Page focuses on procurement performance at the departmental level. Therefore, it helps managers understand internal demand patterns and cost behavior.
Key Visuals on the Department Analysis Page
-
Actual Cost USD by Department
This chart highlights which departments generate the highest procurement spend. -
Cost Variance USD by Department
This visual compares planned versus actual costs. As a result, overspending departments become visible instantly. -
Planned Lead Time Days by Department
This chart shows expected lead times, helping teams manage internal delivery expectations.
Because departments influence procurement demand, this page supports better internal coordination and accountability.
Click to Purchases Procurement Analytics Dashboard in power BI
What Does the Category Analysis Page Reveal?
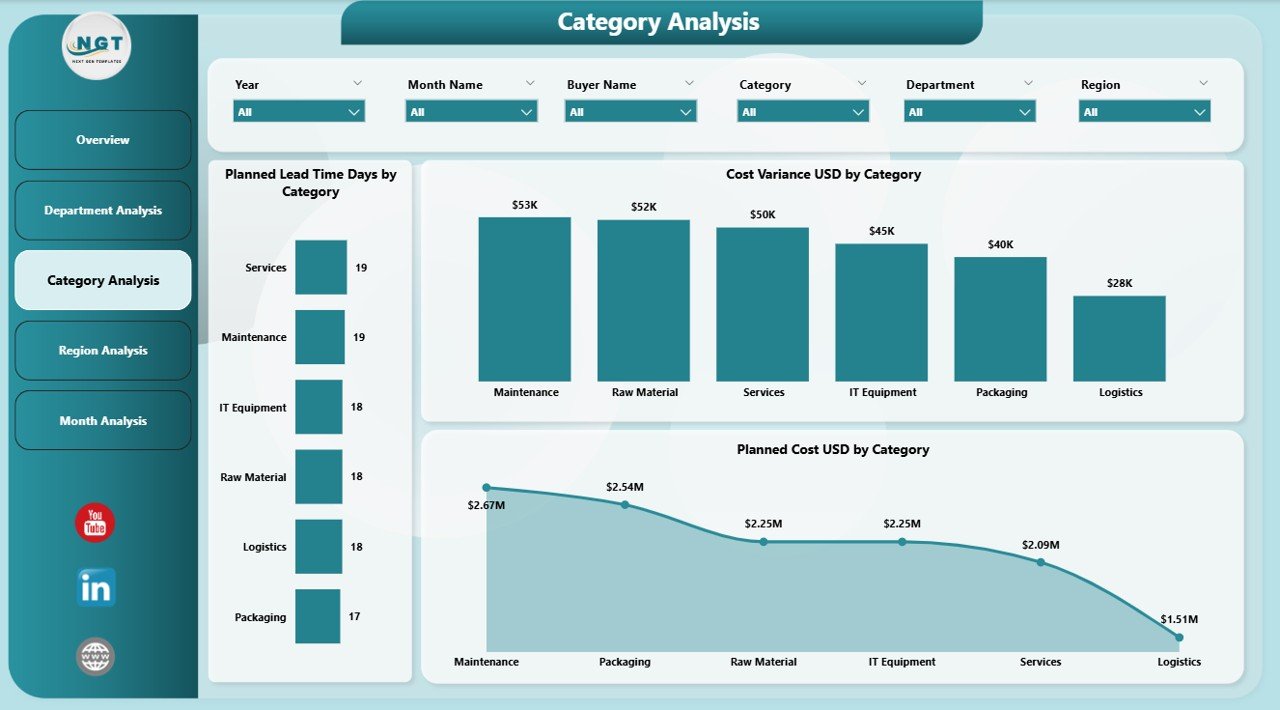
The Category Analysis Page focuses on procurement categories such as raw materials, IT equipment, logistics, or services.
Key Visuals on the Category Analysis Page
-
Planned Lead Time Days by Category
This visual helps teams understand procurement cycle time differences across categories. -
Cost Variance USD by Category
This chart highlights categories where spending deviates from budgets. -
Planned Cost USD by Category
This visual shows budget distribution across procurement categories.
Because categories drive supplier strategy, this page supports smarter sourcing and negotiation decisions.
Why Is Region Analysis Important in Procurement Analytics?
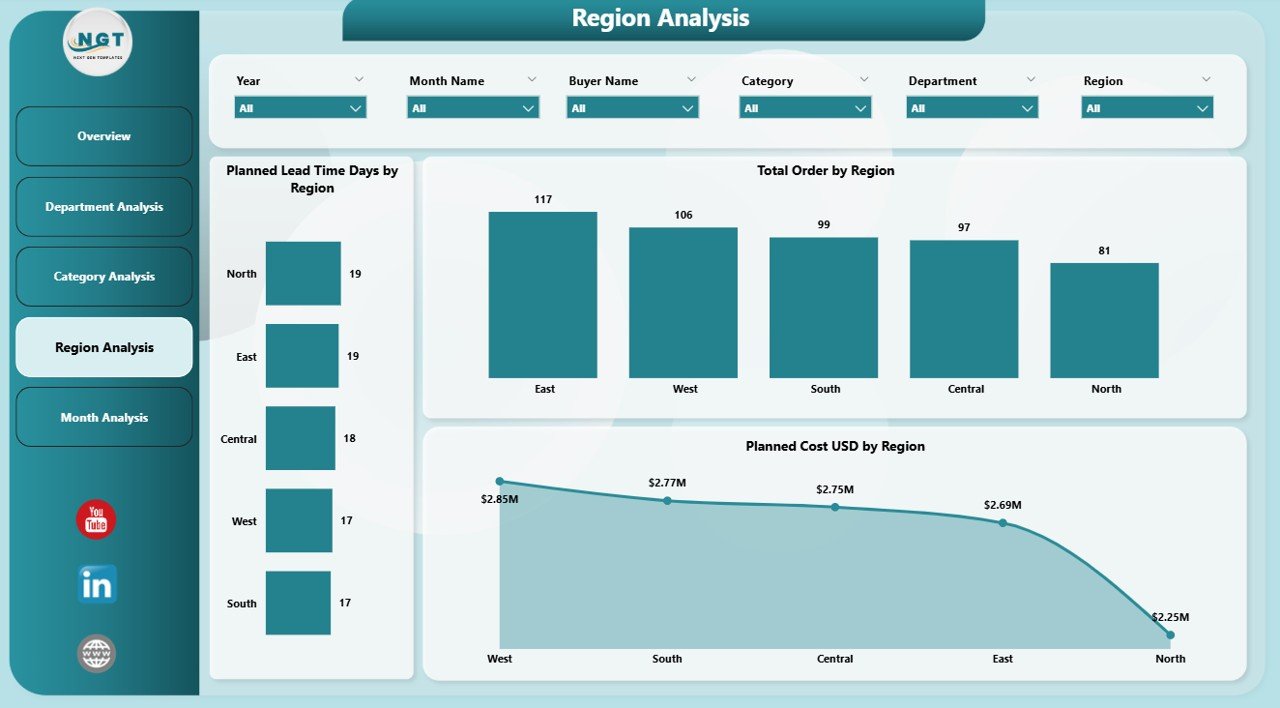
The Region Analysis Page evaluates procurement performance across geographic locations.
Key Visuals on the Region Analysis Page
-
Planned Lead Time Days by Region
This chart highlights logistics and supplier delays by region. -
Planned Cost USD by Region
This visual shows how procurement budgets distribute geographically. -
Actual vs Planned Cost Trends by Region
This comparison helps identify regions with consistent cost overruns.
Since global procurement involves regional complexities, this page ensures better geographic control.
How Does the Monthly Trends Page Support Strategic Planning?
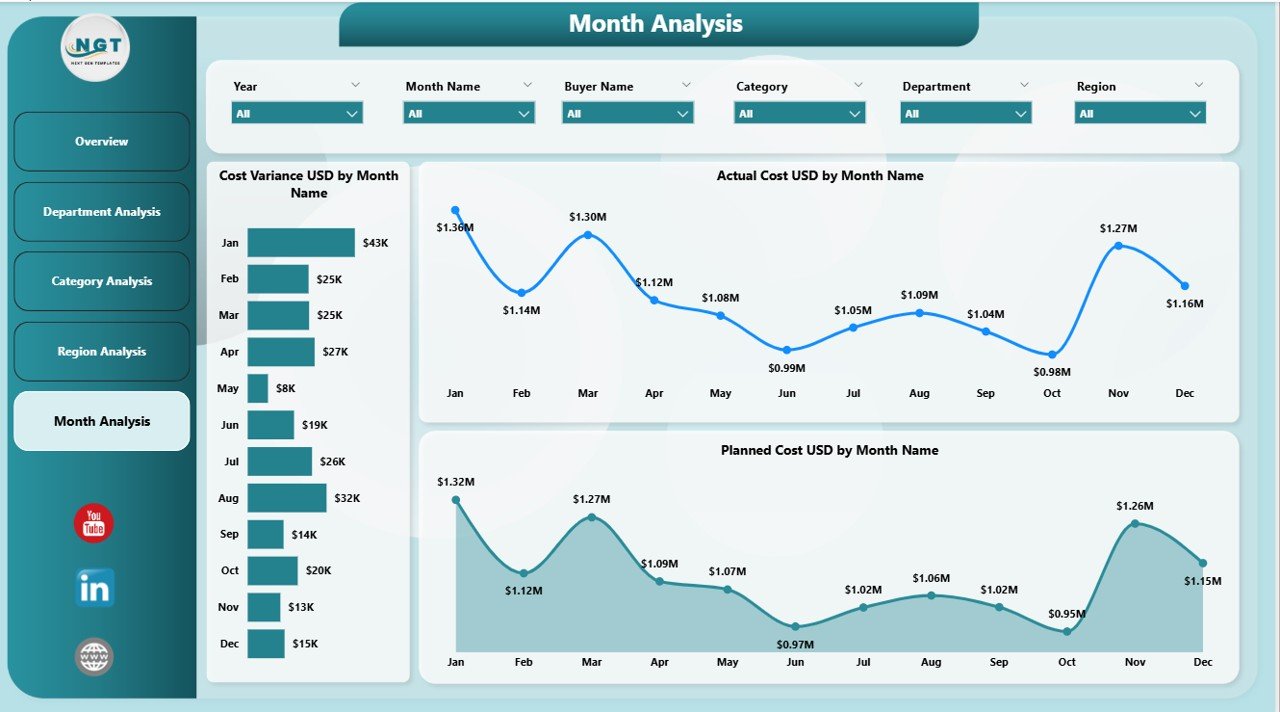
The Monthly Trends Page focuses on time-based performance analysis. Therefore, it helps procurement teams identify seasonality and long-term trends.
Key Visuals on the Monthly Trends Page
-
Cost Variance USD by Month
This chart highlights budget deviations over time. -
Actual Cost USD by Month
This visual shows real spending patterns. -
Planned Cost USD by Month
This chart displays budget planning accuracy.
Because trends matter in forecasting, this page supports long-term procurement planning.
What Are the Key KPIs Tracked in a Procurement Analytics Dashboard?
A Procurement Analytics Dashboard in Power BI typically tracks the following KPIs:
-
Actual Procurement Cost (USD)
-
Planned Procurement Cost (USD)
-
Cost Variance (USD)
-
Delivery Delay Percentage
-
Planned Lead Time (Days)
-
Spend by Department
-
Spend by Category
-
Spend by Region
-
Monthly Cost Trends
These KPIs help organizations monitor cost control, efficiency, and supplier performance.
Advantages of a Procurement Analytics Dashboard in Power BI
Click to Purchases Procurement Analytics Dashboard in power BI
A well-designed dashboard delivers value across the organization. Below are the key advantages.
1. Improved Cost Control
The dashboard highlights cost overruns early. Therefore, teams can take corrective actions before budgets exceed limits.
2. Better Supplier Performance Monitoring
Delivery delays and lead time variations become visible instantly. As a result, supplier accountability improves.
3. Faster and Smarter Decision-Making
Interactive visuals replace static reports. Consequently, decision-makers respond faster.
4. Enhanced Transparency
All stakeholders view the same data. Therefore, trust and alignment increase.
5. Time Savings
Automation eliminates manual reporting. As a result, procurement teams focus on strategic tasks.
Who Should Use a Procurement Analytics Dashboard?
This dashboard benefits multiple roles within an organization:
-
Procurement Managers
-
Supply Chain Leaders
-
Finance Teams
-
Operations Managers
-
Senior Executives
-
Internal Auditors
Because procurement impacts many departments, analytics supports cross-functional collaboration.
How Does Power BI Enhance Procurement Analytics?
Power BI offers several features that make procurement analytics powerful:
-
Interactive slicers and filters
-
Drill-down and drill-through analysis
-
Automated data refresh
-
Cloud and desktop accessibility
-
Strong data visualization capabilities
As a result, procurement analytics becomes scalable and future-ready.
Best Practices for the Procurement Analytics Dashboard in Power BI
To maximize value, organizations should follow proven best practices.
Use Clean and Consistent Data
Ensure standardized supplier names, categories, and regions. Otherwise, insights may become misleading.
Focus on Actionable KPIs
Track metrics that drive decisions rather than vanity numbers.
Design with End Users in Mind
Use simple visuals and clear labels. Therefore, non-technical users can understand insights easily.
Update Data Regularly
Schedule refresh cycles to keep insights current.
Align with Procurement Goals
Customize dashboards based on cost reduction, compliance, or efficiency goals.
Common Challenges in Procurement Analytics and How to Overcome Them
Data Silos
Integrate ERP, finance, and procurement systems into a single data model.
Poor Data Quality
Apply validation rules and data cleaning processes.
Overcomplicated Dashboards
Limit visuals per page and focus on clarity.
Low User Adoption
Provide training and user documentation.
How Does a Procurement Analytics Dashboard Support Cost Savings?
By identifying overspending, inefficient suppliers, and long lead times, the dashboard enables:
-
Better negotiation strategies
-
Supplier consolidation
-
Improved demand planning
-
Reduced emergency purchases
As a result, organizations achieve sustainable cost savings.
Conclusion: Why a Procurement Analytics Dashboard in Power BI Is a Must-Have Tool
A Procurement Analytics Dashboard in Power BI transforms procurement from a reactive function into a strategic advantage. By centralizing data, visualizing performance, and highlighting risks, it empowers organizations to control costs, improve efficiency, and strengthen supplier relationships.
Because procurement directly impacts profitability, analytics-driven insights become essential for long-term success. Therefore, investing in a structured and interactive Power BI dashboard is no longer optional—it is a necessity.
Click to Purchases Procurement Analytics Dashboard in power BI
Frequently Asked Questions (FAQs)
What is a Procurement Analytics Dashboard in Power BI?
It is an interactive reporting solution that tracks procurement costs, variances, lead times, and trends using Power BI visuals.
Who can use a Procurement Analytics Dashboard?
Procurement managers, finance teams, operations leaders, and executives can all use it.
Does this dashboard support real-time data?
Yes, Power BI supports scheduled and near real-time data refreshes.
Can this dashboard work with Excel data?
Yes, Power BI integrates easily with Excel, ERP systems, and databases.
How does this dashboard help reduce procurement costs?
It highlights overspending, delays, and inefficiencies, allowing teams to take timely corrective actions.
Visit our YouTube channel to learn step-by-step video tutorials