Managing project completion efficiently is the cornerstone of successful project management. With numerous moving parts, tight deadlines, and multiple stakeholders involved, it’s crucial to track every aspect of your project in real-time. That’s where the Project Completion Report Tracker in Excel comes into play. This ready-to-use Excel and VBA-based tool makes your tracking process seamless, accurate, and highly visual.
In this article, we’ll walk you through all the essential features, advantages, best practices, and FAQs so that you can make the most of this tool and stay on top of all your project deliverables.
Click to Purchases Project Completion Report Tracker in Excel
What is the Project Completion Report Tracker in Excel?
The Project Completion Report Tracker in Excel is a dynamic, Excel-based tool enhanced with VBA automation. It comes with an easy-to-use login system, data entry form, dashboards, slicers, charts, and user management modules.
This tool helps businesses and project managers to:
- Track project progress
- Compare planned vs. actual timelines
- Analyze budget and cost variances
- Monitor client satisfaction
- Maintain a history of key issues and remarks
And the best part? It requires no advanced Excel skills to operate.
Key Features of the Tracker
Login Form
- Simple User Authentication: Enter your User ID (e.g., Admin1) and password (e.g., abcd).
- Quick Navigation: Pressing enter takes you directly to the main form.
Main Form
- This is your central control hub.
- Navigate to any section of the tracker.
- Includes buttons for dashboard, user management, and data entry form access.
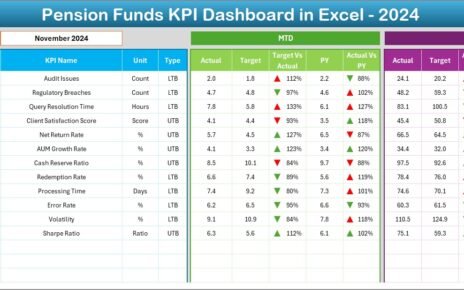
Dashboard Sheet Tab
A visual summary of your project status:
- Slicers: Filter data by Project Manager, Client Name, Status, or Satisfaction.
Charts:
- Bar Chart: Total Cost by Project Manager
- Column Chart: Total Budget by Client Name
- Pie Chart: Number of Projects by Status
- Doughnut Chart: Number of Projects by Client Satisfaction
- Line Chart: Total Budget by Start Date
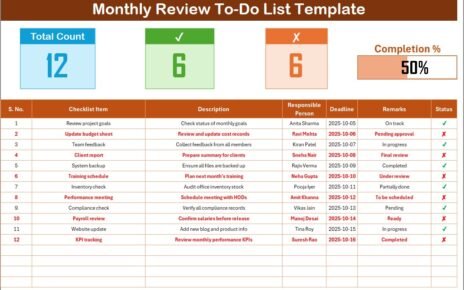
Data Entry Sheet Tab
Track all your project-related details with these columns:
- ID, Project Name, Client Name, Project Manager
- Start Date, End Date, Status, Actual Completion Date
- Budget, Cost, Client Satisfaction, Key Issues, Remarks
Buttons at the Top:
Add New Record:
- Opens a data entry form for quick input.
Click to Purchases Project Completion Report Tracker in Excel
Update Record:
Allows editing existing entries.
- Delete Record: Lets you remove a record with a confirmation prompt.
Manage List Sheet Tab
Maintain lists for drop-down values in forms.
- Items: Client Name, Project Manager, Status, Client Satisfaction, Key Issues.
- Add/Delete options make list maintenance easy.
Support Sheet Tab
- Contains pivot tables that feed the charts on the dashboard.
- No user input needed; can be hidden.
User Management Module
- Add, update, or delete user profiles.
- Change passwords anytime.
Settings Sheet
- Customize default values and drop-downs (like user roles or access levels).
Advantages of Using the Project Completion Report Tracker in Excel
📈 Real-time Project Monitoring: You get a quick visual of how your projects are progressing without digging into rows and rows of data.
💸 Budget vs. Cost Analysis: Identify projects going over budget instantly with color-coded visuals.
🪜 User-friendly Interface: From the login form to dashboard views, the UI is intuitive for non-tech users.
🚀 Fast and Accurate Data Entry: The integrated form ensures error-free input and updates.
🔐 Role-based Access: Restrict access using different login credentials, improving security and accountability.
✏️ Easy Customization: Add more columns, modify drop-downs, or change chart types – it’s your template to tweak!
📆 Best Practices for Using the Project Completion Tracker
✉️ Set up user access properly: Use the User Management module to ensure only authorized personnel can modify project details.
📊 Update your data regularly: Timely updates ensure your dashboard visuals reflect the actual status.
🎓 Train your team: Spend a short session introducing the tool and showing how to add, update, or delete records.
🔄 Back up your file weekly: Although Excel is stable, always save copies to avoid data loss.
📅 Use slicers for quick filtering: Quickly find insights like which Project Manager is handling the most projects or which client has the highest satisfaction scores.
❓ Frequently Asked Questions
Q1. Do I need Excel 365 to use this tool?
A: No, it works smoothly with any modern version of Excel that supports VBA, like Excel 2016 or later.
Q2. Can I customize the charts on the dashboard?
A: Absolutely! You can add new charts or modify existing ones using Excel’s built-in chart tools.
Q3. Is the login system secure?
A: While the login system restricts access within Excel, it’s not encrypted like web applications. It’s ideal for basic project management, not for sensitive corporate data.
Q4. Can I share this file with multiple users?
A: Yes, but only one person should update it at a time if you’re using a shared network or cloud system like OneDrive.
Q5. What happens if I delete a record by mistake?
A: Unfortunately, Excel doesn’t have a built-in undo feature for VBA macros. You should back up the file regularly.
Q6. How do I update dropdown lists?
A: Go to the “Manage List” tab and simply add or delete values. These will appear in the dropdowns of your data entry form.
Q7. Can I track multiple departments or teams?
A: Yes, just add another column for Department or Team and include it in your dashboard filters.
Conclusion
The Project Completion Report Tracker in Excel is more than just a spreadsheet – it’s a complete project management solution. With interactive dashboards, user roles, simple forms, and real-time visuals, you can manage multiple projects effortlessly. Whether you’re a project manager, a business analyst, or an operations lead, this tool can save you time, minimize errors, and boost overall project performance.
Click to Purchases Project Completion Report Tracker in Excel
Visit our YouTube channel to learn step-by-step video tutorials