Project management is all about planning, executing, and delivering projects successfully. To ensure everything runs smoothly, organizations rely on Key Performance Indicators (KPIs). KPIs allow managers to measure performance, identify gaps, and improve results.
But here’s the challenge: managing KPIs manually often becomes time-consuming and confusing. That’s where a Project Management KPI Scorecard in Excel makes a difference. It is a structured, interactive, and easy-to-use template that allows project managers to monitor key metrics, analyze trends, and keep stakeholders updated—all in one place.
In this guide, we’ll explore the structure, features, advantages, best practices, and FAQs about using a Project Management KPI Scorecard in Excel. By the end, you will understand how this tool can transform project performance tracking in your organization.
Click to Purchases Project Management KPI Scorecard in Excel
What Is a Project Management KPI Scorecard in Excel?
A Project Management KPI Scorecard in Excel is a ready-to-use reporting tool that consolidates multiple project performance metrics into a single dashboard. Instead of flipping through reports, you can track KPIs at a glance.
It helps you:
-
Compare Actual vs. Target performance.
-
Monitor Month-to-Date (MTD) and Year-to-Date (YTD) progress.
-
Identify strengths and weaknesses using visual indicators.
-
Analyze KPI trends across months and years.
-
Standardize definitions and calculations of KPIs.
This scorecard is designed for project managers, PMOs, business analysts, and leadership teams who want clear, data-driven insights.
Structure of the Project Management KPI Scorecard in Excel
The template is divided into four key worksheet tabs, each with a unique role:
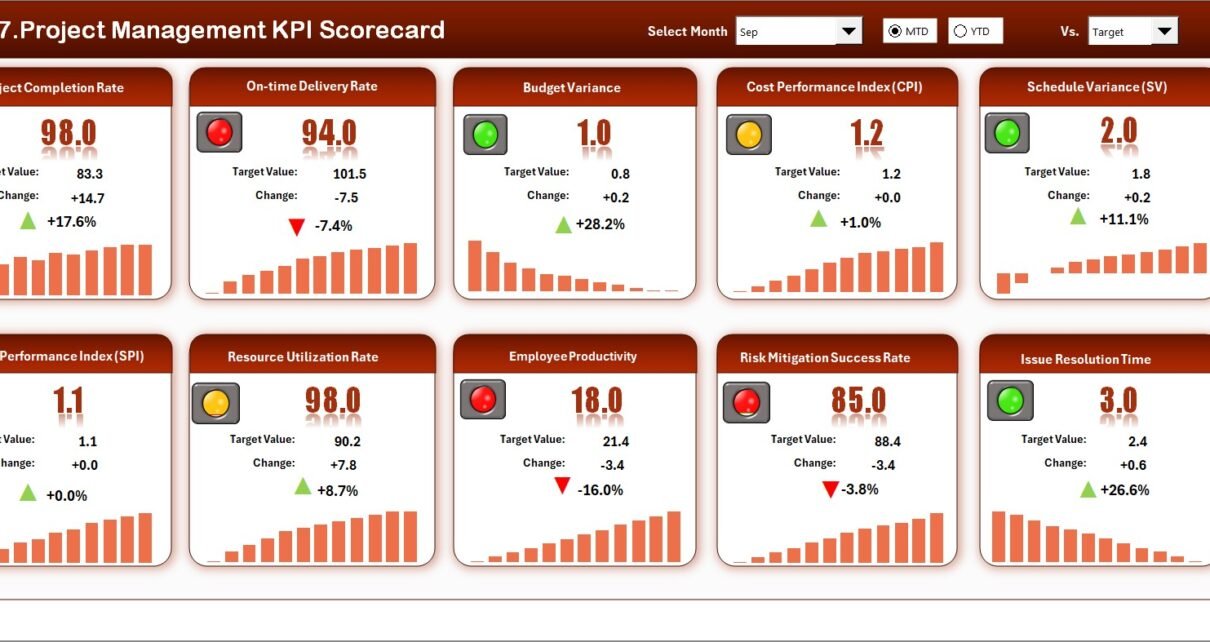
Scorecard Sheet
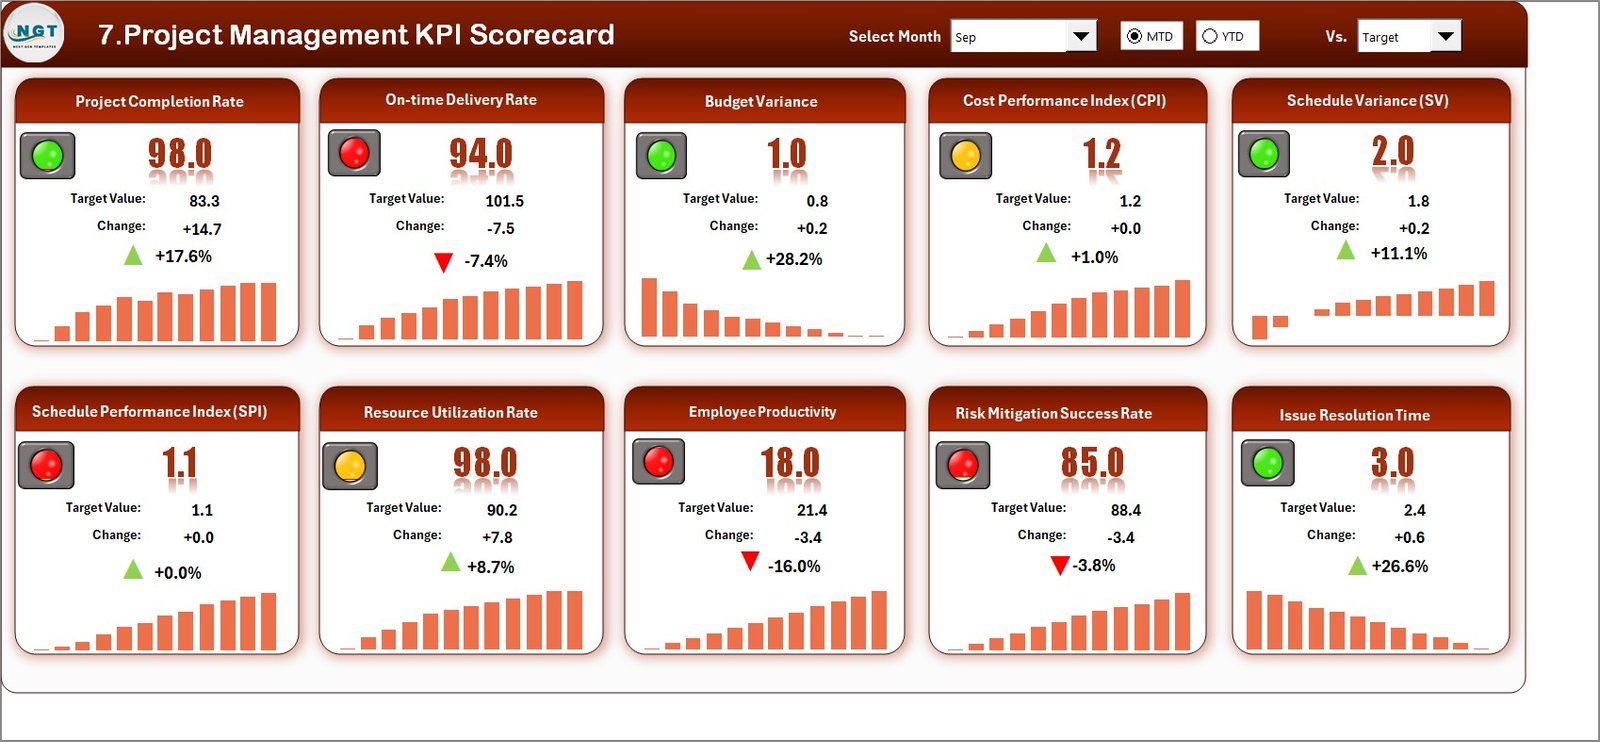
The Scorecard Sheet is the main interface where you analyze KPI performance.
Key Features:
-
Dropdown Menus: Select Month, MTD, or YTD for focused analysis.
-
Actual vs Target: Quickly compare results with defined targets.
-
Visual Indicators: Use color-coded symbols (✔, ✘, arrows, or conditional formatting) to highlight performance.
-
Comprehensive View: All KPIs with actual, target, and variance data in one place.
This sheet acts like a dashboard, making it easy for stakeholders to understand project performance instantly.
KPI Trend Sheet
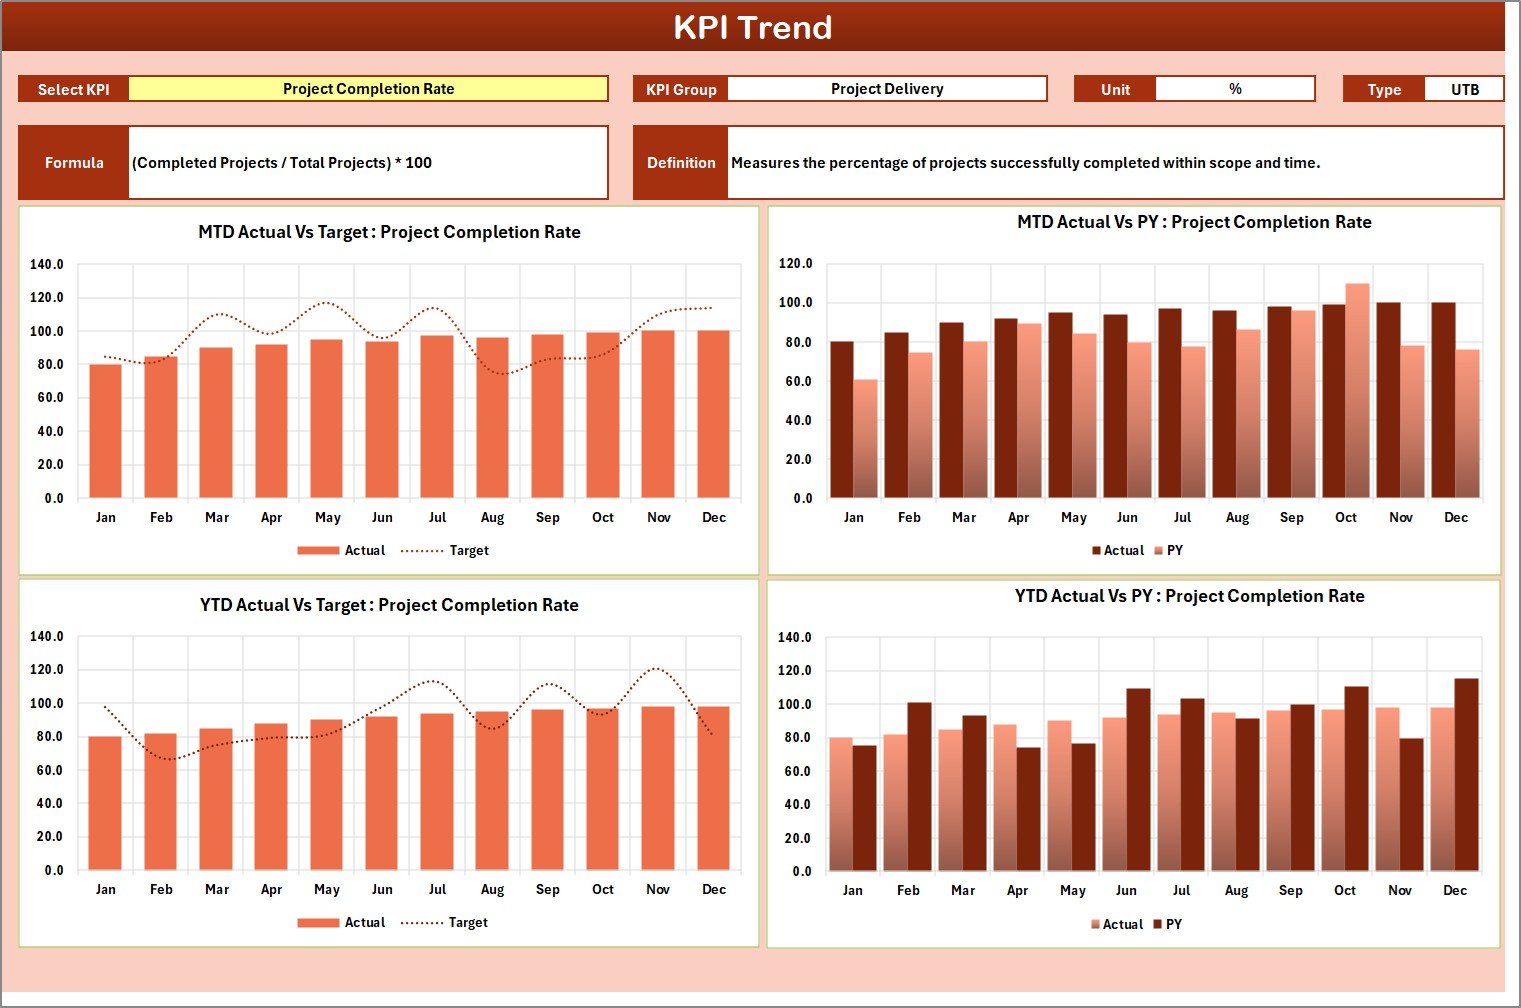
The KPI Trend Sheet adds depth by analyzing performance over time.
Highlights:
-
Dropdown Selection: Choose any KPI from cell C3.
-
Details Section: Shows KPI Group, Unit, Type (Lower the Better or Upper the Better), Formula, and Definition.
-
Trend Charts: Displays MTD and YTD trends for Actual, Target, and Previous Year (PY).
This sheet is ideal for project managers who need to spot patterns, improvements, or recurring challenges in project performance.
Click to Purchases Project Management KPI Scorecard in Excel
Input Data Sheet
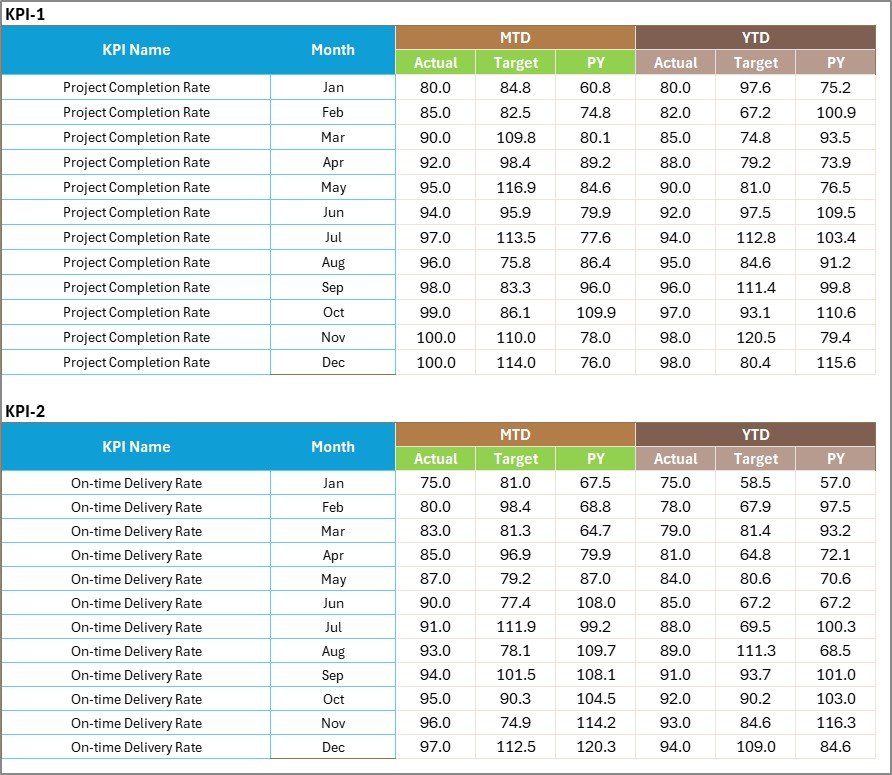
The Input Data Sheet is the backbone of the scorecard.
Key Features:
-
Data Entry Section: Enter actual KPI values, targets, and other metrics.
-
Flexibility: Easy to update as new data comes in.
-
Centralized Input: Keeps all numbers consistent across all sheets.
This ensures the entire system runs smoothly without errors or duplications.
KPI Definition Sheet
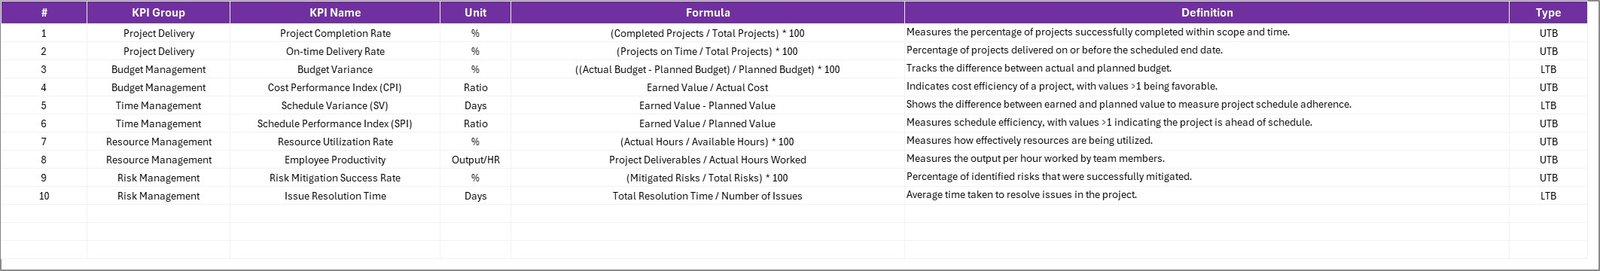
Every KPI needs a clear definition so there’s no confusion among teams.
Contents of this Sheet:
-
KPI Name
-
KPI Group
-
Unit of Measurement
-
Formula
-
KPI Definition
This sheet ensures that all team members and stakeholders speak the same language when discussing KPIs.
Why Do You Need a KPI Scorecard in Project Management?
Project managers juggle multiple responsibilities, and without the right tool, things can slip through the cracks.
A KPI Scorecard helps you:
-
Monitor Performance: Stay updated on project health.
-
Improve Accountability: Assign responsibility to individuals or teams.
-
Track Progress: See whether projects are on track or delayed.
-
Align with Goals: Ensure every project supports business objectives.
-
Communicate Clearly: Share data-driven insights with stakeholders.
In short, it simplifies project reporting while improving decision-making.
Advantages of Project Management KPI Scorecard in Excel
Here are the top benefits of using this scorecard:
-
Centralized Dashboard: One-stop view of all project KPIs.
-
Time-Saving: No need to build complex dashboards from scratch.
-
Customizable: Adjust KPIs, formulas, and charts to match your needs.
-
Interactive & Dynamic: Use dropdowns and filters for quick insights.
-
Cost-Effective: No expensive software required—Excel does it all.
-
Improved Accuracy: Standardized formulas reduce human errors.
-
Better Communication: Easy-to-read visuals enhance reporting to leadership.
Opportunities for Improvement in KPI Scorecards
Even though Excel scorecards are powerful, there are areas where you can improve them further:
-
Automation: Use Excel VBA or Power Query for automated updates.
-
Integration: Connect Excel with project management tools like MS Project, Jira, or Trello.
-
Visualization: Add more advanced visuals using Power BI if needed.
-
Collaboration: Use Google Sheets for real-time updates with distributed teams.
-
Scalability: As projects grow, ensure the KPI list expands logically.
Best Practices for the Project Management KPI Scorecard
To make the most of your KPI scorecard, follow these best practices:
-
Define Clear KPIs: Only track what matters. Avoid clutter.
-
Set Realistic Targets: Targets should be challenging yet achievable.
-
Update Regularly: Refresh data frequently for accurate reporting.
-
Use Visual Indicators: Color codes, arrows, and charts improve readability.
-
Involve Stakeholders: Get input from leadership and teams while defining KPIs.
-
Focus on Actionable Insights: Don’t just track data—use it to improve.
-
Maintain Consistency: Keep KPI definitions and formulas standardized.
Example KPIs to Include in a Project Management Scorecard
Here are some commonly used KPIs you can include:
-
Project Completion % – Measures progress vs. planned schedule.
-
Budget Variance % – Tracks spending against approved budget.
-
Resource Utilization % – Analyzes workforce allocation.
-
On-Time Delivery % – Checks how many tasks meet deadlines.
-
Change Request Count – Tracks scope changes during execution.
-
Risk Mitigation Effectiveness % – Evaluates how well risks are managed.
-
Client Satisfaction Score – Captures customer feedback.
Conclusion
A Project Management KPI Scorecard in Excel is a practical, cost-effective, and highly customizable tool for tracking project performance. With its structured design—Scorecard Sheet, KPI Trend, Input Data, and KPI Definition—it empowers managers to make data-driven decisions and improve project outcomes.
When used with best practices, this tool ensures timely delivery, controlled budgets, and improved communication with stakeholders.
If you want to enhance your project management performance, adopting a KPI Scorecard in Excel is one of the smartest steps you can take.
Frequently Asked Questions (FAQs)
1. What is a KPI Scorecard in Project Management?
A KPI Scorecard in Project Management is a tool to track and analyze key project performance indicators like cost, time, scope, and quality in a single dashboard.
2. Why use Excel for a KPI Scorecard?
Excel is widely accessible, cost-effective, and flexible. You can customize it easily and use features like formulas, charts, and conditional formatting.
3. How often should I update the KPI Scorecard?
You should update it regularly—weekly or monthly—depending on your reporting needs. Timely updates keep performance tracking accurate.
4. Can I customize the KPIs in the scorecard?
Yes. You can add, remove, or modify KPIs, formulas, and charts according to your project requirements.
5. How is this different from a dashboard?
A dashboard is usually more visual and dynamic, often created in tools like Power BI. A scorecard in Excel focuses on structured reporting with clear comparisons of actual vs. target performance.
6. Can I share the KPI Scorecard with my team?
Yes. You can share the file via email, shared drives, or use cloud platforms like Google Drive or OneDrive for collaborative updates.
Visit our YouTube channel to learn step-by-step video tutorials