Railway equipment manufacturing is a high-detail environment where work orders, plant output, supplier quality, material cost, labor cost, machine hours, rework, and downtime all affect delivery performance. Even a small increase in defects or rework can delay assemblies, increase cost, and reduce confidence in production planning.
The Railway Equipment Manufacturing Dashboard in Excel gives manufacturing teams a ready-to-use reporting workbook for tracking production, quality, cost, and operations performance in one place. It includes 7 Excel sheet tabs, 4 high-level KPI cards, multiple slicers, 18 focused charts, a structured data sheet, and a support sheet powered by pivot tables.
Click here to download the Railway Equipment Manufacturing Dashboard in Excel.
This guide explains what is inside the template, how each page works, which charts are included, who should use it, and how it compares with Google Sheets and paid manufacturing software. For teams that already use Microsoft Excel, this dashboard provides a practical reporting layer without a long system implementation. You can also review Microsoft guidance for working with Excel tables and structured data on Microsoft Excel Support.
Key Features of Railway Equipment Manufacturing Dashboard in Excel
- 7 Excel sheets for Overview, Production, Quality, Cost Analysis, Operations, Data, and Support.
- 4 executive KPI cards for Total Work Orders, Total Material Cost, Total Labor Cost, and Defect Rate %.
- Multiple slicers to filter the dashboard quickly by plant, equipment category, supplier, shift, production line, status, supervisor, and period.
- Production tracking for units produced, rework units, machine hours, shift output, and work order status.
- Quality analysis for defect rate, defect units, component issues, supplier performance, and average quality score.
- Cost analysis for labor cost and material cost by plant, equipment category, production line, and supplier.
- Operations review for downtime hours, supervisor output, and quarterly production patterns.
- Refreshable support sheet with pivot tables that update the dashboard after users refresh the workbook.
Dashboard Pages Explanation
Overview Page
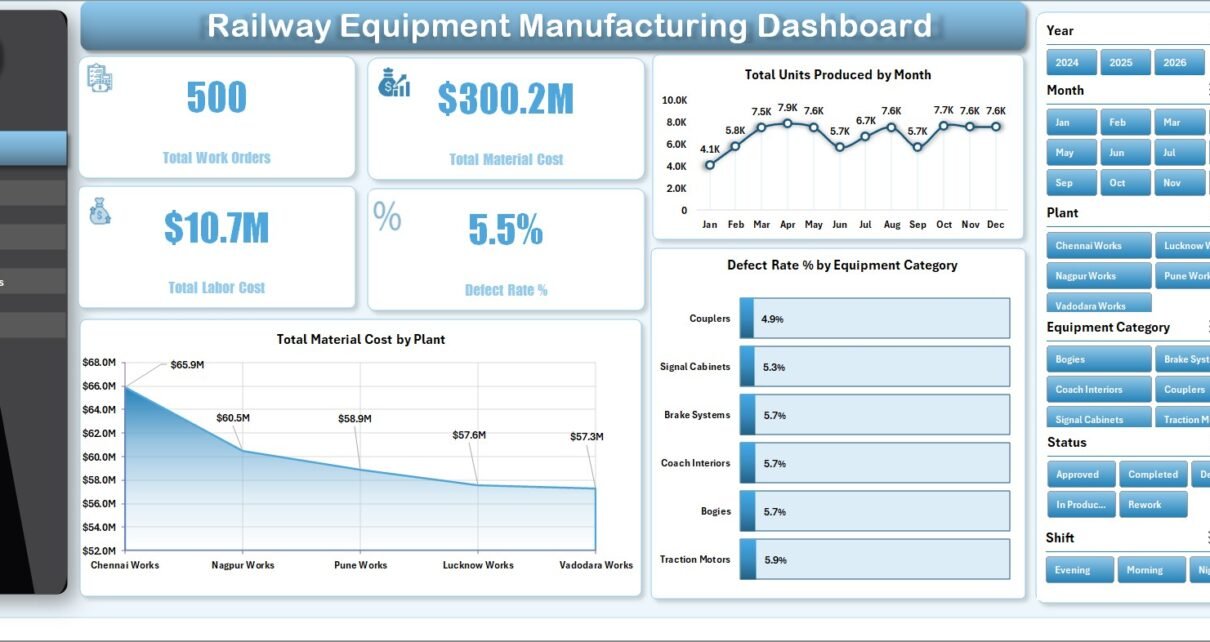
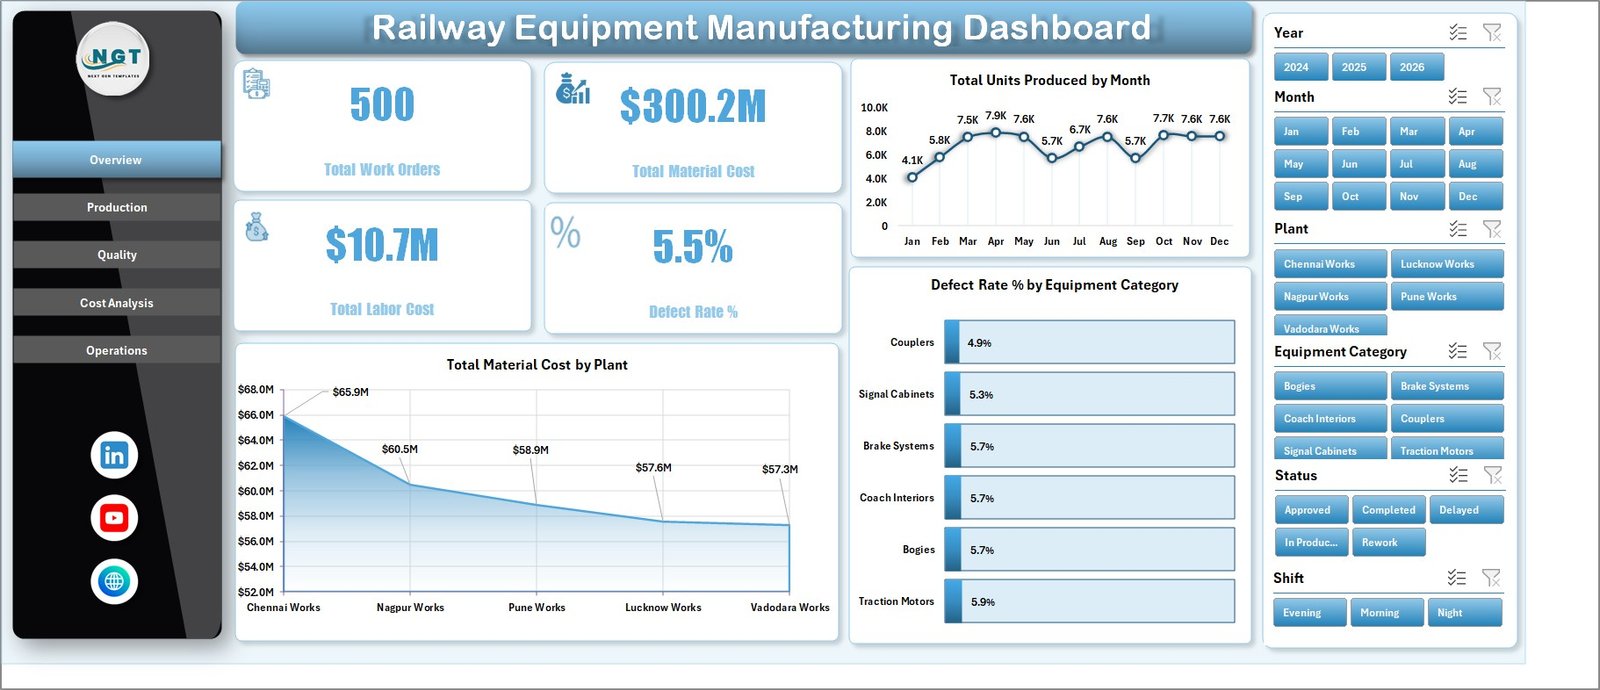
The Overview Page is the executive summary of the workbook. At the top, it shows Total Work Orders, Total Material Cost, Total Labor Cost, and Defect Rate %. These cards help managers check whether order volume, spending, and quality risk are moving in the right direction.
Total Units Produced by Month: This chart shows production movement month by month. It helps planners identify peak months, low-output periods, and possible seasonality in railway equipment manufacturing demand.
Total Material Cost by Plant: This chart compares material spend across plants. It supports plant-level cost review and helps procurement teams identify locations where component cost may need deeper investigation.
Defect Rate % by Equipment Category: This chart highlights which equipment categories have higher defect percentages. Quality teams can use it to focus inspection, rework prevention, and supplier follow-up.
Railway Equipment Manufacturing Dashboard in Excel
Production Page
The Production sheet focuses on output and execution. It includes Total Rework Units by Plant, Total Machine Hours by Production Line, Total Units Produced by Shift, and Total Work Orders by Status.
This page helps production managers see which plants generate more rework, which lines consume more machine hours, how shifts compare on output, and how many work orders are in each status. It is useful for daily production reviews and weekly plant meetings.
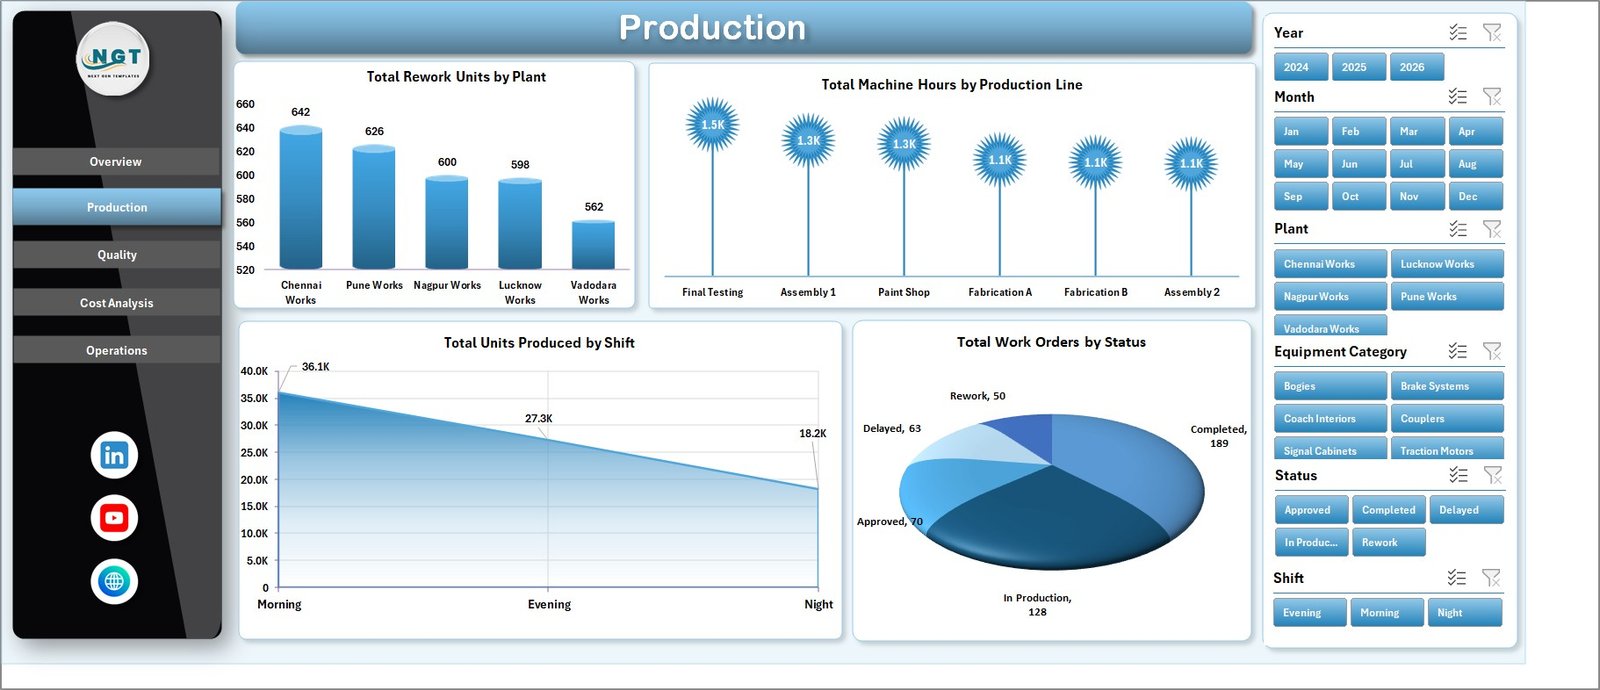
Production
Quality Page
The Quality sheet includes Total Labor Cost by Equipment Category, Defect Rate % by Component, Total Defect Units by Supplier, and Avg. Quality Score by Month.
This view connects quality performance with cost and supplier reliability. The defect rate by component helps teams locate recurring component-level problems, while defect units by supplier can support supplier scorecards and corrective action discussions.
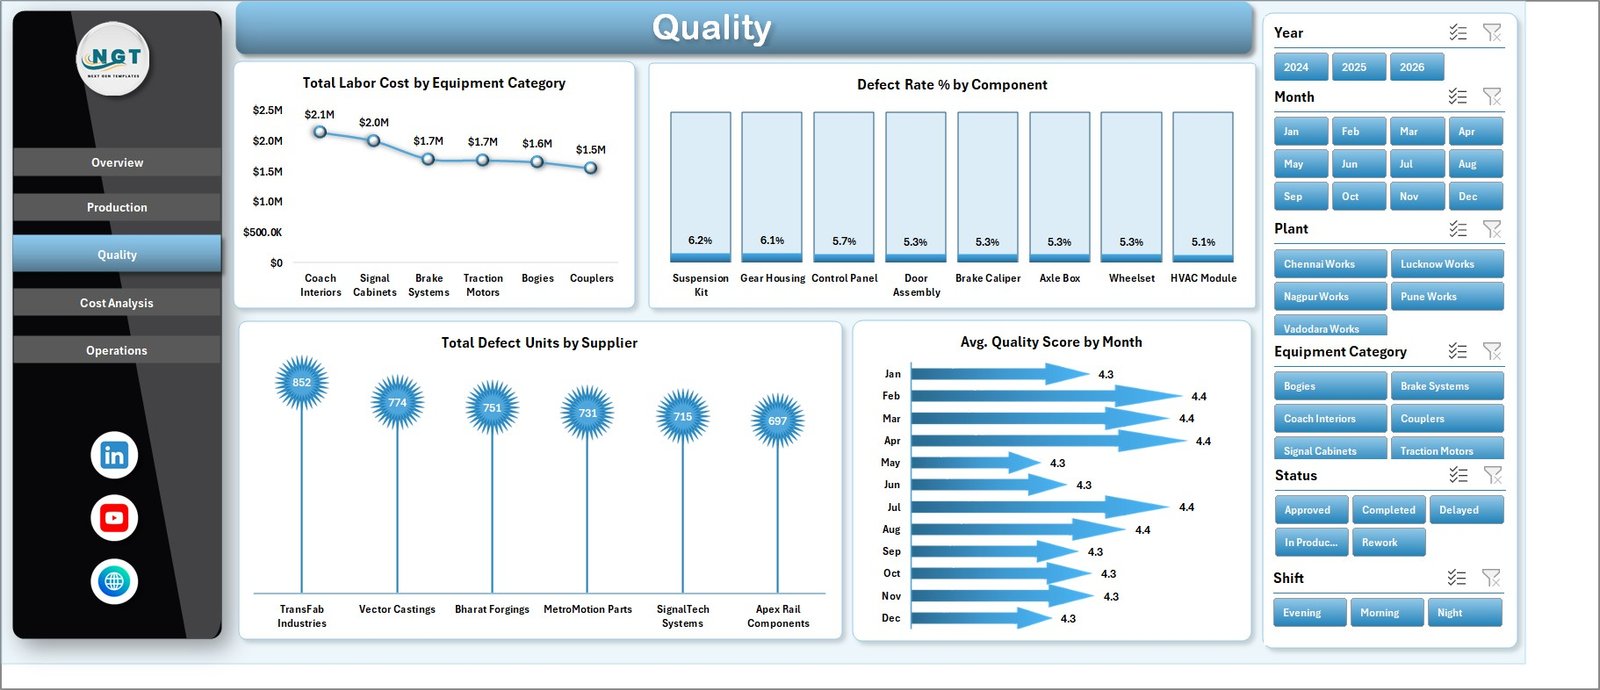
Quality
Cost Analysis Page
The Cost Analysis sheet contains Total Labor Cost by Plant, Total Material Cost by Equipment Category, Total Labor Cost by Production Line, and Total Material Cost by Supplier.
Finance and operations users can compare the largest cost drivers across plants, lines, categories, and suppliers. This is helpful when teams need to explain cost variance, review vendor pricing, or identify production lines where labor demand is rising.
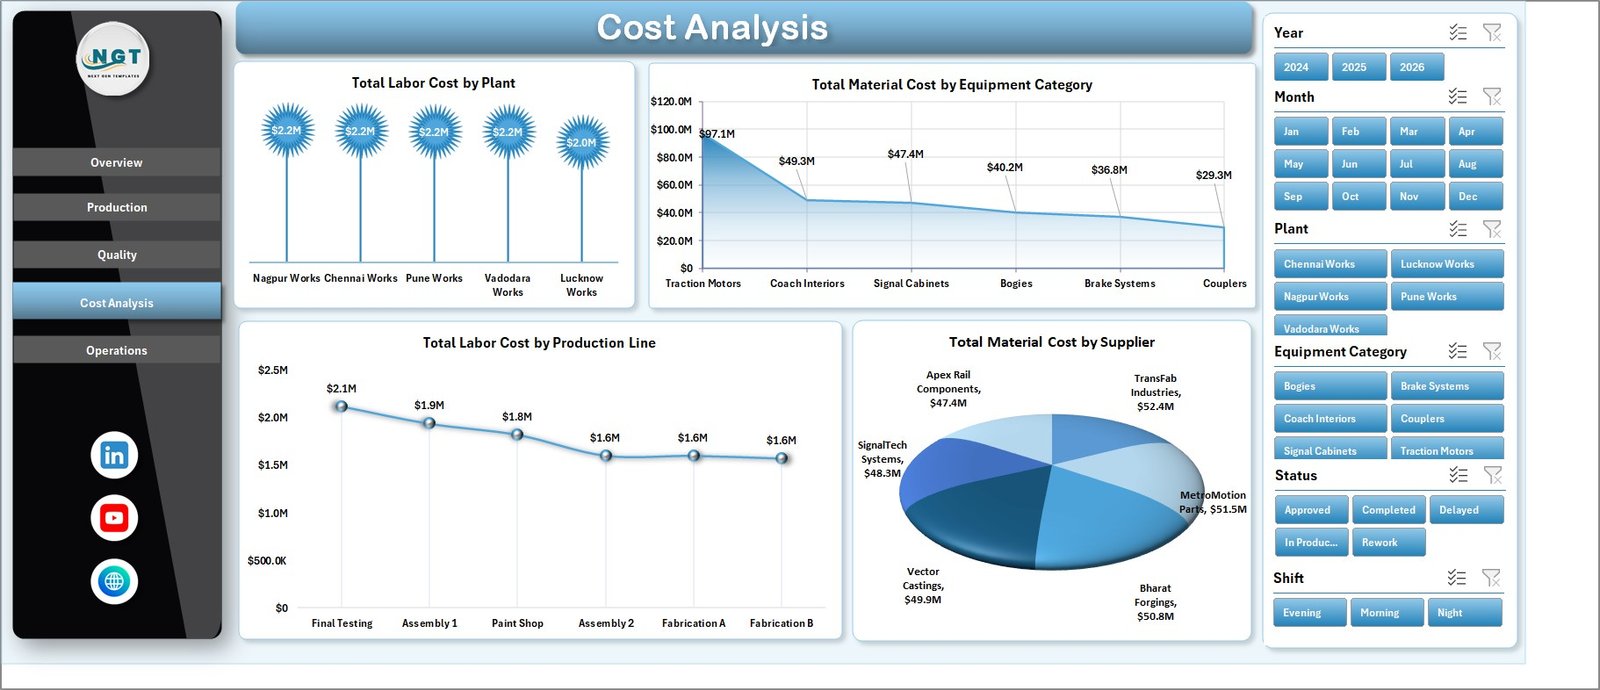
Cost Analysis
Operations Page
The Operations sheet includes Total Downtime Hours by Shift, Total Units Produced by Supervisor, and Total Units Produced by Quarter.
Operations leaders can use this page to compare downtime patterns, supervisor-level output, and quarterly production direction. If one shift carries more downtime or one quarter shows weaker output, the page gives a starting point for deeper investigation.
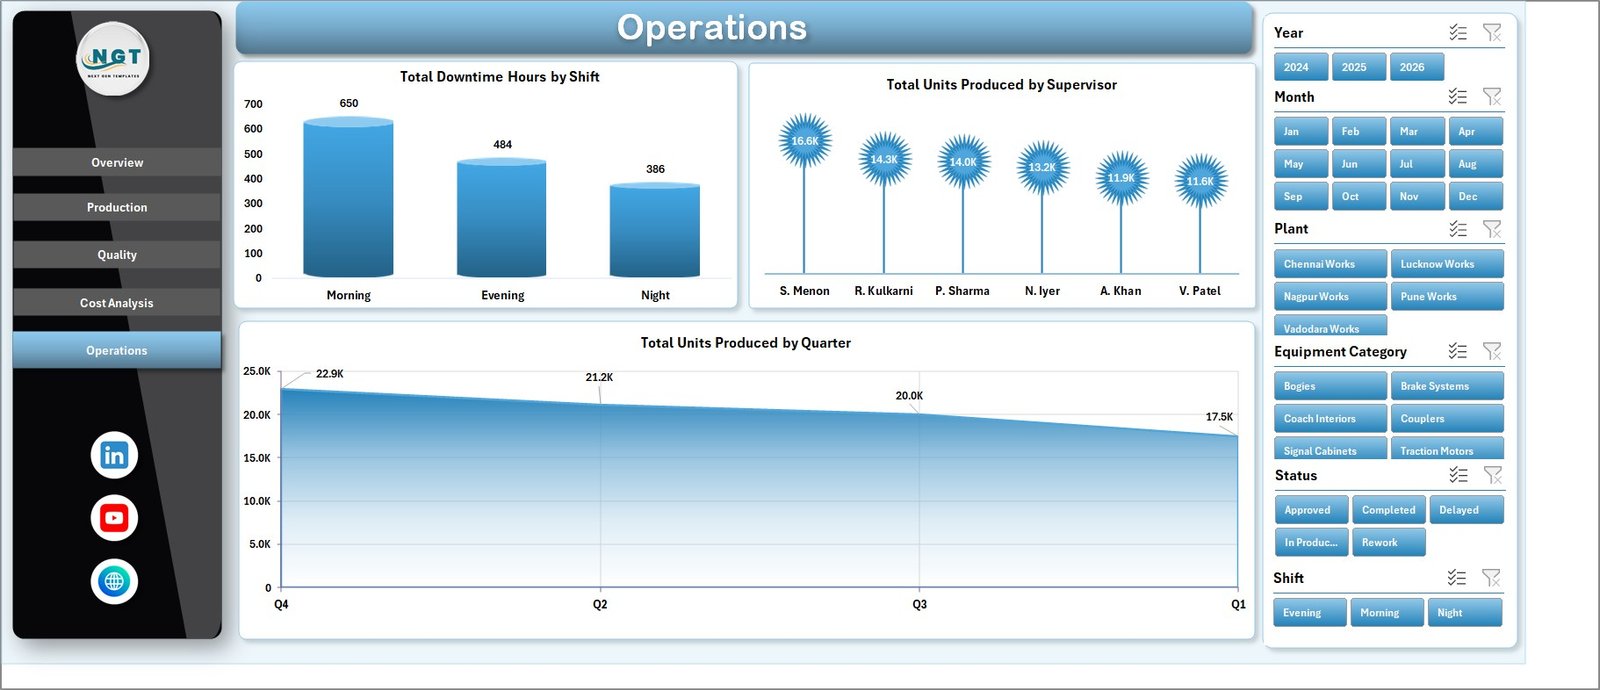
Operations
Data Sheet Tab
The Data sheet is where users add railway equipment manufacturing records in the same format as the sample data. Keeping the same columns and structure allows the dashboard formulas, pivots, slicers, and charts to continue working correctly.

Data Sheet tab
Support Sheet Tab
The Support sheet contains multiple pivot tables used to create the full dashboard dynamically. After updating the Data sheet, users can go to the Data tab in the Excel Ribbon and click Refresh All. The pivots and charts refresh together. During normal use, this sheet can be kept hidden.

Support sheet tab
Railway Equipment Manufacturing Dashboard in Excel vs. Google Sheets vs. Paid CRM/SaaS – Feature Comparison
| Feature | Railway Equipment Manufacturing Dashboard in Excel | Google Sheets alternative | Paid manufacturing SaaS |
|---|---|---|---|
| Cost | $17.99 one-time | Free sheet plus build time | Monthly or annual subscription |
| Platform | Microsoft Excel | Google Sheets | Vendor cloud system |
| Setup time | Replace sample data and refresh | Build pivots, charts, and formulas | Implementation project |
| Real-time team collaboration | Possible with OneDrive or SharePoint | Native | Usually included |
| Mobile access | Excel mobile for review or light editing | Google Sheets app | Vendor mobile app or browser |
| Customizable fields | Fully editable workbook | Editable if designed well | Limited by vendor settings |
| Railway production metrics | Built in | Custom build required | Depends on product fit |
| Year-1 cost at 5 users | $17.99 total | Workspace fees plus setup time | Often hundreds or thousands of dollars |
Who Should Use This Template
This dashboard is useful for production managers, plant heads, operations managers, quality teams, manufacturing analysts, procurement teams, finance controllers, railway equipment suppliers, and supervisors who need quick reporting from structured Excel data.
It is especially helpful for teams that already export data from ERP, production logs, quality logs, or work order systems into spreadsheets. Instead of building charts from scratch every month, users can maintain the data structure and refresh the dashboard.
Real-World Use Cases
Plant Manager: A plant manager reviews Total Work Orders, Total Units Produced by Month, and Total Material Cost by Plant before a weekly review meeting.
Quality Lead: A quality lead studies Defect Rate % by Component and Total Defect Units by Supplier to decide which suppliers need follow-up.
Cost Controller: A cost controller compares labor and material costs by plant, line, category, and supplier before monthly variance reporting.
Advantages of Railway Equipment Manufacturing Dashboard in Excel
- Works in familiar Microsoft Excel, so teams do not need a new reporting platform.
- Combines production, cost, quality, and operations views in one workbook.
- Uses slicers for quick filtering instead of manual report rebuilding.
- Includes a dedicated data sheet, making updates easier to standardize.
- Uses pivot tables on the support sheet so the dashboard can refresh dynamically.
- Can be edited, expanded, hidden, protected, or customized according to internal reporting needs.
Opportunities for Improvement
Teams can expand the workbook further by adding targets, budget variance, safety KPIs, supplier scorecards, OEE metrics, on-time delivery rate, or inspection cycle time. If the organization has a stable ERP export, the Data sheet can also be standardized around that export to reduce manual cleaning.
Best Practices
- Keep the Data sheet format consistent when adding new records.
- Refresh all pivot tables after updating the data.
- Use consistent names for plants, suppliers, supervisors, shifts, components, and production lines.
- Review defect rate and rework units together, because both indicate quality cost.
- Protect formula and support areas if multiple users update the file.
- Keep the Support sheet hidden for normal dashboard users.
Explore Relevant Templates
You may also like the Chemical Manufacturing KPI Dashboard in Excel, Manufacturing Dashboard in Excel, and the COO Operations Director Toolkit. You can browse more in the Excel Dashboard templates category.
Frequently Asked Questions
What is the Railway Equipment Manufacturing Dashboard in Excel?
It is a ready-to-use Excel dashboard template for tracking railway equipment manufacturing production, work orders, costs, defects, suppliers, shifts, downtime, supervisors, and quality performance.
How many sheets are included?
The workbook includes 7 sheet tabs: Overview, Production, Quality, Cost Analysis, Operations, Data, and Support.
What KPI cards are shown on the Overview page?
The Overview page includes Total Work Orders, Total Material Cost, Total Labor Cost, and Defect Rate %.
Can I use my own data?
Yes. Add or replace records in the Data sheet using the same format, then refresh the workbook.
Do I need advanced Excel knowledge?
No. Basic Excel knowledge is enough for normal use. Advanced users can further customize charts, formulas, and pivot tables.
Can I hide the Support sheet?
Yes. The Support sheet contains pivot tables used by the dashboard and can be hidden during regular use.
Does this replace ERP or MES software?
No. It is a reporting template, not a transaction system. It works well as a dashboard layer for exported or manually maintained production data.
About the Author
Built by PK – Microsoft Certified Professional with 15+ years of Excel, Google Sheets, and Power BI experience. Founder of NextGenTemplates, reaching 300K+ subscribers across YouTube channels. Every template is hand-built and tested before release.
Conclusion
The Railway Equipment Manufacturing Dashboard in Excel gives manufacturing teams a practical way to review work orders, production output, material cost, labor cost, defect rate, rework, downtime, supplier quality, and operations performance without starting from a blank workbook.
Because the dashboard is built in Excel, it fits teams that need fast reporting, editable structure, and a one-time purchase model. Update the Data sheet, refresh the pivots, use slicers, and review the dashboard pages for production, quality, cost, and operations decisions.
Visit our YouTube channel to learn step-by-step video tutorials: Youtube.com/@PKAnExcelExpert.