In today’s fast-moving real estate market, decisions based on assumptions no longer work. Investors, developers, brokers, and property managers now need clear, data-driven insights to evaluate property value, rental performance, and market trends accurately. That is exactly where a Real Estate Valuation Dashboard in Power BI becomes a powerful and practical solution.
Instead of managing scattered spreadsheets, manual calculations, and delayed reports, this dashboard converts real estate data into interactive visuals, KPIs, and trends. As a result, decision-makers gain instant clarity and confidence.
This detailed article explains what a Real Estate Valuation Dashboard in Power BI is, why it matters, how it works, its page-wise structure, key features, advantages, best practices, and frequently asked questions. Moreover, the language remains simple, the flow stays logical, and the structure supports strong SEO performance.
Click to Purchases Real Estate Valuation Dashboard in Power BI
What Is a Real Estate Valuation Dashboard in Power BI?
A Real Estate Valuation Dashboard in Power BI is an interactive analytics solution that tracks, analyzes, and visualizes property valuation, rental income, and market performance using structured data.
Instead of reviewing raw Excel tables, users view clear charts, KPI cards, and trend analysis inside a Power BI report. Consequently, stakeholders understand property value distribution, regional performance, segment behavior, and monthly trends instantly.
Moreover, this dashboard supports data-driven valuation, which improves investment decisions, pricing strategy, and portfolio performance.
Why Do Real Estate Businesses Need a Valuation Dashboard?
Real estate data grows rapidly. However, without proper analysis, data creates confusion instead of clarity. Therefore, organizations need a centralized valuation dashboard.
Key reasons why this dashboard is essential:
-
Real estate portfolios include multiple cities, regions, and property types
-
Property valuation changes frequently due to market conditions
-
Rental income varies across segments and locations
-
Manual valuation analysis causes errors and delays
Because of these challenges, a Real Estate Valuation Dashboard in Power BI provides real-time insights, structured analysis, and interactive reporting.
How Does a Real Estate Valuation Dashboard in Power BI Work?
This dashboard uses Excel or structured data sources as its backend. Power BI then connects to this data and applies calculations, filters, and visuals.
Typical workflow:
-
Property and valuation data gets stored in Excel
-
Power BI imports the data model
-
KPIs, measures, and calculations process valuation metrics
-
Interactive visuals display insights across multiple pages
-
Slicers allow dynamic filtering by city, region, segment, or time
As a result, users analyze data from multiple perspectives without writing complex formulas repeatedly.
What Data Does a Real Estate Valuation Dashboard Use?
A well-designed dashboard relies on structured and clean data. Typically, the dataset includes:
-
Property ID
-
Property Type
-
Segment
-
City
-
Region
-
Sale Price USD
-
Rental Income per Month USD
-
Furnishing Status
-
Property Condition
-
Under Offer Status
-
Valuation Date
Because of this structured approach, Power BI creates fast and accurate insights.
Page-Wise Structure of the Real Estate Valuation Dashboard in Power BI
This dashboard includes five professionally designed pages, each serving a unique analytical purpose.
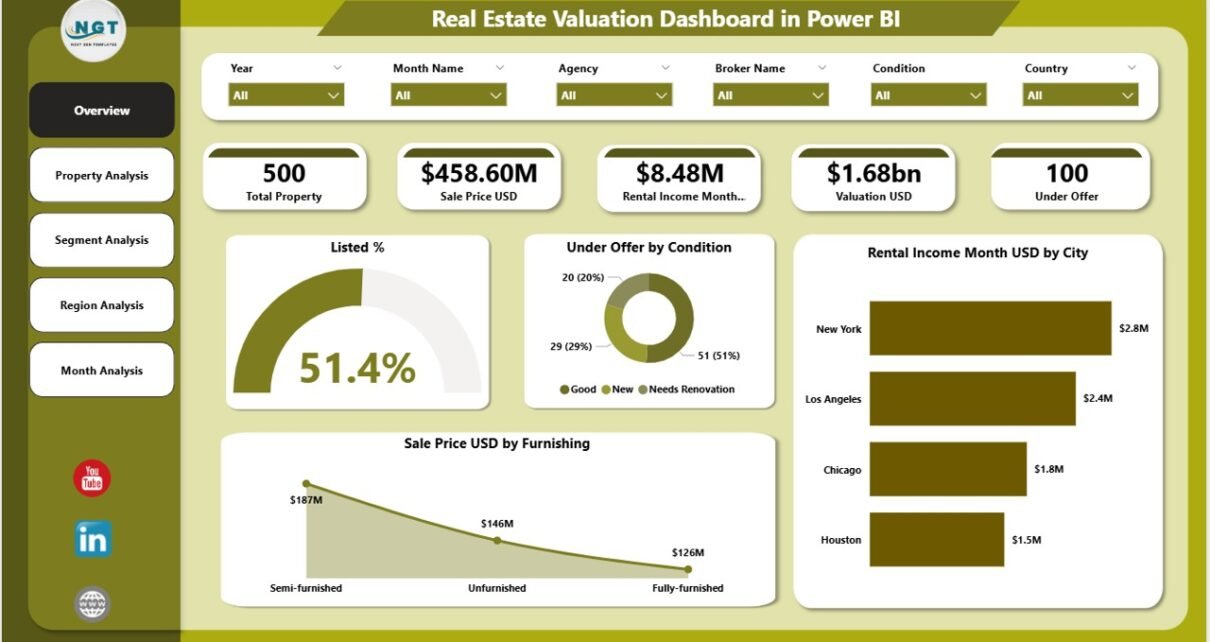
1. What Does the Overview Page Show in the Real Estate Valuation Dashboard?

The Overview Page acts as the executive summary of the entire dashboard. It provides a high-level snapshot of valuation and rental performance.
Key elements on the Overview Page:
Interactive Slicers
-
Filter by city, region, property type, segment, or month
-
Instantly update all visuals
KPI Cards
-
Total Valuation USD
-
Total Properties
-
Properties Under Offer
-
Average Rental Income
Visual Charts
-
Listed % – Shows listing status distribution
-
Under Offer by Condition – Highlights property condition impact
-
Rental Income Month USD by City – Compares city-wise rental performance
-
Sale Price USD by Furnishing – Analyzes furnishing impact on pricing
Because of this design, stakeholders gain a quick understanding of portfolio health.
Click to Purchases Real Estate Valuation Dashboard in Power BI
2. How Does the Property Analysis Page Improve Valuation Insights?
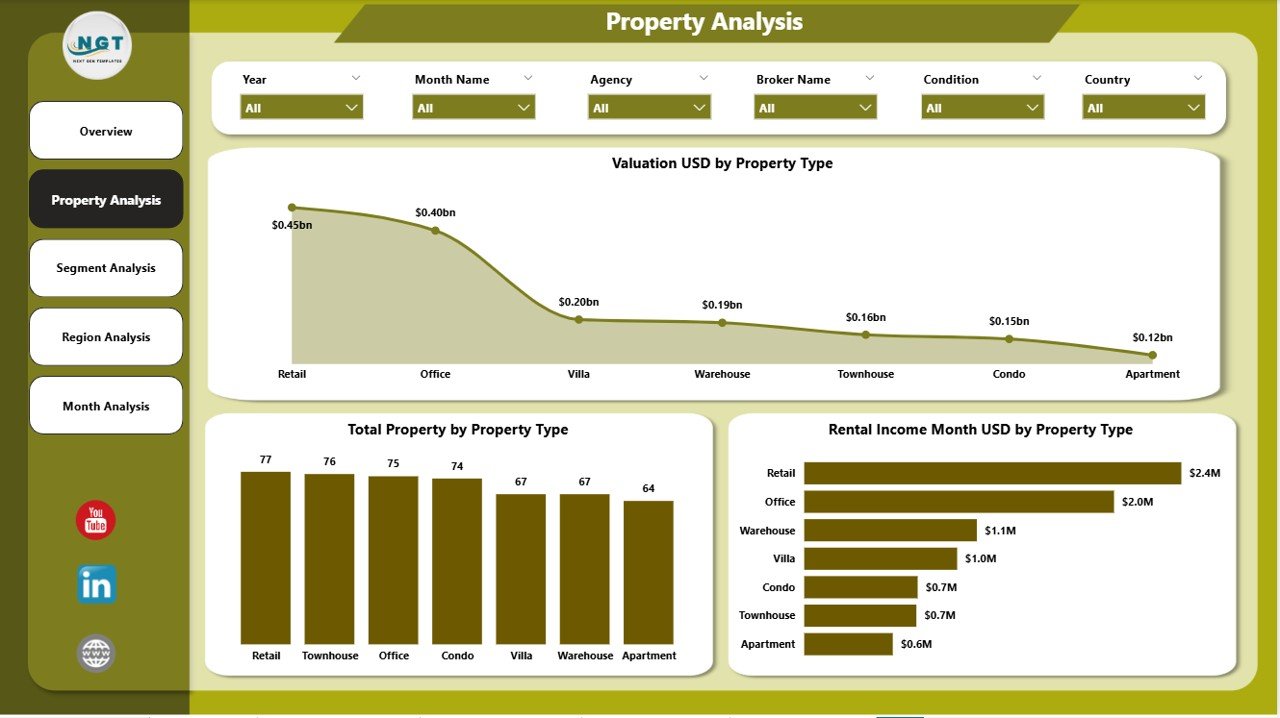
The Property Analysis Page focuses on performance by property type.
Key visuals included:
-
Valuation USD by Property Type
-
Total Property by Property Type
-
Rental Income Month USD by Property Type
This page helps users answer important questions:
-
Which property type delivers the highest valuation?
-
Which category generates the most rental income?
-
Where should investments increase or decrease?
As a result, investors optimize property mix effectively.
3. Why Is Segment Analysis Important in Real Estate Valuation?
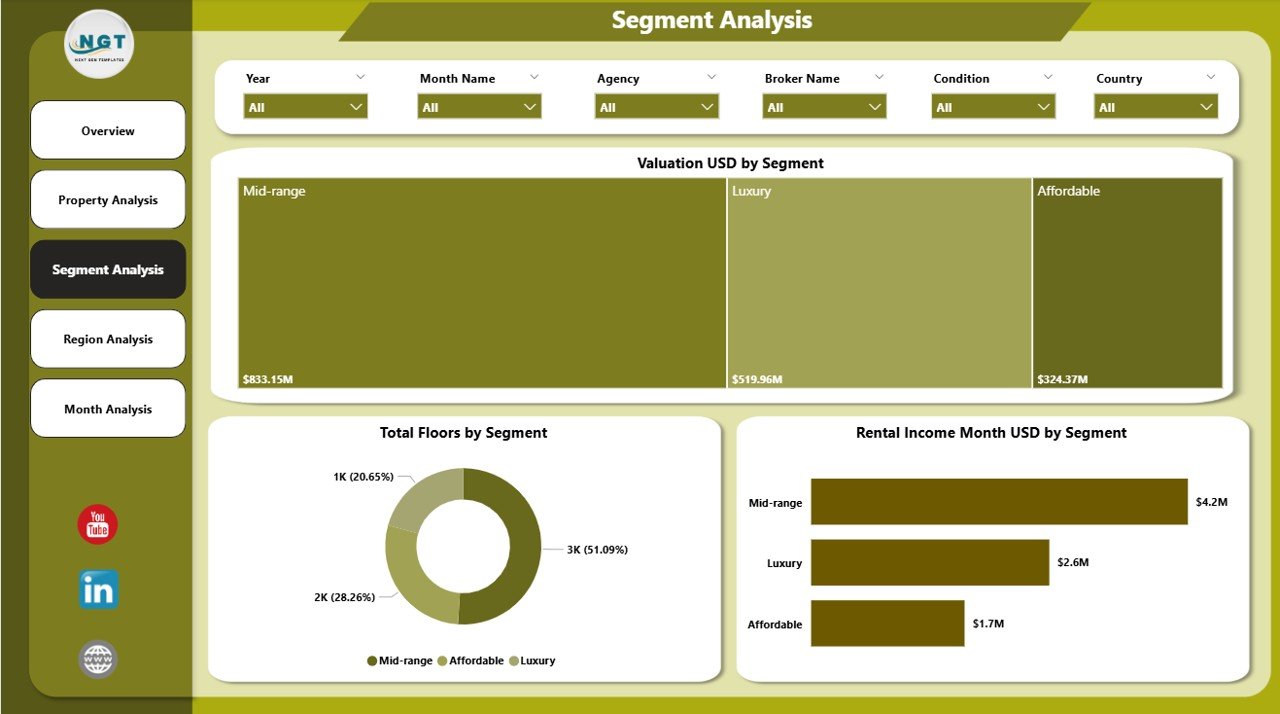
The Segment Analysis Page provides insights based on market segments such as luxury, mid-range, or affordable properties.
Visuals included:
-
Valuation USD by Segment
-
Total Property by Segment
-
Rental Income Month USD by Segment
Because different segments behave differently, this page allows:
-
Accurate segment-wise valuation comparison
-
Rental income optimization
-
Strategic portfolio rebalancing
Moreover, it improves targeted investment decisions.
4. How Does Region Analysis Support Strategic Decisions?
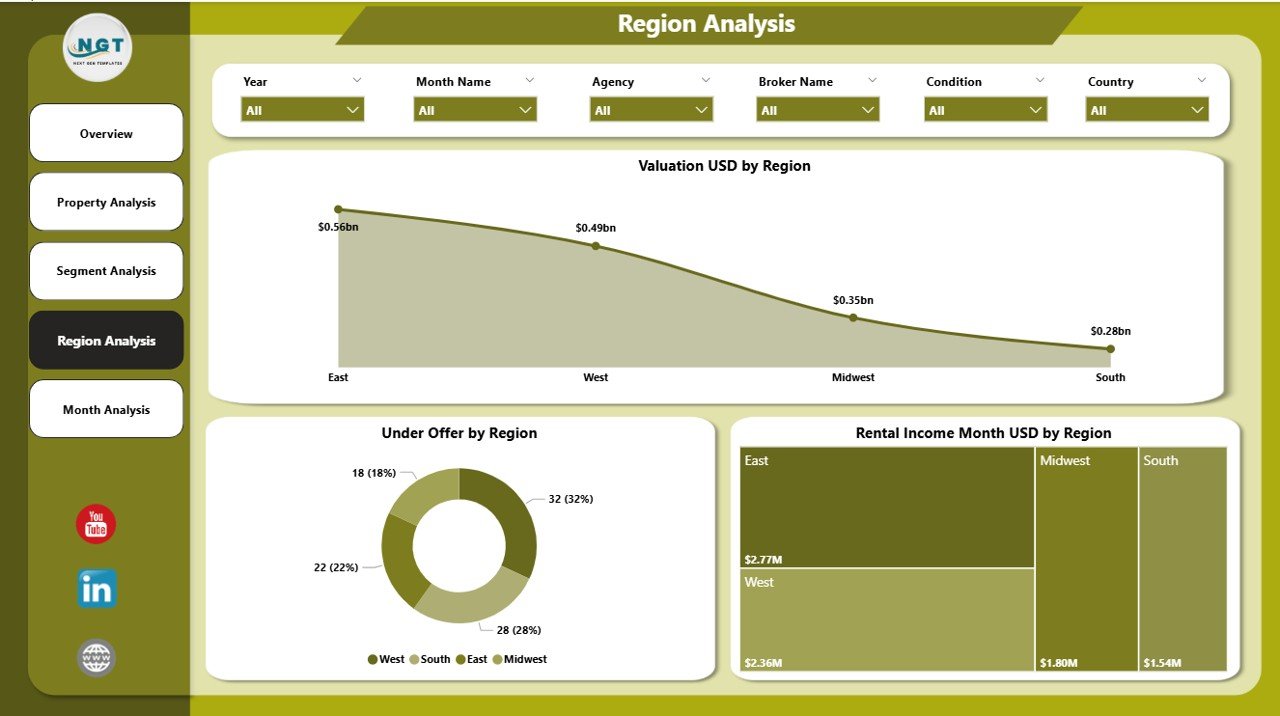
The Region Analysis Page highlights geographical performance.
Key visuals:
-
Valuation USD by Region
-
Under Offer by Region
-
Rental Income Month USD by Region
This page answers critical questions:
-
Which regions deliver maximum valuation?
-
Where do properties move faster?
-
Which regions show strong rental demand?
Therefore, businesses use this page to plan regional expansion and pricing strategy.
Click to Purchases Real Estate Valuation Dashboard in Power BI
5. What Insights Does the Monthly Trends Page Provide?
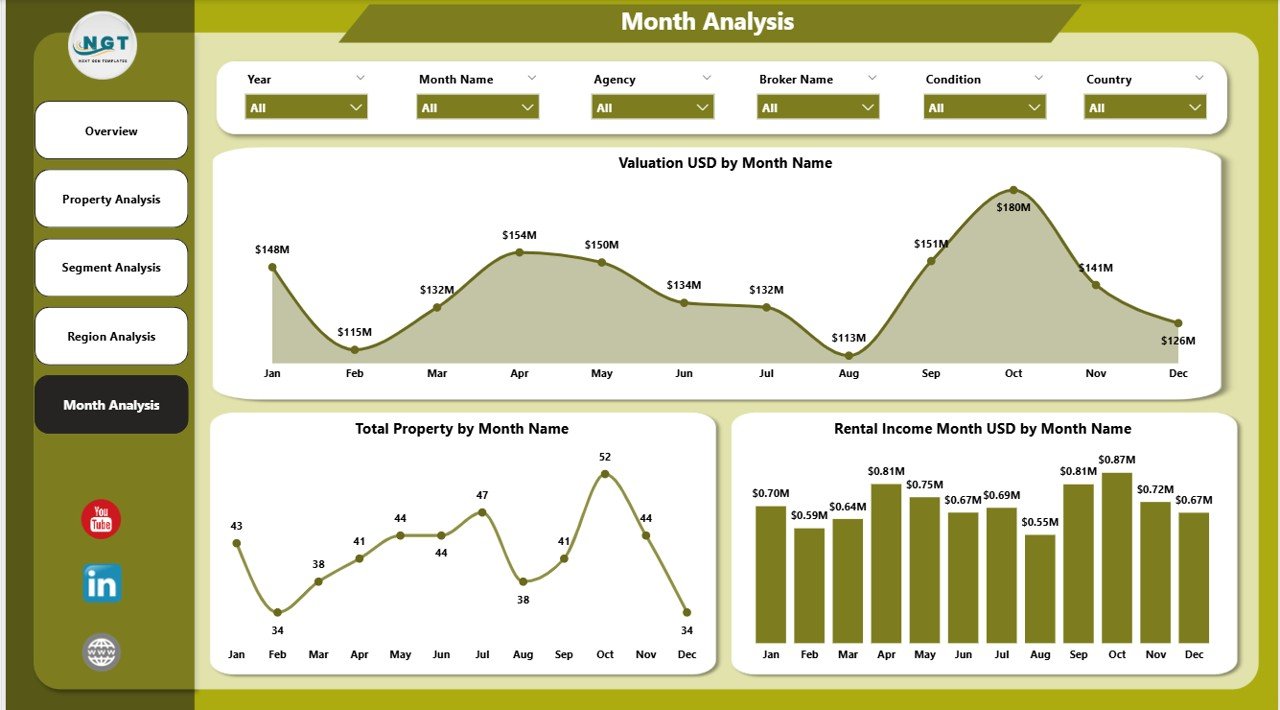
The Monthly Trends Page focuses on time-based analysis.
Included charts:
-
Valuation USD by Month
-
Total Property by Month
-
Rental Income Month USD by Month
This page helps identify:
-
Seasonal valuation patterns
-
Monthly rental income fluctuations
-
Market demand cycles
Consequently, users forecast future trends with confidence.
What Are the Key Features of the Real Estate Valuation Dashboard in Power BI?
This dashboard includes several powerful features that improve usability and decision-making.
Key features include:
-
Interactive slicers for dynamic filtering
-
Multi-page structured analysis
-
City, region, segment, and property-type insights
-
Valuation and rental income tracking
-
Monthly trend analysis
-
Clean and professional visuals
-
Executive-friendly layout
Because of these features, users gain clarity without complexity.
Advantages of Real Estate Valuation Dashboard in Power BI
Why Should Businesses Use This Dashboard?
A Real Estate Valuation Dashboard delivers multiple strategic advantages.
Key advantages include:
-
📊 Centralized valuation insights
-
⏱️ Faster decision-making
-
📈 Improved investment planning
-
🌍 Regional performance visibility
-
💰 Rental income optimization
-
🔍 Better risk identification
-
📉 Reduced manual reporting effort
As a result, businesses gain stronger control over property portfolios.
How Does Power BI Improve Real Estate Valuation Accuracy?
Power BI improves valuation accuracy by:
-
Eliminating manual calculation errors
-
Using consistent valuation logic
-
Providing real-time insights
-
Allowing instant filtering and drill-downs
Because of this accuracy, stakeholders trust valuation outputs.
Who Can Benefit from a Real Estate Valuation Dashboard in Power BI?
This dashboard serves multiple roles across the real estate ecosystem.
Ideal users include:
-
Real estate investors
-
Property developers
-
Asset managers
-
Brokerage firms
-
Property management companies
-
Financial analysts
-
Real estate consultants
Each role gains actionable insights tailored to their needs.
Best Practices for the Real Estate Valuation Dashboard in Power BI
To maximize value, users must follow best practices.
Best practices include:
-
Maintain clean and validated data
-
Use consistent valuation dates
-
Standardize property categories
-
Update data regularly
-
Avoid overloading visuals
-
Use slicers strategically
-
Review trends monthly
-
Align KPIs with business goals
By following these practices, users ensure long-term dashboard effectiveness.
How Often Should Real Estate Valuation Data Be Updated?
Ideally, valuation data should update monthly or quarterly, depending on market activity. However, rental income data should update monthly to track cash flow accurately.
Common Challenges in Real Estate Valuation and How This Dashboard Solves Them
Common challenges:
-
Scattered data sources
-
Manual valuation errors
-
Delayed reporting
-
Limited visibility
-
Poor trend analysis
How the dashboard helps:
-
Centralizes all data
-
Automates calculations
-
Displays real-time insights
-
Improves transparency
-
Enables proactive decisions
Therefore, the dashboard acts as a complete valuation control system.
How Does This Dashboard Support Investment Strategy?
The dashboard helps investors:
-
Identify high-value regions
-
Compare property types
-
Analyze segment performance
-
Monitor monthly trends
-
Optimize rental yield
As a result, investment decisions become data-backed and confident.
Conclusion: Why a Real Estate Valuation Dashboard in Power BI Is Essential Today
A Real Estate Valuation Dashboard in Power BI transforms complex property data into clear, actionable insights. Instead of relying on assumptions, businesses gain a structured, visual, and interactive valuation system.
With five detailed pages, dynamic slicers, valuation metrics, and rental trends, this dashboard supports strategic planning, investment optimization, and operational efficiency.
In a competitive real estate market, data clarity defines success. Therefore, adopting this dashboard becomes a strategic advantage rather than a choice.
Frequently Asked Questions (FAQs)
What is a Real Estate Valuation Dashboard in Power BI?
A Real Estate Valuation Dashboard in Power BI is an interactive analytics tool that tracks property value, rental income, and market performance using visual reports.
Can this dashboard handle multiple cities and regions?
Yes, the dashboard supports city-wise and region-wise analysis using slicers and segmented visuals.
Does the dashboard support rental income analysis?
Yes, it includes monthly rental income analysis by city, region, segment, and property type.
Can users customize the dashboard?
Yes, users can customize visuals, KPIs, and filters based on business requirements.
Is Power BI suitable for real estate analytics?
Absolutely. Power BI offers scalability, interactivity, and accuracy, making it ideal for real estate valuation and performance tracking.
How does this dashboard improve decision-making?
It provides real-time insights, structured analysis, and trend visibility, which enable faster and smarter decisions.
Visit our YouTube channel to learn step-by-step video tutorials