In any organization, managing risks effectively is crucial to ensuring long-term success and stability. The Risk Mitigation KPI Dashboard in Excel provides a comprehensive and organized way to track key performance indicators (KPIs) related to risk management. This ready-to-use template allows you to monitor how well your organization is identifying, assessing, and mitigating risks.
In this article, we will explore the key features of the Risk Mitigation KPI Dashboard in Excel, explain the KPIs it tracks, and show how it can help businesses improve their risk management strategies.
What is the Risk Mitigation KPI Dashboard?
The Risk Mitigation KPI Dashboard is an Excel-based tool designed to monitor and track key metrics related to the mitigation of risks in an organization. It helps businesses identify the effectiveness of their risk management strategies and pinpoint areas that require further attention.
With the help of this dashboard, you can track important KPIs such as the number of risks mitigated, mitigation time, risk severity, and more. The dashboard’s structure and visual representation of data make it easy to interpret risk-related performance and make informed decisions.
The Excel template is fully customizable, so you can tailor it to your organization’s specific risk management needs.
Key Features of the Risk Mitigation KPI Dashboard in Excel
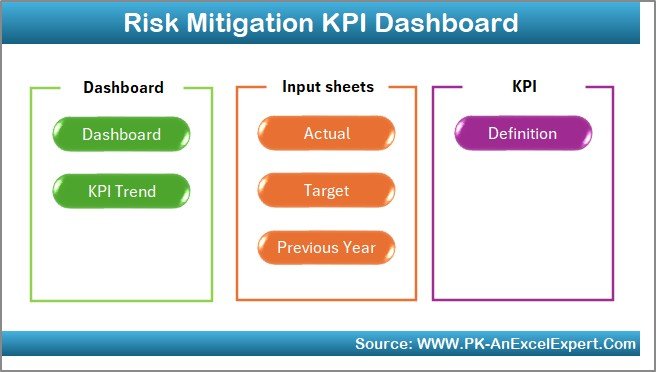
The Risk Mitigation KPI Dashboard includes seven distinct worksheets, each designed to track and report different aspects of risk mitigation:
1. Home Sheet Tab
The Home Sheet acts as the central hub, allowing you to navigate easily between the different sections of the dashboard. This sheet provides a summary of the KPIs and offers quick access to the key areas of the dashboard.
Click to buy Risk Mitigation KPI Dashboard in Excel
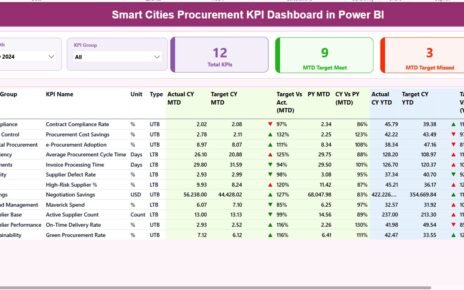
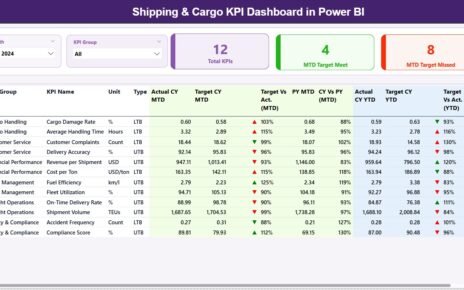
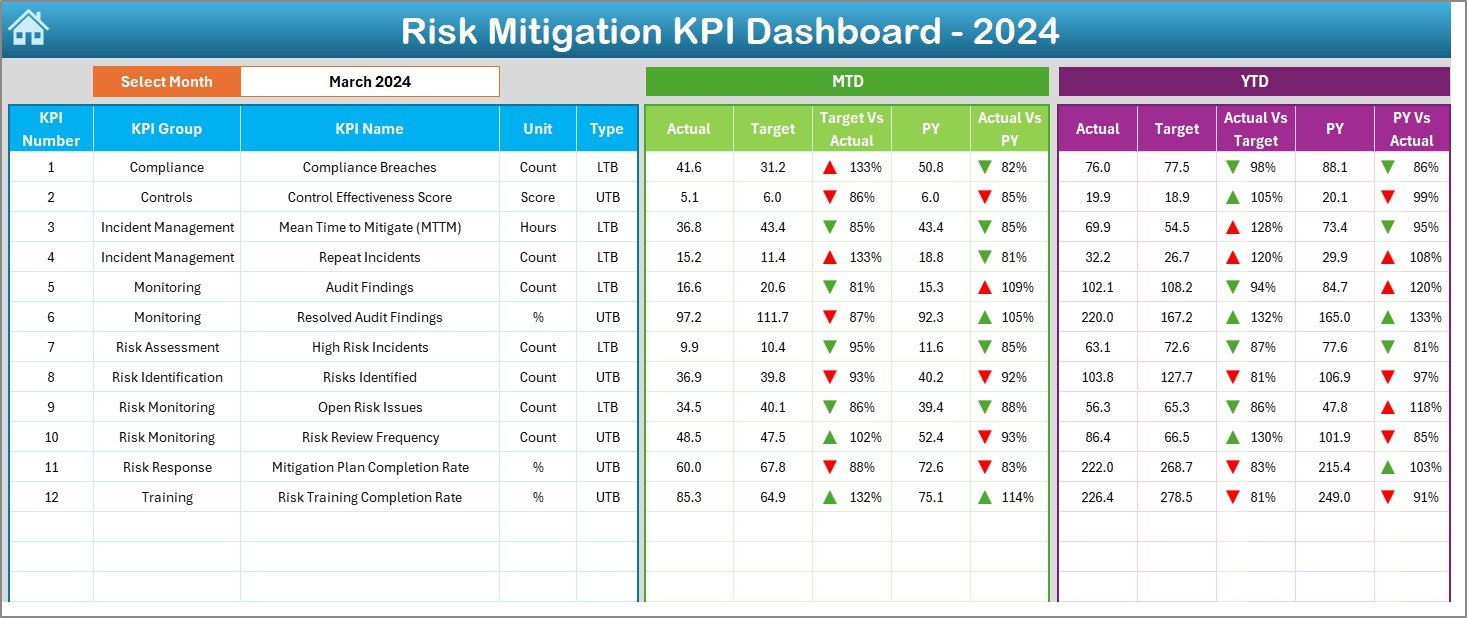
2. Dashboard Sheet Tab
The Dashboard Sheet is the main tab where the core risk mitigation KPIs are displayed. Here, you can track the performance of various metrics, including Month-to-Date (MTD) and Year-to-Date (YTD) data. Features include:
Click to buy Risk Mitigation KPI Dashboard in Excel
-
Month Dropdown (D3): Select the desired month from the dropdown, and the entire dashboard will update accordingly.
Key Metrics:
- MTD Actual, Target, Previous Year Data: View actual performance for the current month, compare it with the target and previous year’s data.
- YTD Actual, Target, Previous Year Data: Track year-to-date performance and compare it with the target and last year’s data.
-
Conditional Formatting: Up and down arrows indicate whether each KPI is meeting or missing its target for both MTD and YTD data.
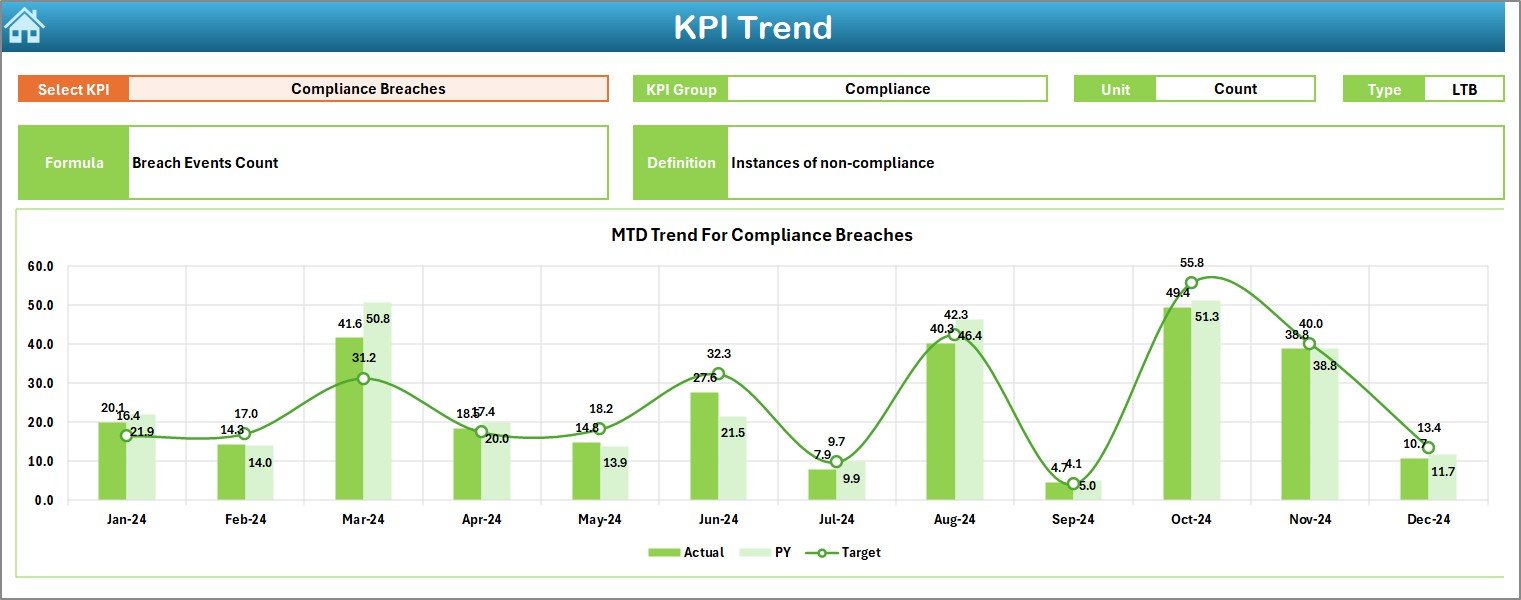
3. KPI Trend Sheet Tab
The KPI Trend Sheet allows you to analyze risk mitigation trends over time. You can select a specific KPI from the dropdown in Range C3, and the sheet will display its performance trend across months.
-
KPI Group, Unit, Type: This section shows the KPI’s group (e.g., risk severity, mitigation time), its unit of measurement (e.g., hours, percentage), and whether the KPI is “Lower the Better” (LTB) or “Upper the Better” (UTB).
-
Formula and Definition: The formula used to calculate each KPI is displayed, along with a clear explanation of what each KPI tracks.
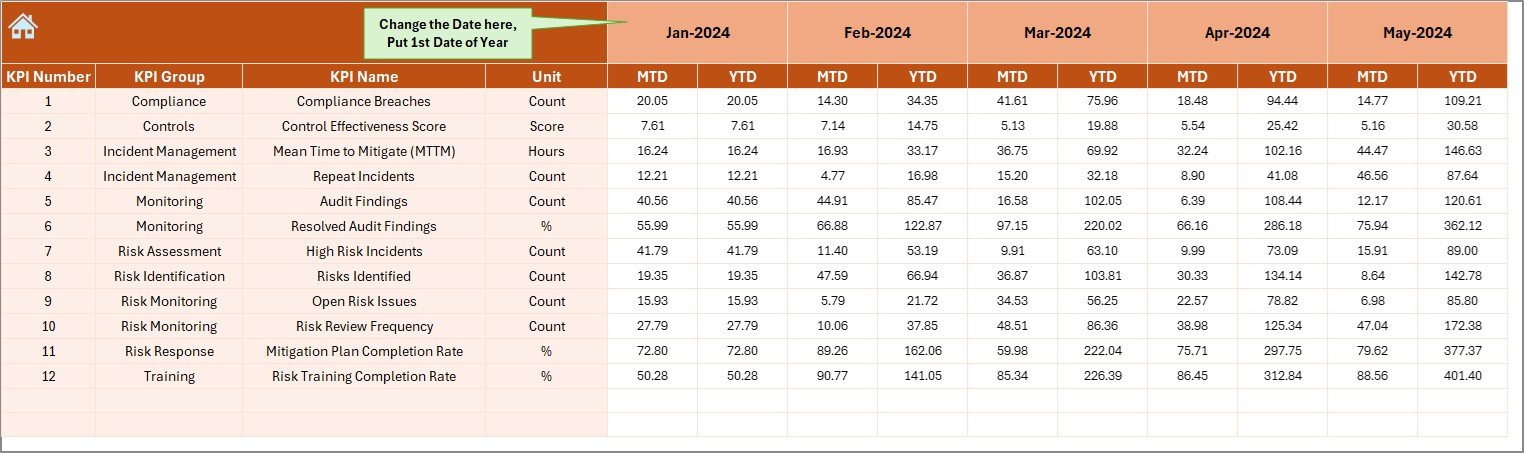
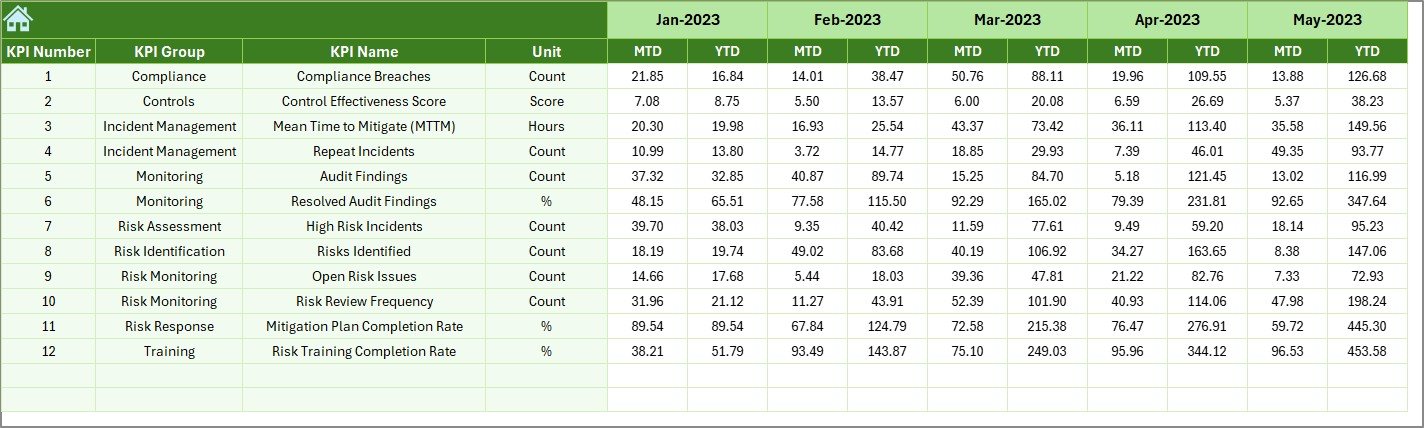
4. Actual Number Sheet Tab
In the Actual Numbers Sheet, you can input the actual performance data for MTD and YTD for each month:
-
MTD and YTD Data Input: Enter the actual values for each KPI, which will automatically update the dashboard.
-
Month Selection (E1): Select the first month of the year to refresh the data and update the dashboard automatically.
Click to buy Risk Mitigation KPI Dashboard in Excel
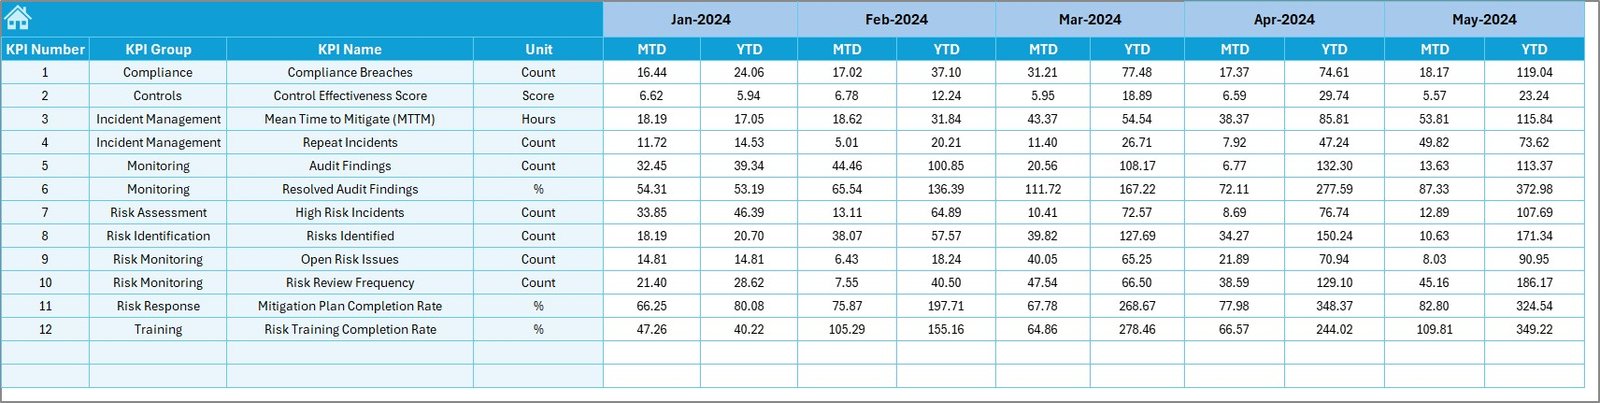
5. Target Sheet Tab
The Target Sheet is where you input the target values for each KPI:
-
Monthly and YTD Targets: Enter the target numbers for each KPI, which will be used to compare actual performance and track progress.
6. Previous Year Number Sheet Tab
This sheet stores data from the previous year, allowing you to compare current performance with historical data:
-
Historical Comparison: Enter data from the previous year to track trends and identify areas where risk mitigation strategies have improved or need improvement.
Click to buy Risk Mitigation KPI Dashboard in Excel
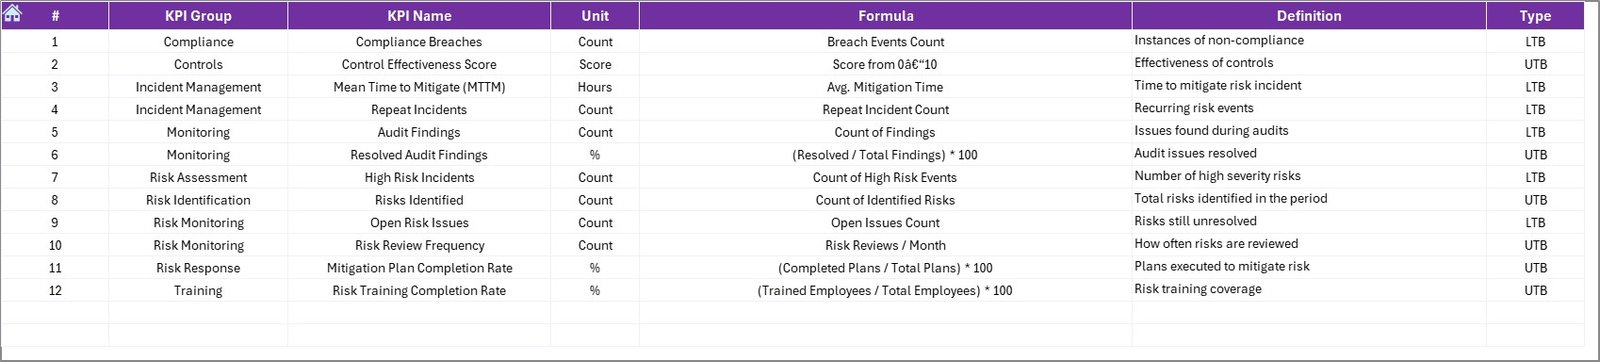
7. KPI Definition Sheet Tab
The KPI Definition Sheet clearly defines each KPI tracked in the dashboard:
-
KPI Name, Group, Unit: Each KPI is named and categorized, and the unit of measurement is specified.
-
Formula and Definition: Provides the formula for calculating each KPI and a detailed explanation of what each KPI measures.\
Advantages of Using the Risk Mitigation KPI Dashboard
The Risk Mitigation KPI Dashboard provides several key benefits:
-
Centralized Risk Tracking: All key risk mitigation KPIs are displayed in one place, offering a clear view of risk management performance.
-
Real-Time Insights: Track KPIs in real-time, allowing for quick identification of risks and the effectiveness of mitigation strategies.
-
Data-Driven Decision Making: Make informed decisions based on accurate and up-to-date risk management data.
-
Visual Representation: Visual elements like graphs, charts, and conditional formatting help you quickly understand your organization’s risk mitigation performance.
-
Customizable: The dashboard is fully customizable to match your organization’s specific risk management needs.
Opportunity for Improvement in the Risk Mitigation KPI Dashboard
Click to buy Risk Mitigation KPI Dashboard in Excel
While the Risk Mitigation KPI Dashboard is already a valuable tool, there are a few opportunities for improvement:
-
Automated Data Entry: Integrating the dashboard with risk management systems could automate data entry and improve data accuracy.
-
Predictive Analytics: Adding predictive analytics would allow you to forecast potential risks and proactively address them before they escalate.
-
Mobile Accessibility: Making the dashboard mobile-friendly would allow stakeholders to track risk mitigation performance from anywhere.
-
Real-Time Collaboration: Incorporating real-time collaboration features would enhance teamwork and communication between risk management teams.
Best Practices for Using the Risk Mitigation KPI Dashboard
To get the most out of the Risk Mitigation KPI Dashboard, follow these best practices:
-
Update Regularly: Regularly update data to ensure the dashboard provides the most accurate and current information.
-
Prioritize High-Impact KPIs: Focus on KPIs that have the most significant impact on your organization’s risk management, such as Risk Mitigation Rate and Mitigation Time.
-
Track Trends Over Time: Use the trend analysis features to identify patterns and areas for improvement.
-
Set Clear Targets: Set clear and achievable targets for each KPI to measure progress and drive improvements.
-
Collaborate Across Teams: Share the dashboard with relevant stakeholders to ensure alignment and encourage collaborative risk management.
Conclusion
Click to buy Risk Mitigation KPI Dashboard in Excel
The Risk Mitigation KPI Dashboard in Excel is a powerful tool that helps organizations track and manage risk mitigation efforts. By focusing on key performance indicators like risk mitigation rate, mitigation time, and compliance rate, this dashboard provides valuable insights that can help businesses improve their risk management strategies and reduce overall risk exposure. Whether you’re a risk manager, compliance officer, or business leader, this dashboard is an essential tool for ensuring that your organization is effectively managing and mitigating risks.
Frequently Asked Questions (FAQs)
1. What KPIs are tracked in the Risk Mitigation KPI Dashboard?
The dashboard tracks KPIs such as Risk Mitigation Rate, Mitigation Time, Compliance Rate, and more to measure the effectiveness of risk management.
2. How do I update the Risk Mitigation KPI Dashboard?
You can update the dashboard by entering actual data in the Actual Numbers Sheet and setting targets in the Target Sheet.
3. Can I customize the Risk Mitigation KPI Dashboard?
Yes, the dashboard is fully customizable. You can modify KPIs, formulas, and the layout to fit your organization’s specific needs.
4. How often should I update the data in the Risk Mitigation KPI Dashboard?
It’s recommended to update the data regularly (e.g., weekly or monthly) to keep the dashboard accurate and up to date.
5. Can the Risk Mitigation KPI Dashboard be automated?
Yes, you can integrate the dashboard with risk management systems to automate data collection and reduce manual data entry.
Visit our YouTube channel to learn step-by-step video tutorials
Watch the step-by-step video Demo:
Click to buy Risk Mitigation KPI Dashboard in Excel