In today’s fast-paced digital world, staying on top of your social media game is no longer optional—it’s essential. Whether you’re a social media manager, marketing executive, or small business owner, understanding your social media data can help you boost engagement, measure ROI, and improve your content strategy. But how do you make sense of all those numbers across multiple platforms?
This is where the Social Media Performance Dashboard in Excel comes in handy. It’s a dynamic, ready-to-use template that simplifies social media tracking and turns your raw data into powerful insights—all in one place.
Let’s explore everything you need to know about this tool, why it matters, how to use it, and the best practices for getting the most out of it.
Click to Purchases Social Media Performance Dashboard in Excel
What Is a Social Media Performance Dashboard in Excel?
A Social Media Performance Dashboard in Excel is a visual reporting tool that consolidates your key metrics—like impressions, likes, shares, clicks, and engagement rates—across different platforms, campaigns, and timeframes.
Unlike other complex software, this dashboard leverages Excel’s capabilities to provide a streamlined, interactive, and user-friendly experience. No coding or expensive tools needed—just your data and this template.
Key Features of the Dashboard
This Excel dashboard includes 5 analytics pages and smart slicers for dynamic filtering. Here’s a detailed walkthrough of each component:
Page Navigator (Left Panel)
This always-visible navigation menu lets you jump between dashboard pages without scrolling endlessly. With just one click, you can move to Overview, Platform Performance, Campaign Analysis, Team Performance, or Timeline Trends.
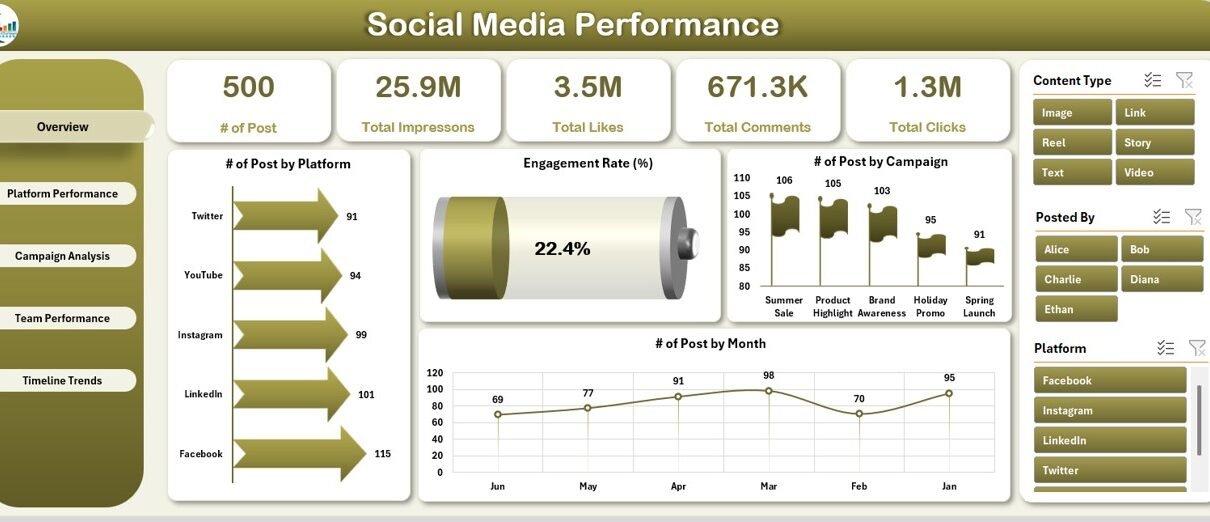
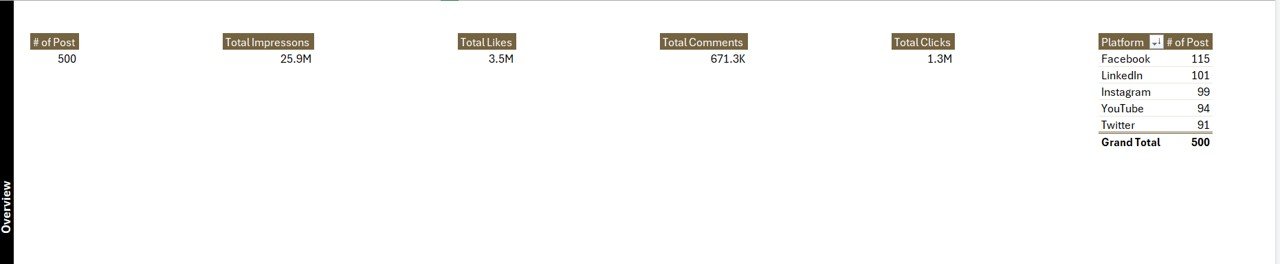
Overview Page
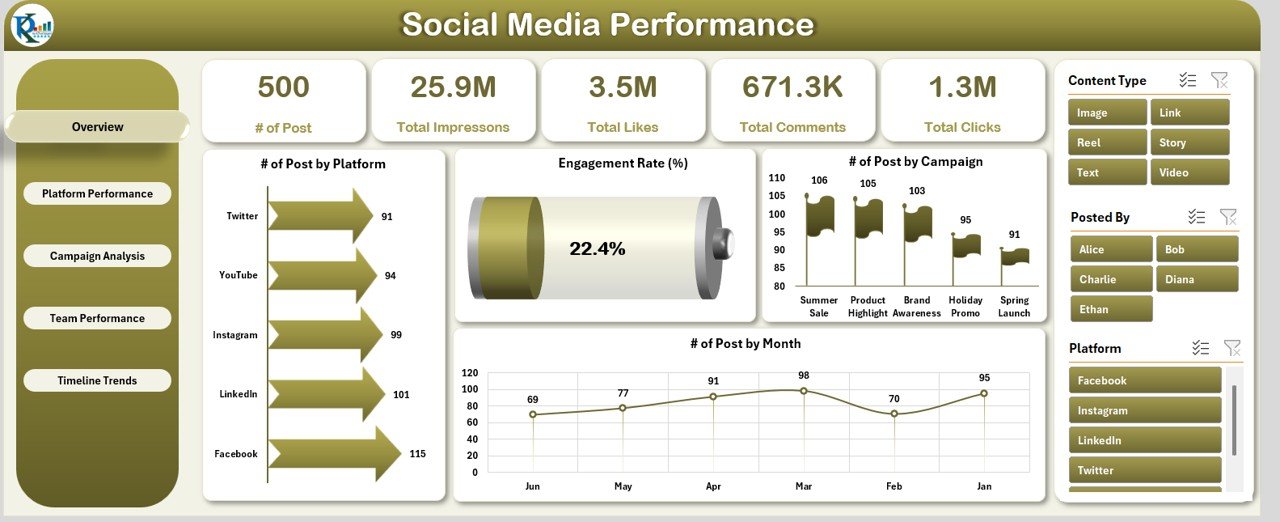
This is the main page of the dashboard, offering a bird’s-eye view of your social media activity. It includes:
-
3 slicers on the left side (Platform, Month, Year)
-
5 performance cards: Total Posts, Total Engagements, Total Impressions, Average Engagement Rate, Total Clicks
4 key charts:
- Posts by Platform
- Engagement Rate (%)
- Posts by Campaign
- Posts by Month
You can instantly track which platforms or campaigns are performing best.
Click to Purchases Social Media Performance Dashboard in Excel
Platform Performance
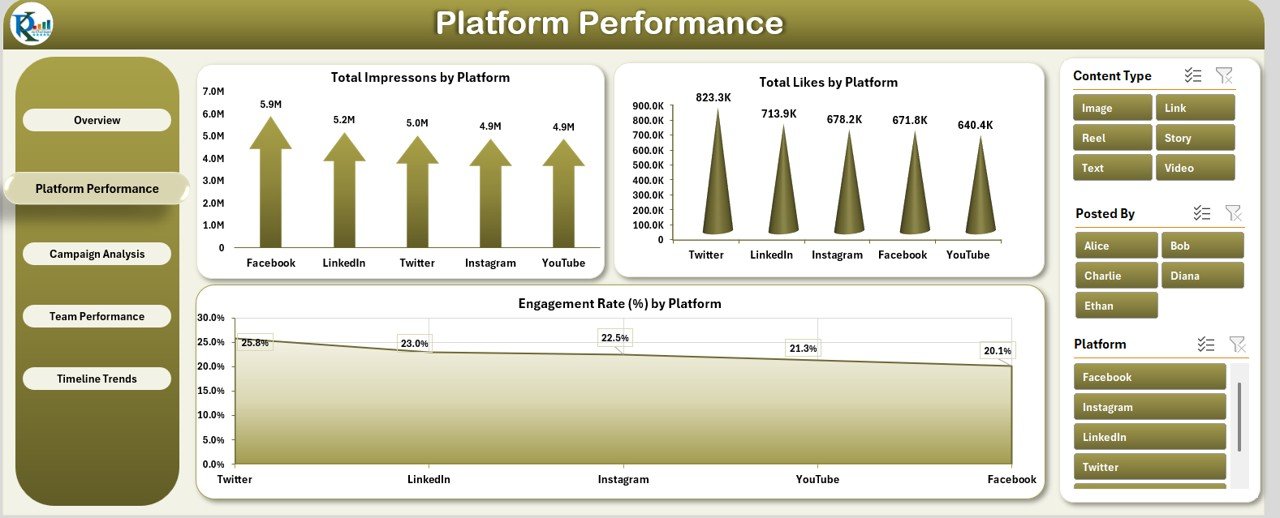
This page focuses on comparing the output of each platform—be it Instagram, Facebook, LinkedIn, or Twitter.
-
3 slicers on the left side
3 detailed charts:
- Total Impressions by Platform
- Total Likes by Platform
- Engagement Rate (%) by Platform
This helps you spot where your audience is most active and which platform gives you the best return.
Campaign Analysis
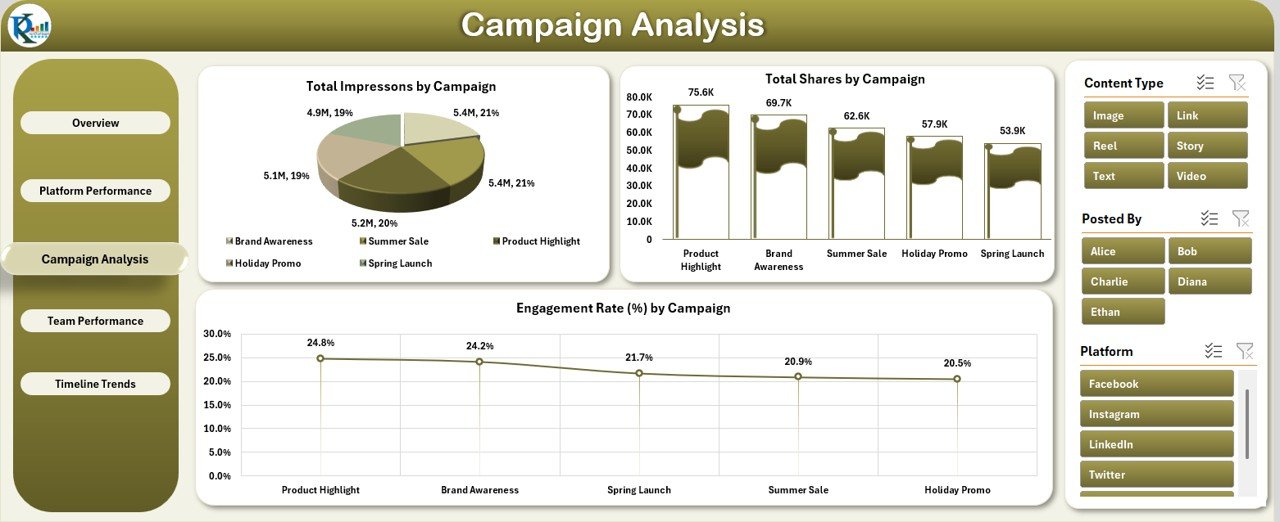
This section provides insights into how different social media campaigns are performing.
-
3 slicers on the left side
3 insightful charts:
- Impressions by Campaign
- Shares by Campaign
- Engagement Rate (%) by Campaign
It’s perfect for optimizing your marketing budget and tweaking campaigns that underperform.
Click to Purchases Social Media Performance Dashboard in Excel
Team Performance
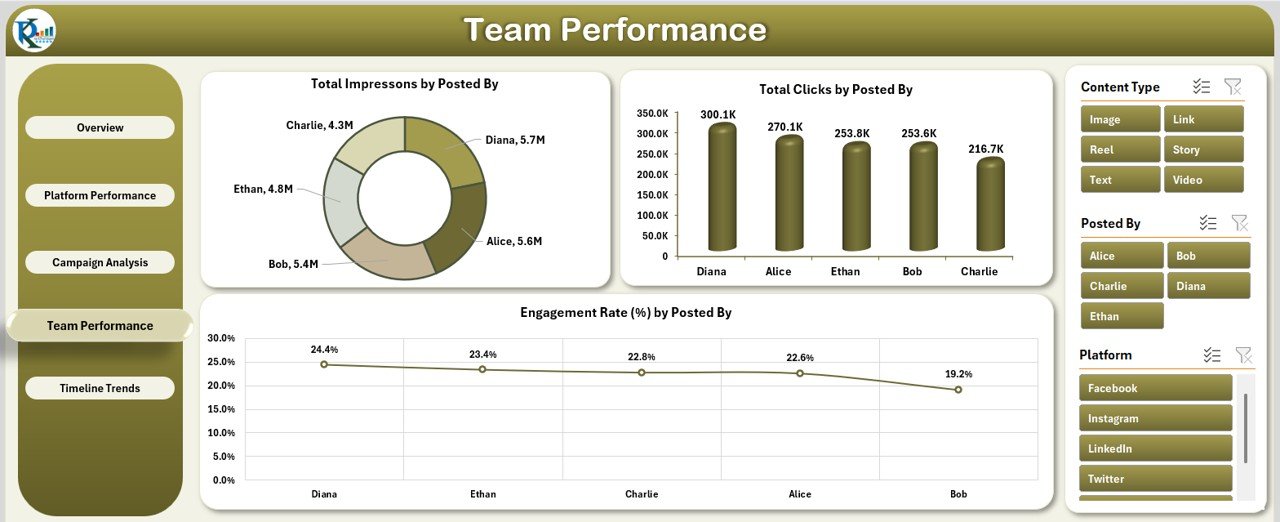
Here, the spotlight is on your content creators or marketing team.
-
3 slicers on the left side
3 charts:
- Impressions by “Posted By”
- Clicks by “Posted By”
- Engagement Rate (%) by “Posted By”
This helps you recognize your top performers and guide others for improvement.
Timeline Trends
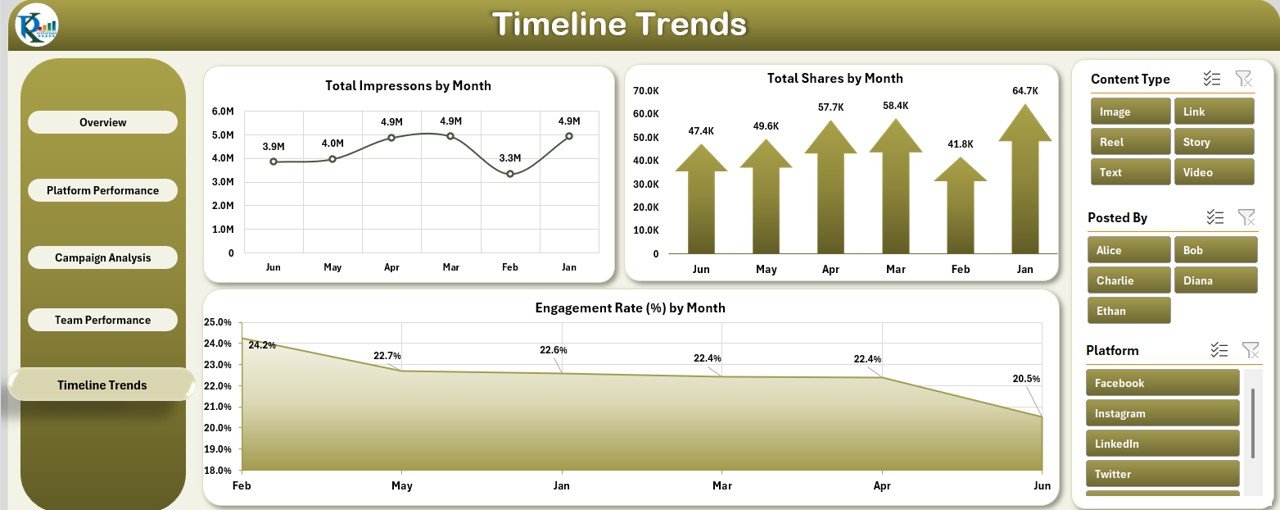
Track your performance over time and understand seasonal or monthly fluctuations.
-
3 slicers on the left side
3 charts:
- Impressions by Month
- Shares by Month
- Engagement Rate (%) by Month
It’s ideal for quarterly reviews and planning future campaigns.
What’s Inside the Excel File?
To support the dashboards, two additional sheets are included:
📄 Data Sheet
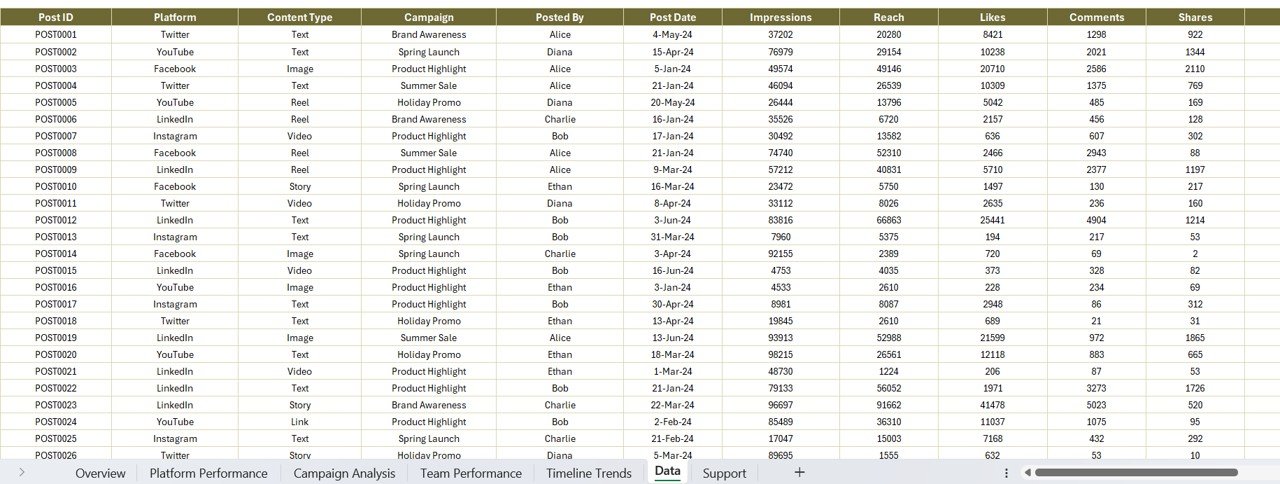
This is the backbone of your dashboard. You only need to input or copy-paste your raw data with the following columns:
Click to Purchases Social Media Performance Dashboard in Excel
-
Post ID
-
Platform
-
Content Type
-
Campaign
-
Posted By
-
Post Date
-
Impressions
-
Reach
-
Likes
-
Comments
-
Shares
-
Clicks
-
Month
-
Year
The dashboard fetches real-time analytics from this sheet using Pivot Tables and Charts.
Support Sheet
This sheet handles drop-down values, such as unique platform names, campaign names, or employee names. It helps keep slicers clean and reduces manual entry errors.
Advantages of Using a Social Media Performance Dashboard in Excel
Let’s face it—tracking performance manually or jumping between multiple analytics platforms is tiring. This dashboard saves time and brings clarity.
✅ Unified View Across Platforms
See all your social media data (Instagram, Facebook, Twitter, etc.) in one place.
✅ Track Engagement Effortlessly
Monitor likes, shares, comments, and clicks without complex tools.
✅ Campaign Optimization
Identify what’s working and what needs improvement across all your campaigns.
✅ Team Performance Insights
Motivate your team by recognizing top contributors and improving accountability.
✅ Easy to Customize
Since it’s built in Excel, you can tweak it to suit your branding, colors, or data layout.
Best Practices for Using the Social Media Performance Dashboard
To ensure you’re getting the most accurate and actionable insights, follow these best practices:
1. Update Data Regularly
Set a schedule to update your data—daily, weekly, or monthly. Consistency ensures reliable insights.
2. Use Standard Formats
Keep date formats, campaign names, and platform titles consistent. This avoids slicer and chart errors.
3. Leverage Slicers for Deep Dives
Use slicers (filters) on the left panel to explore trends by month, campaign, or platform.
4. Monitor Key Metrics
Keep an eye on engagement rates and impressions—they often signal overall content health.
5. Keep a Backup
Always save a backup copy of your data before updating, in case of overwriting errors.
6. Customize for Stakeholders
Create custom views for executives, team leads, or marketing managers using slicers or filtered copies.
Who Should Use This Dashboard?
This dashboard is built for a wide range of users, including:
-
Marketing Agencies
-
Freelance Social Media Managers
-
Startups & Small Businesses
-
Corporate Marketing Teams
-
Non-profits Running Campaigns
-
Content Creators and Influencers
Anyone who handles multiple social media accounts can benefit from this tool.
💼 Use Cases for the Social Media Performance Dashboard
Need ideas for how to integrate this dashboard into your workflow? Here are a few:
🎯 Campaign Reporting
Track results before, during, and after running paid or organic campaigns.
📅 Monthly Performance Reviews
Present clear, data-backed visuals during marketing review meetings.
🔍 Competitor Analysis
Compare your campaign performance with industry benchmarks (manually added).
📥 Client Reporting
Generate monthly reports for clients using filtered views.
How to Use the Dashboard (Step-by-Step)
-
Download and Open the Excel File
-
Go to the “Data Sheet”
-
Paste Your Data in the correct columns
-
Go to Each Dashboard Tab (Overview, Campaign, etc.)
-
Use the Slicers to filter by platform, date, or campaign
-
Analyze, Present, and Make Decisions
It’s that simple—no code, no advanced formulas, just pure Excel magic.
Conclusion
The Social Media Performance Dashboard in Excel is more than just a template. It’s a time-saving, decision-making, and insight-generating tool designed to help you level up your social media strategy.
Whether you’re aiming to boost engagement, improve team output, or impress your clients, this dashboard will give you the edge you need. Best of all, it’s affordable, easy to use, and completely customizable. So don’t wait—start tracking smarter today!
Frequently Asked Questions (FAQs)
1. Can I use this dashboard in Google Sheets?
This version is built for Microsoft Excel. However, with minor adjustments, you can import it into Google Sheets—but some Pivot Chart features may not work perfectly.
2. Do I need Excel 365 to use this?
No. This dashboard works in most modern versions of Excel (2016 and above). Excel 365 offers better visuals, but it’s not mandatory.
3. Can I add more charts or KPIs?
Yes! The dashboard is fully customizable. You can add new metrics, visuals, and even integrate Power Query if needed.
4. How often should I update the data?
We recommend updating the data weekly or monthly depending on your reporting frequency.
5. Is this dashboard beginner-friendly?
Absolutely. If you know basic Excel functions like copy-paste, you can easily manage this tool.
Visit our YouTube channel to learn step-by-step video tutorials