In today’s fast-paced logistics world, tracking the right performance metrics is essential for business growth. Whether you manage a supply chain for manufacturing, retail, or distribution, understanding how your network performs month-over-month is key. That’s exactly where the Supply Chain and Logistics Market Expansion KPI Dashboard in Excel comes into play.
This article will walk you through the dashboard’s features, explain its advantages, offer best practices, and answer frequently asked questions. Let’s dive right in!
Click to Purchases Supply Chain and Logistics Market Expansion KPI Dashboard in Excel
What is the Supply Chain and Logistics Market Expansion KPI Dashboard?
The Supply Chain and Logistics Market Expansion KPI Dashboard is a ready-to-use Excel template that helps you monitor, measure, and improve your logistics operations through key performance indicators (KPIs). It’s designed to track both Month-to-Date (MTD) and Year-to-Date (YTD) values with comparisons against targets and previous year performance.
What Makes Up This Dashboard?
This Excel dashboard contains 7 powerful sheets that work together seamlessly. Here’s a quick breakdown of each:
Home Sheet
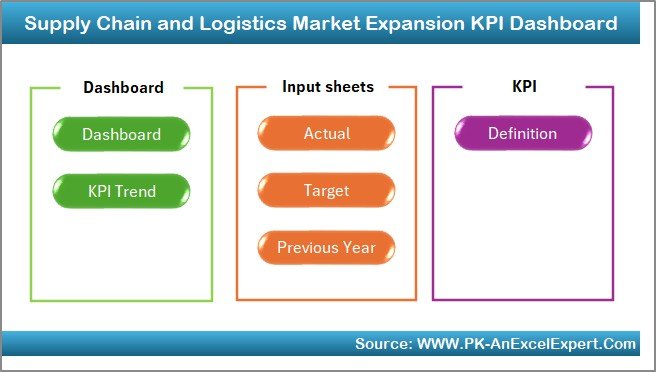
This sheet works as a smart navigation panel. It contains buttons that let you quickly jump to different sections of the dashboard, making it user-friendly and intuitive.
Dashboard Sheet Tab
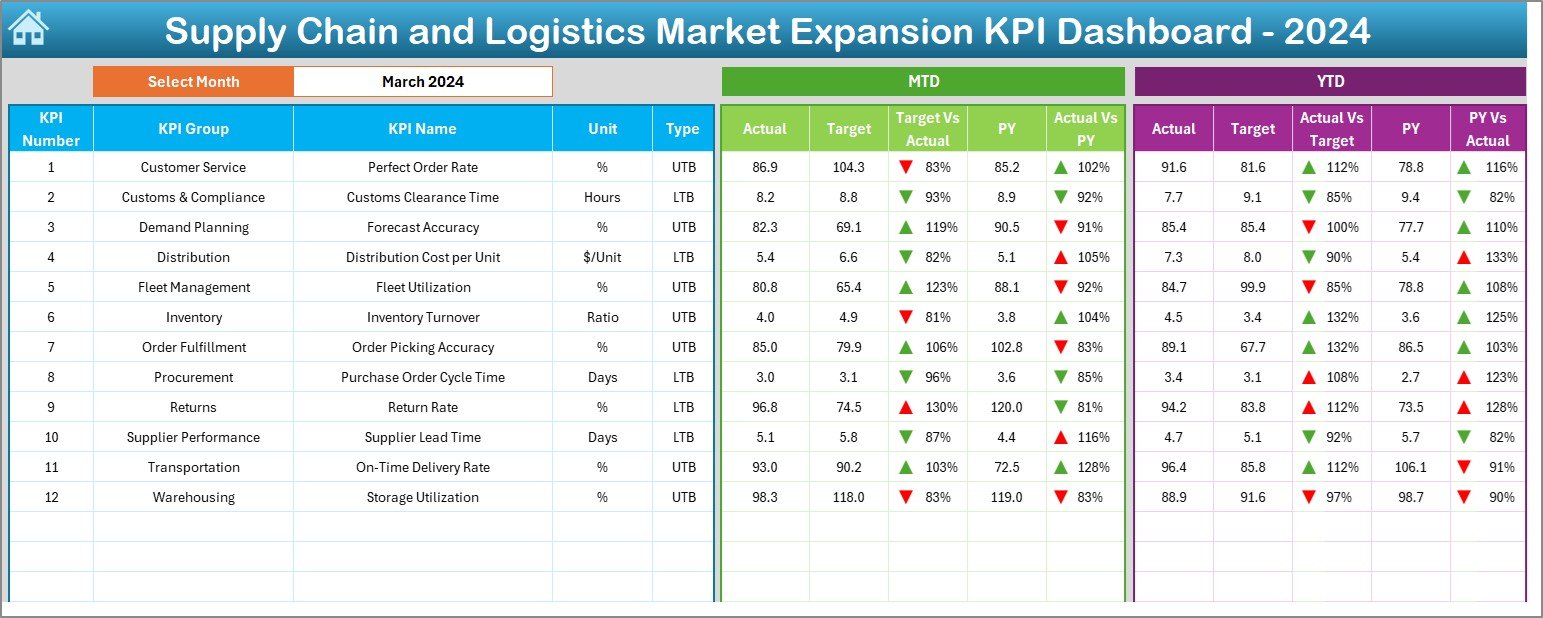
This is the main control center.
From here, you can:
-
Select the month from a dropdown menu (Cell D3).
-
Instantly view MTD and YTD actuals, targets, and previous year values.
Visualize performance gaps using conditional formatting with up and down arrows for:
- Target vs Actual
- Previous Year vs Actual
KPI Trend Sheet Tab
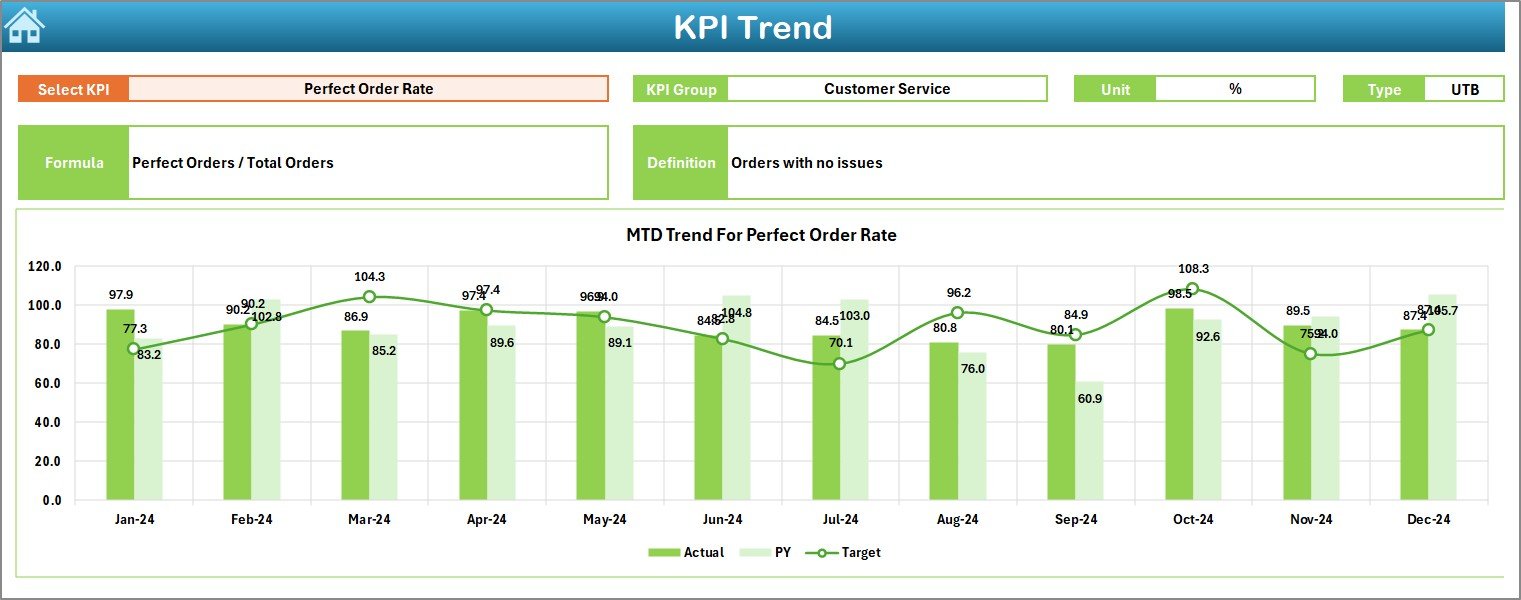
This tab helps you track the trend of any specific KPI over time.
Features include:
-
Dropdown to choose KPI (Cell C3)
-
Auto-filled details like KPI Group, Unit, Type (UTB or LTB), Formula, and Definition
-
MTD and YTD trend charts to visualize performance patterns
Actual Numbers Input Sheet
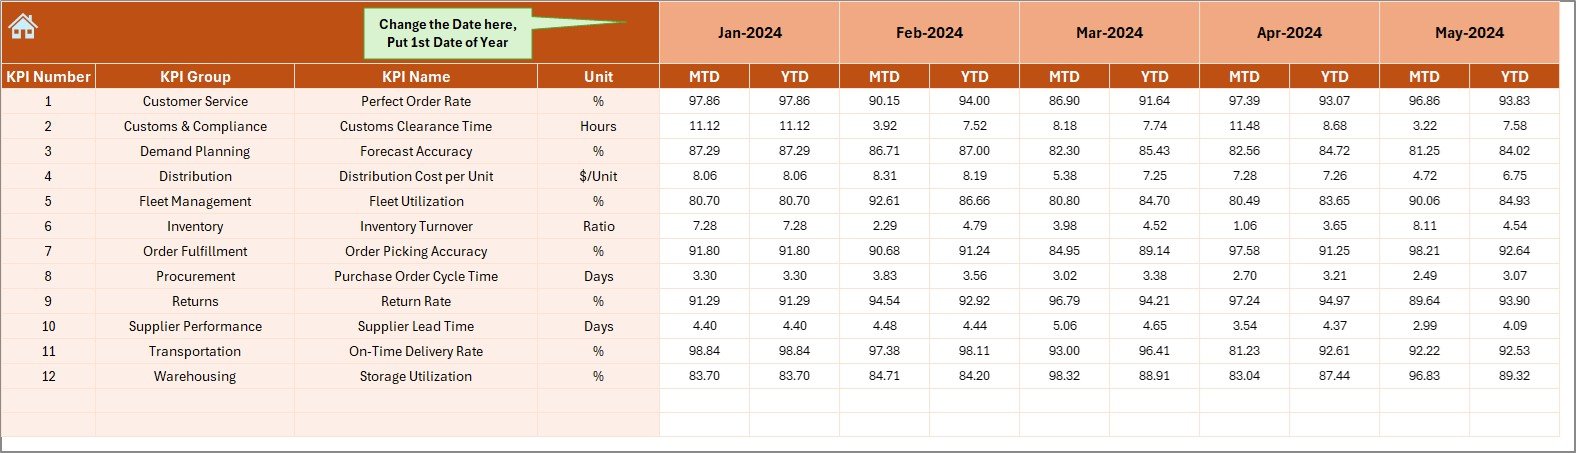
Here, you enter your actual performance numbers.
-
Choose the starting month in cell E1
-
Enter MTD and YTD values easily, month-wise
Click to Purchases Supply Chain and Logistics Market Expansion KPI Dashboard in Excel
Target Sheet Tab
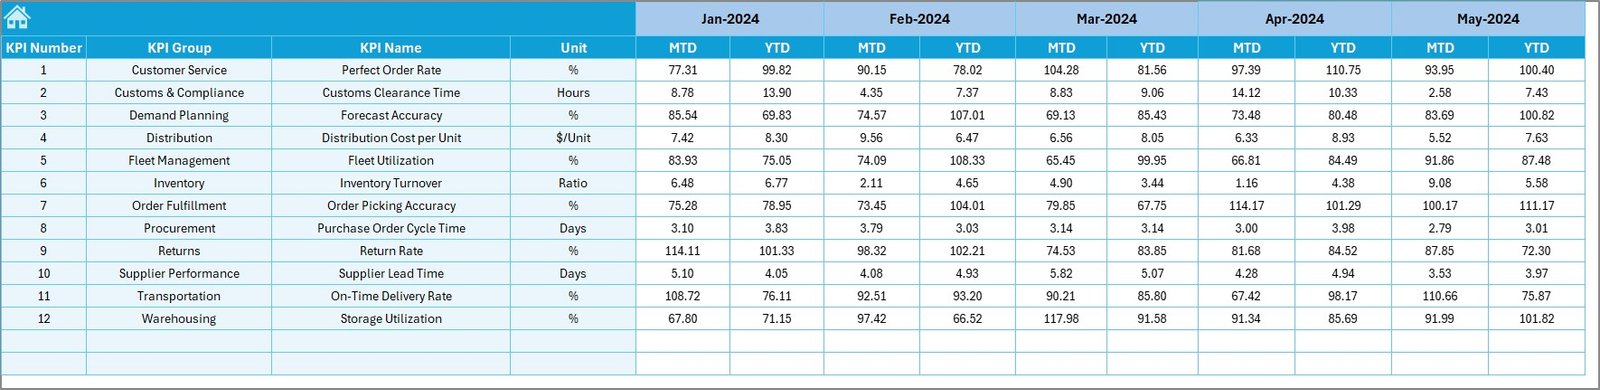
Enter your monthly and yearly targets for every KPI.
This helps you compare real performance with expectations effectively.
Previous Year Numbers Sheet Tab
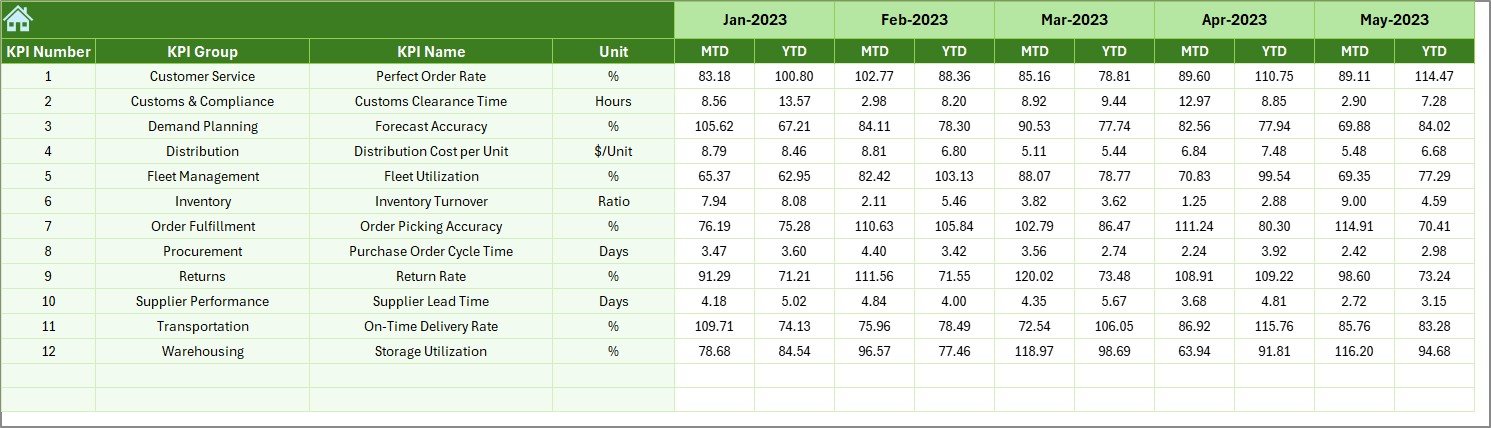
Input the previous year’s data in this sheet.
This allows year-over-year comparison—crucial for growth analysis.
KPI Definition Sheet Tab
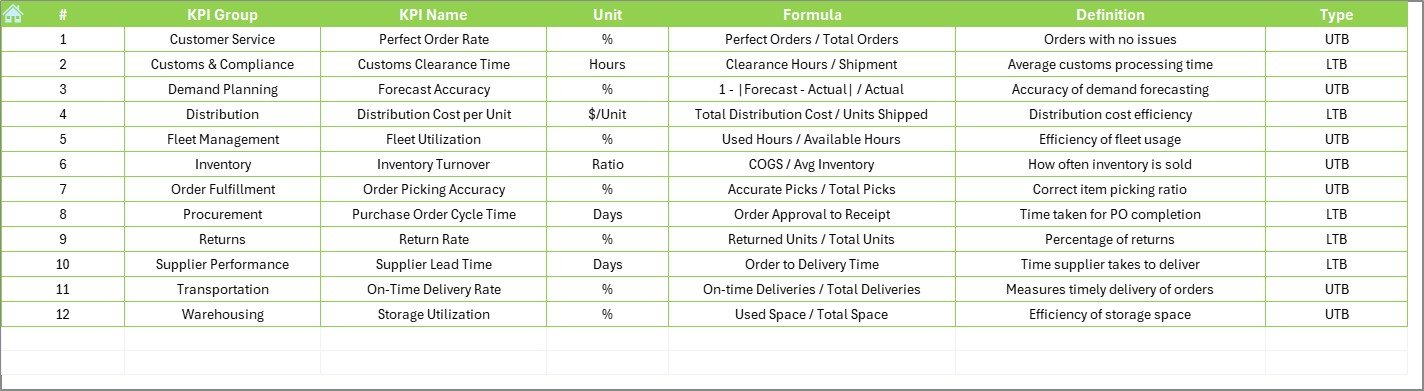
Define all KPIs here.
-
Add KPI name, group, unit, formula, and definition
-
Classify each KPI as UTB (Upper the Better) or LTB (Lower the Better)
Advantages of Using This Excel KPI Dashboard
Using this dashboard gives your business a competitive edge. Here’s how:
🚀 Real-Time Insights
Track and visualize your supply chain metrics instantly for any selected month.
🎯 Target vs Actual Comparison
See exactly where you’re hitting or missing goals, both MTD and YTD.
📉 Previous Year Performance Benchmarking
Identify seasonal trends and performance dips by comparing with last year’s data.
📈 KPI Trend Visualization
Easily analyze improvements or declines in specific KPIs with ready-made trend charts.
🛠️ Fully Customizable
You can modify KPIs, formulas, targets, and visuals to suit your unique business goals.
Best Practices for Using the Dashboard Effectively
To get the best out of your KPI dashboard, follow these best practices:
1. Keep Your Data Up to Date
Update actuals, targets, and PY values regularly to maintain accurate reporting.
2. Use Clear Naming Conventions
Ensure all KPIs and groups are labeled clearly in the KPI Definition tab.
3. Focus on Actionable KPIs
Don’t track everything—track what matters most to your expansion and efficiency goals.
4. Review Monthly Trends
Use the KPI Trend tab to review changes and make proactive decisions.
5. Use Conditional Formatting Wisely
Rely on the arrow indicators to spot underperforming or improving areas instantly.
Why Is a KPI Dashboard Important in Supply Chain and Logistics?
You can’t improve what you don’t measure.
A KPI dashboard helps logistics managers:
-
Monitor warehouse efficiency
-
Track on-time delivery
-
Measure transportation costs
-
Evaluate inventory turnover
-
And most importantly—expand into new markets with clarity
Conclusion
The Supply Chain and Logistics Market Expansion KPI Dashboard in Excel is more than just a spreadsheet—it’s a decision-making powerhouse. By consolidating performance data, tracking progress, and visualizing trends, this tool helps you move faster, optimize better, and grow smarter.
If you’re serious about taking your logistics performance to the next level, this Excel dashboard is your perfect companion.
Frequently Asked Questions (FAQs)
Q1: Can I customize the KPIs in this dashboard?
Absolutely! You can add, remove, or modify KPIs in the KPI Definition sheet based on your business needs.
Q2: Do I need advanced Excel skills to use this dashboard?
Not at all. The dashboard uses simple dropdowns, formulas, and slicers. It’s easy to use for beginners and powerful enough for pros.
Q3: How many KPIs can I track at once?
You can track as many as you’d like. However, it’s best to keep it to 12–15 focused KPIs for better clarity and decision-making.
Q4: Does this dashboard support automation or VBA?
The current version does not use VBA, which makes it lightweight and compatible across Excel versions.
Q5: Is this dashboard suitable for small businesses?
Yes! Whether you’re a startup or an enterprise, this dashboard works across scales and industries.
Visit our YouTube channel to learn step-by-step video tutorials
Click to Purchases Supply Chain and Logistics Market Expansion KPI Dashboard in Excel
Watch the step-by-step video tutorial: