Managing vendors effectively has become a critical priority for modern businesses. As organizations grow, they deal with hundreds of vendors across regions, categories, and contracts. However, when vendor data stays scattered across Excel files, ERP systems, and emails, decision-making becomes slow and risky. That is exactly where a Vendor Management Dashboard in Power BI adds immense value.
In this detailed guide, you will clearly understand what a Vendor Management Dashboard in Power BI is, why businesses need it, how it works, its page-wise structure, key metrics, advantages, best practices, and frequently asked questions. Moreover, the article uses simple language, active voice, and strong transitions so that procurement teams, finance managers, and business leaders can easily apply these insights.
What Is a Vendor Management Dashboard in Power BI?
Click to Purchases Vendor Management Dashboard in Power BI
A Vendor Management Dashboard in Power BI is a centralized, interactive analytics solution that tracks and visualizes vendor performance, payments, contracts, and risks in one place.
Instead of reviewing raw vendor data in multiple spreadsheets, this dashboard converts information into clear KPIs, charts, and trends. As a result, stakeholders gain instant visibility into vendor efficiency, spending patterns, payment variance, and regional performance.
Because the dashboard runs on Power BI, users can:
-
Apply dynamic filters
-
Drill down into details
-
Compare vendors across categories and regions
-
Monitor trends over time
Therefore, businesses gain faster insights and stronger vendor control.
Why Do Businesses Need a Vendor Management Dashboard in Power BI?
Vendor management directly impacts cost, quality, compliance, and delivery timelines. However, manual tracking often leads to missed risks and delayed actions.
A Vendor Management Dashboard in Power BI helps because it:
-
Centralizes all vendor-related data
-
Highlights underperforming vendors early
-
Improves contract and payment visibility
-
Supports data-driven vendor decisions
Moreover, when leadership teams see vendor performance visually, they act faster and negotiate better.
How Does a Vendor Management Dashboard in Power BI Work?
A Vendor Management Dashboard in Power BI typically connects with data sources such as:
-
Excel-based vendor master files
-
ERP or accounting systems
-
Procurement and contract management tools
Once connected, the dashboard:
-
Cleans and structures vendor data
-
Calculates KPIs such as vendor rating and payment variance
-
Visualizes metrics using cards, charts, and tables
-
Updates automatically when data refreshes
As a result, users always work with up-to-date vendor insights.
What Is the Page-Wise Structure of the Vendor Management Dashboard in Power BI?
This Vendor Management Dashboard includes five well-structured pages, each designed to answer specific business questions clearly.
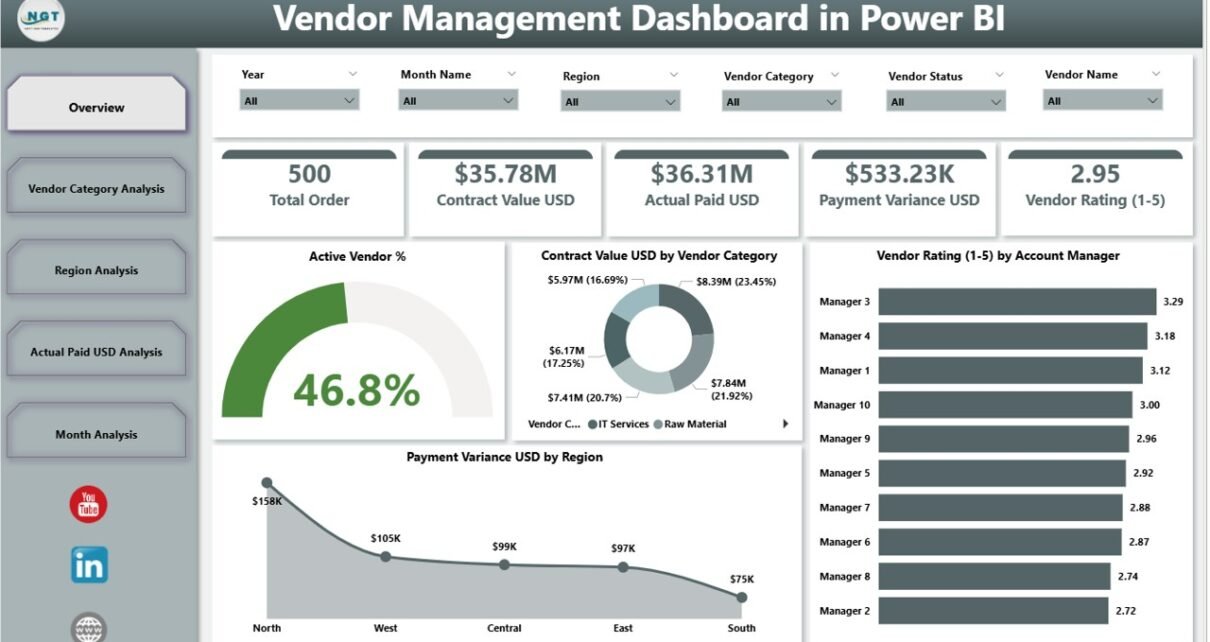
Overview Page: What Is the Overall Vendor Health?
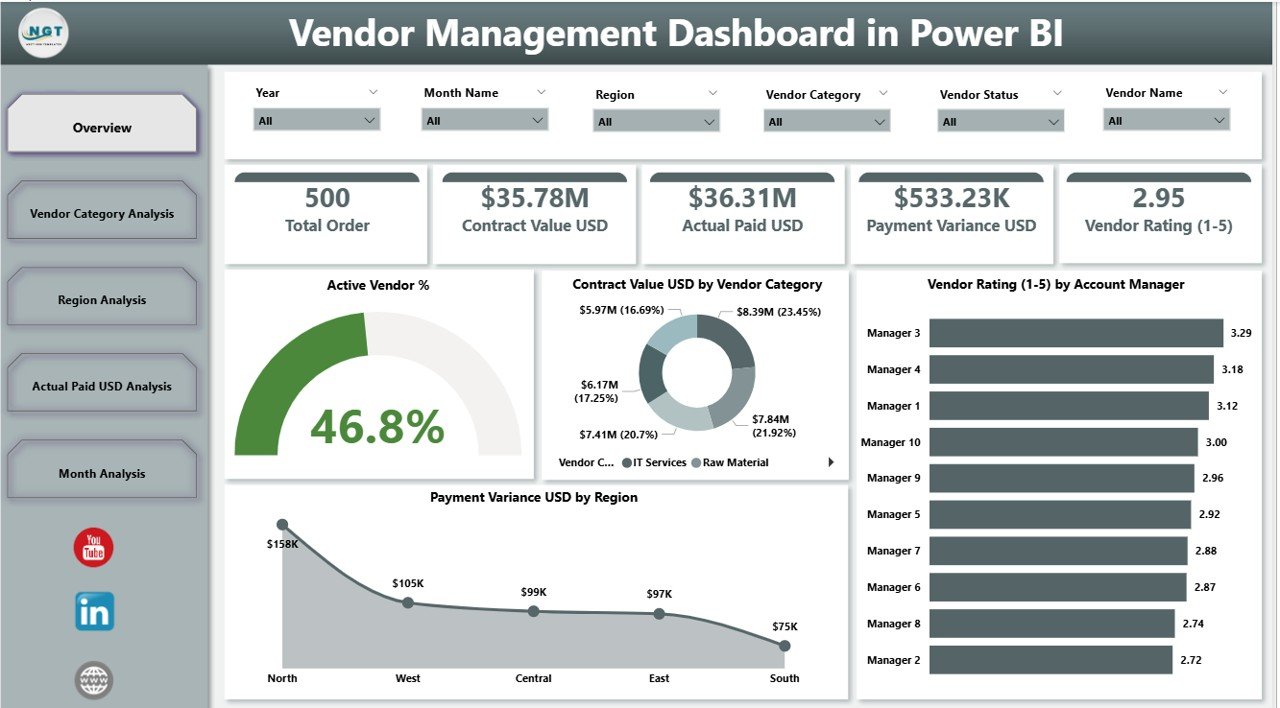
The Overview Page acts as the control center of the dashboard. From here, decision-makers quickly understand overall vendor performance.
Key Features of the Overview Page
-
Interactive slicers to filter data by time, region, or category
-
Summary cards showing high-level KPIs
-
High-impact charts for quick analysis
Key Cards on the Overview Page
Click to Purchases Vendor Management Dashboard in Power BI
-
Active Vendor %
Shows the percentage of currently active vendors, helping assess vendor base efficiency. -
Total Contract Value USD
Highlights the total value tied up in vendor contracts.
Key Charts on the Overview Page
-
Active Vendor %
Displays vendor engagement levels clearly. -
Contract Value USD by Vendor Category
Helps identify which vendor categories drive the most spend. -
Vendor Rating by Account Manager
Shows how account managers handle vendor relationships. -
Payment Variance USD by Region
Highlights regions where payment differences occur frequently.
Because of this structure, leadership can quickly spot risks and opportunities.
Vendor Category Analysis: Which Vendor Categories Perform Best?
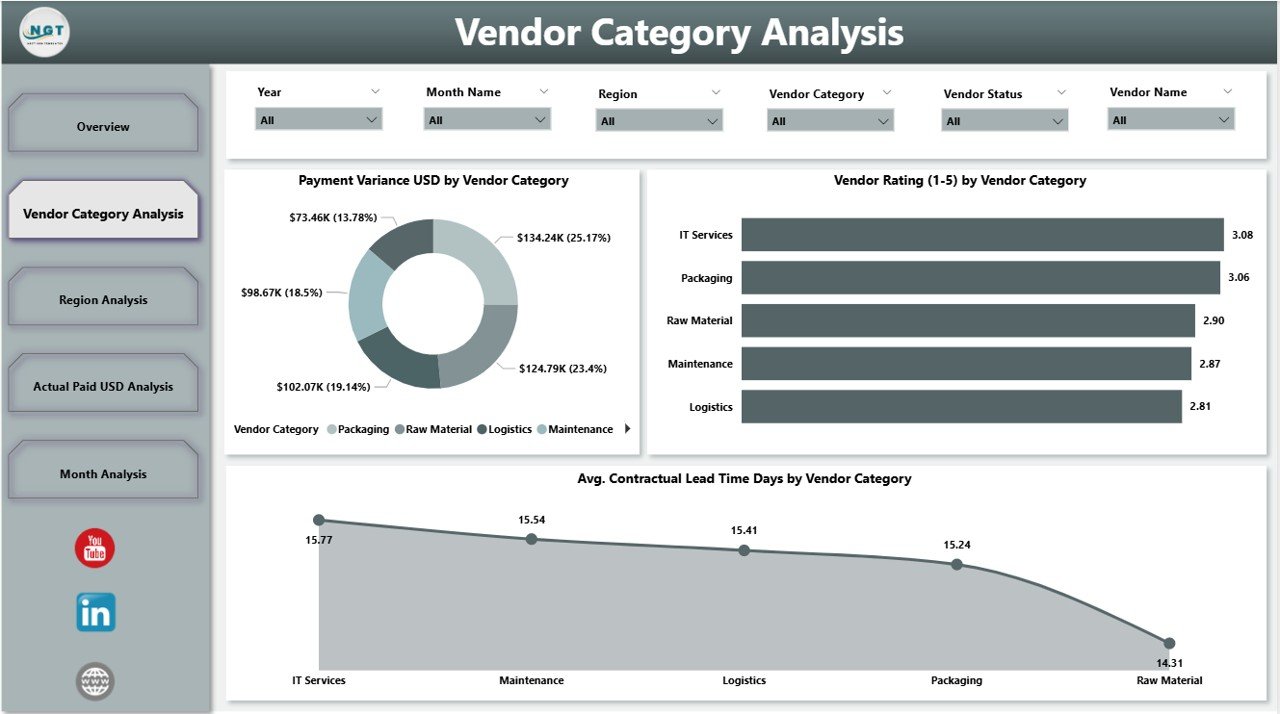
The Vendor Category Analysis Page focuses on performance comparison across vendor types.
Why Is Vendor Category Analysis Important?
Different vendor categories behave differently in terms of cost, lead time, and reliability. Therefore, category-level analysis improves sourcing strategies.
Key Charts on Vendor Category Analysis Page
-
Payment Variance USD by Vendor Category
Shows which categories create payment mismatches. -
Vendor Rating by Vendor Category
Highlights category-wise quality and service levels. -
Average Contractual Lead Time Days by Vendor Category
Helps procurement teams assess delivery efficiency.
As a result, teams can optimize vendor mix and renegotiate category-specific contracts.
Region Analysis: How Do Vendors Perform Across Regions?
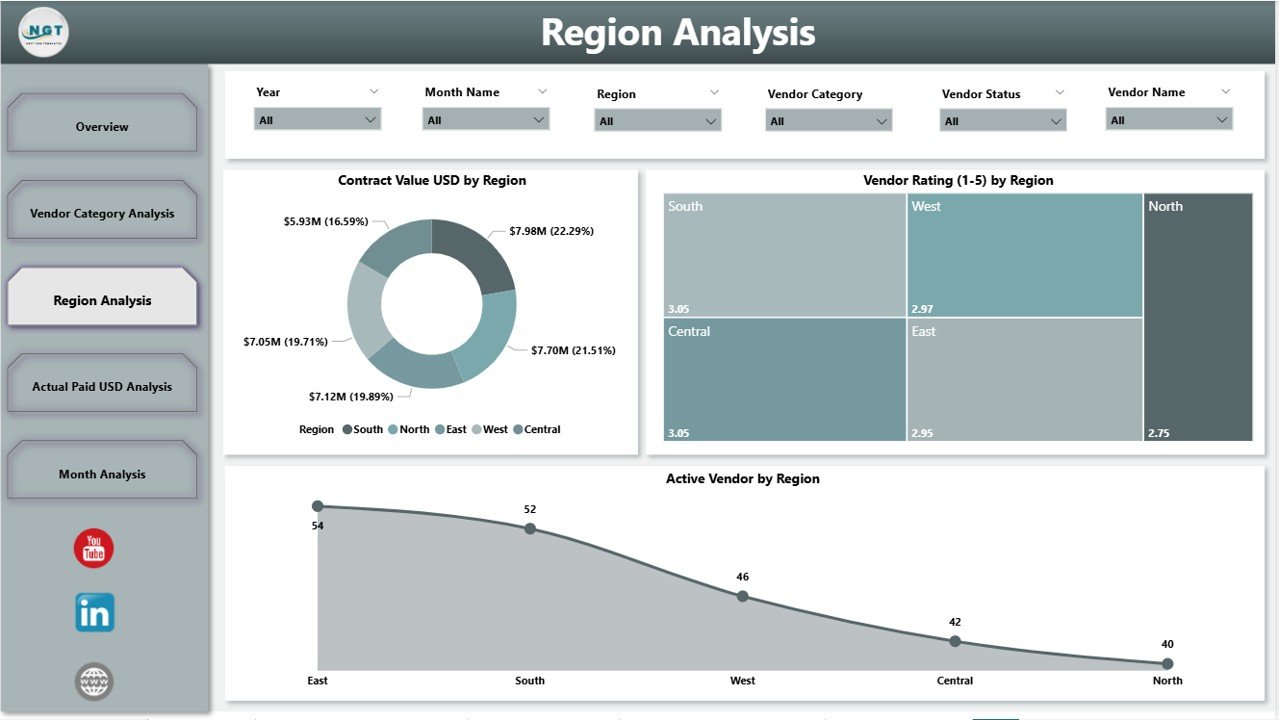
The Region Analysis Page evaluates vendor performance geographically.
Why Regional Vendor Analysis Matters
Vendor risks and costs vary by region due to regulations, logistics, and market conditions. Therefore, regional visibility supports better planning.
Key Charts on Region Analysis Page
-
Contract Value USD by Region
Shows spending concentration across regions. -
Vendor Rating by Region
Helps compare service quality region-wise. -
Active Vendors by Region
Displays vendor distribution across locations.
Because of this analysis, companies balance regional vendor dependency and reduce geographic risk.
Actual Paid USD Analysis: Where Is the Money Going?
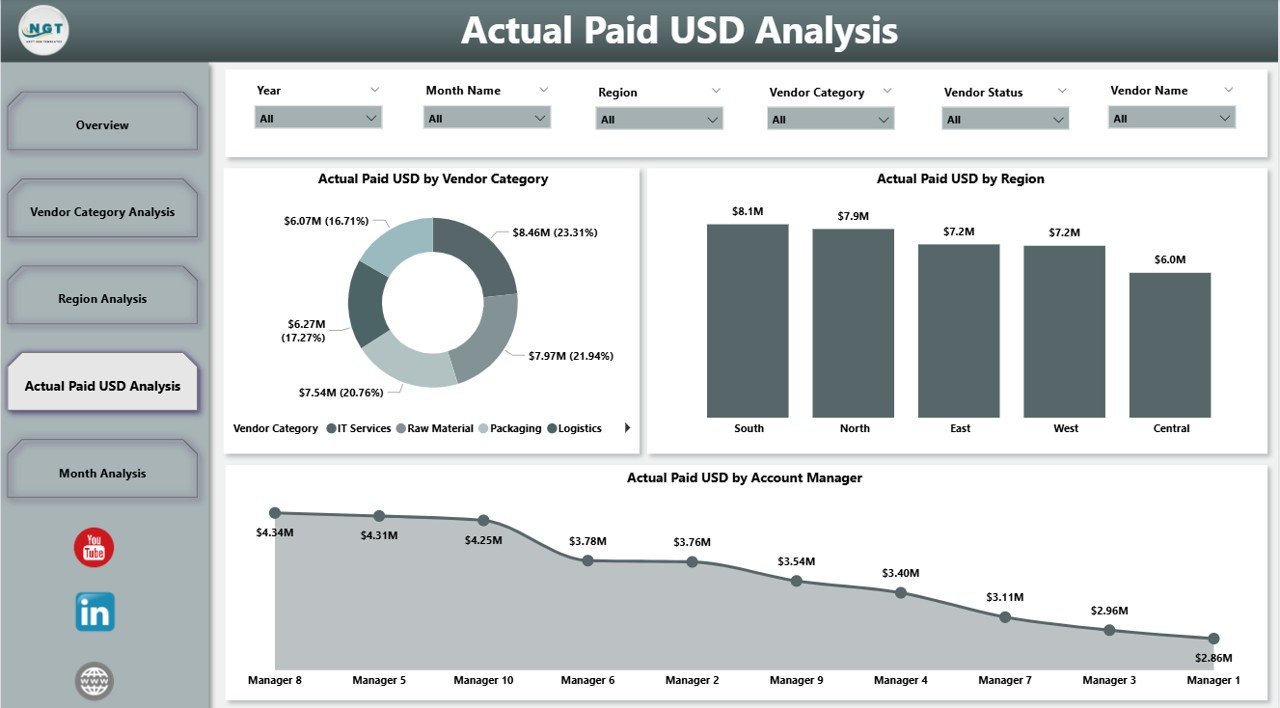
The Actual Paid USD Analysis Page focuses on vendor payments and cash flow.
Why Payment Analysis Is Critical
Payments directly impact working capital and vendor trust. Therefore, payment visibility remains essential.
Key Charts on Actual Paid USD Analysis Page
-
Actual Paid USD by Vendor Category
Shows which categories receive the most payments. -
Actual Paid USD by Region
Highlights regional cash outflow trends. -
Actual Paid USD by Account Manager
Helps evaluate account manager payment control.
As a result, finance teams can identify payment leakage and optimize cash planning.
Monthly Trends Page: How Do Vendor Metrics Change Over Time?
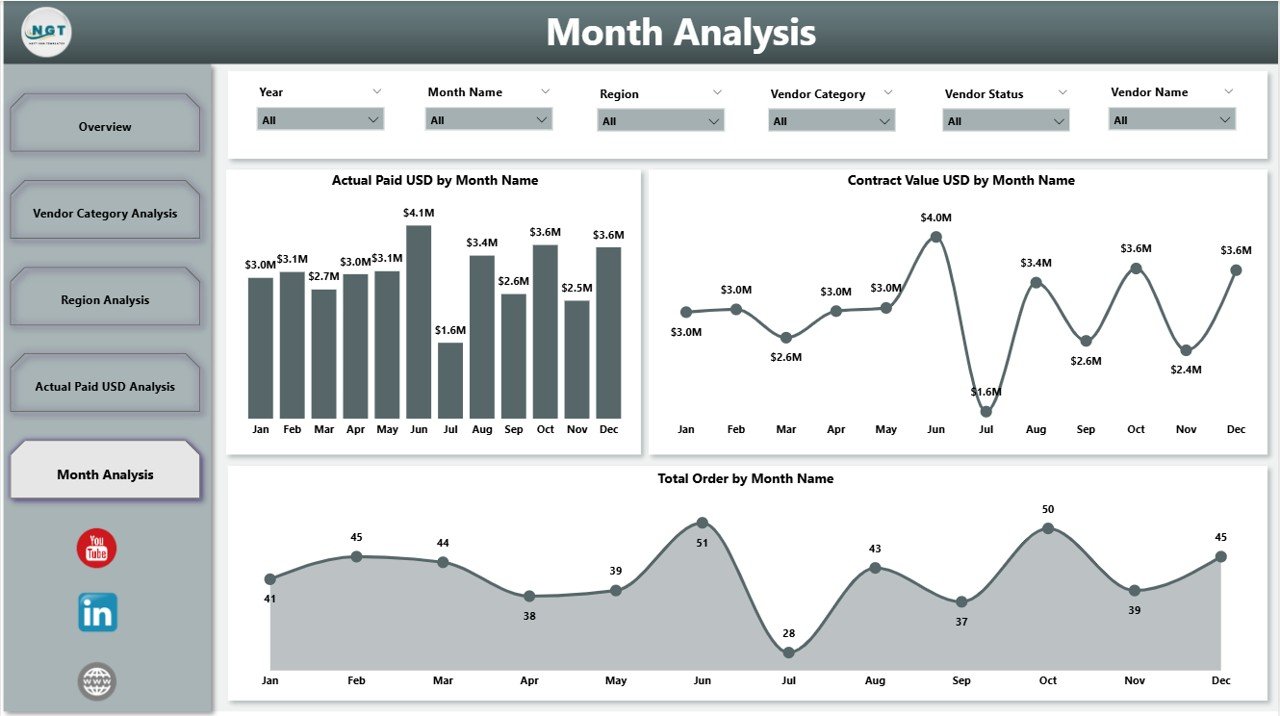
The Monthly Trends Page tracks vendor performance trends month by month.
Key Charts on Monthly Trends Page
-
Actual Paid USD by Month
Shows monthly payment patterns. -
Contract Value USD by Month
Highlights contract growth or reduction trends. -
Total Orders by Month
Tracks procurement volume over time.
Because trends reveal long-term behavior, leadership can forecast spending and vendor demand accurately.
Click to Purchases Vendor Management Dashboard in Power BI
What Are the Key KPIs Tracked in a Vendor Management Dashboard in Power BI?
A robust Vendor Management Dashboard typically tracks:
-
Active Vendor %
-
Vendor Rating
-
Contract Value USD
-
Payment Variance USD
-
Actual Paid USD
-
Contractual Lead Time Days
-
Total Orders
-
Vendor Performance by Category, Region, and Manager
Together, these KPIs provide a complete vendor performance picture.
Advantages of Vendor Management Dashboard in Power BI
A Vendor Management Dashboard in Power BI delivers strong business value.
Key Advantages
-
Centralized vendor data for faster decisions
-
Improved vendor performance visibility
-
Early identification of risks and delays
-
Better contract and payment control
-
Stronger negotiation power with vendors
-
Reduced manual reporting effort
-
Interactive and real-time insights
Therefore, organizations gain both operational efficiency and financial control.
Who Should Use a Vendor Management Dashboard in Power BI?
This dashboard benefits multiple roles:
-
Procurement Managers
-
Vendor Relationship Managers
-
Finance and Accounts Teams
-
Supply Chain Managers
-
Regional Heads
-
Senior Leadership
Because everyone works from the same data, alignment improves across teams.
Best Practices for the Vendor Management Dashboard in Power BI
To get maximum value, organizations should follow proven best practices.
1. Define Clear Vendor KPIs
First, define measurable KPIs such as rating, lead time, and payment variance. Clear KPIs drive better accountability.
2. Maintain Clean Vendor Master Data
Always keep vendor names, categories, and regions consistent. Clean data improves dashboard accuracy.
3. Update Data Regularly
Refresh vendor data weekly or monthly. Regular updates keep insights relevant.
4. Use Slicers Effectively
Apply slicers for region, category, and time period. Filters help users explore insights faster.
5. Review Trends, Not Just Numbers
Focus on monthly trends instead of one-time values. Trends reveal real performance patterns.
6. Align Dashboard with Business Goals
Ensure dashboard KPIs align with cost control, compliance, and quality goals.
7. Share Insights Across Teams
Encourage procurement, finance, and leadership teams to review dashboards together.
By following these practices, organizations maximize dashboard impact.
How Does a Vendor Management Dashboard Improve Decision-Making?
This dashboard supports decision-making by:
-
Highlighting underperforming vendors early
-
Supporting data-backed contract negotiations
-
Improving budget planning and forecasting
-
Enhancing vendor accountability
-
Reducing dependency on gut feeling
As a result, decisions become faster, smarter, and more confident.
Click to Purchases Vendor Management Dashboard in Power BI
Conclusion: Why Is a Vendor Management Dashboard in Power BI Essential?
A Vendor Management Dashboard in Power BI transforms how organizations manage vendors. Instead of reacting to issues late, businesses proactively monitor performance, payments, and risks.
Because the dashboard combines overview insights, category analysis, regional performance, payment tracking, and monthly trends, it delivers a complete vendor management solution. Moreover, Power BI’s interactivity ensures that insights stay actionable and current.
Therefore, any organization that wants better vendor control, reduced costs, and stronger partnerships should adopt a Vendor Management Dashboard in Power BI.
Frequently Asked Questions (FAQs)
1. What is a Vendor Management Dashboard in Power BI used for?
A Vendor Management Dashboard in Power BI tracks vendor performance, contracts, payments, and trends in one interactive platform.
2. Can small businesses use a Vendor Management Dashboard in Power BI?
Yes, small businesses can use it to control vendor costs, track payments, and improve vendor relationships effectively.
3. What data sources can connect to a Vendor Management Dashboard?
The dashboard can connect to Excel files, ERP systems, accounting software, and procurement tools.
4. How often should vendor data be updated?
Organizations should update vendor data monthly or weekly, depending on transaction volume.
5. Does Power BI require technical skills to use the dashboard?
No, end users can easily interact with slicers and charts without technical expertise.
6. Can the dashboard track vendor compliance and risk?
Yes, by adding compliance KPIs and risk indicators, the dashboard can support risk monitoring.
7. How does the dashboard help in vendor negotiations?
The dashboard provides performance and payment data that strengthens negotiation positions with vendors.
Visit our YouTube channel to learn step-by-step video tutorials