In the food delivery industry, tracking performance metrics is vital to ensure smooth operations, enhance customer satisfaction, and improve profitability.
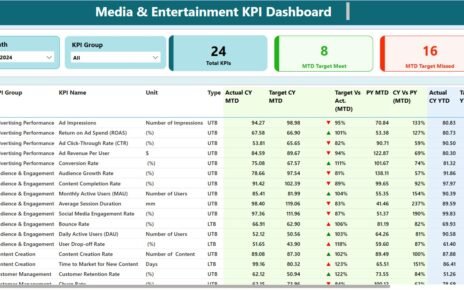
The Media & Entertainment KPI Dashboard in Power BI is a powerful tool designed to help media and entertainment businesses
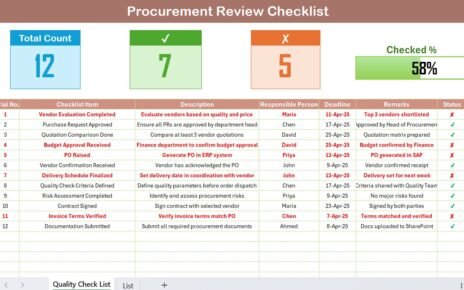
Managing procurement efficiently can make or break the success of any organization. To ensure nothing slips through the cracks, having