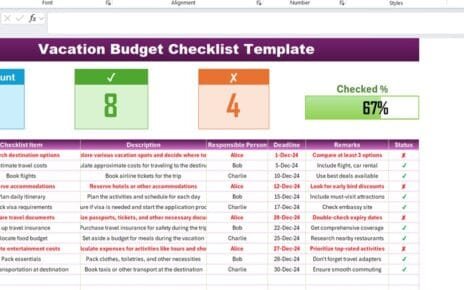
Planning a vacation is exciting, but it can quickly become overwhelming if you don’t have a structured approach. Between budgeting,
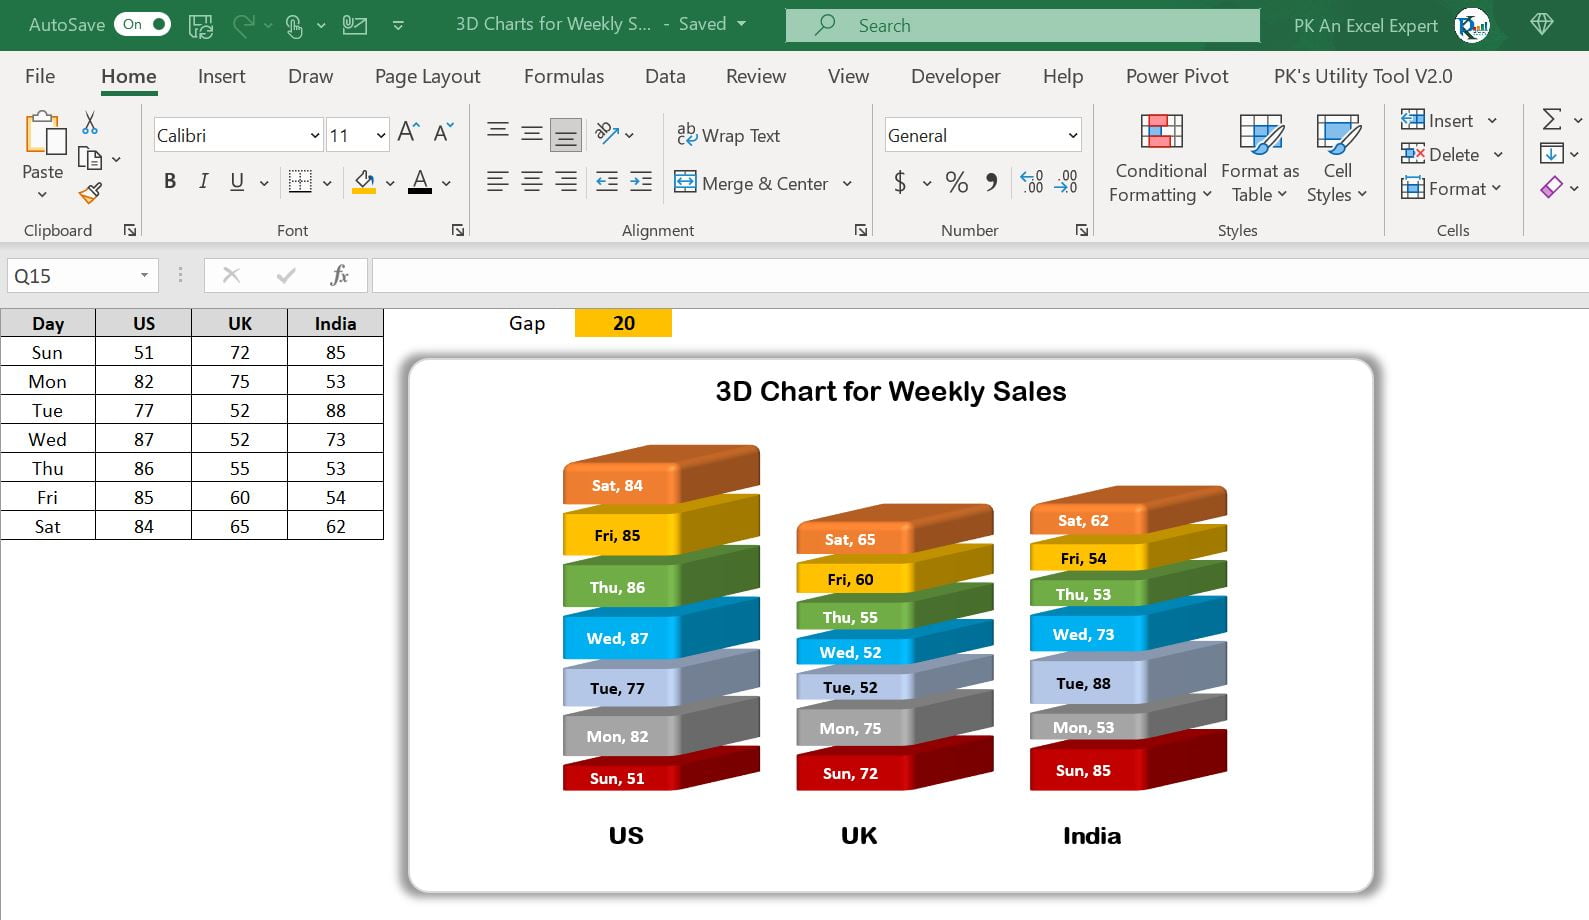
Visualizing data effectively is essential to understanding performance metrics and achieving business goals. Progress bar charts offer a clear, stylish
Aviation operations involve the seamless coordination of many variables to ensure safe, efficient, and timely travel. From flight schedules to