In every organization, internal controls and audit processes form the backbone of transparency, accountability, and financial health. However, managing and tracking audit performance through traditional spreadsheets can be both time-consuming and error-prone. That’s why the Audit & Internal Controls Dashboard in Power BI has become an essential tool for auditors, compliance officers, and financial leaders.
This powerful dashboard helps users visualize, monitor, and analyze internal audit data in one interactive interface. With it, you can track audit completion rates, financial impact, risk exposure, and department-wise findings in real-time — all without manual reporting.
Let’s explore what this dashboard offers, why it matters, and how it can transform your audit management process.
Click to Purchases Audit & Internal Controls Dashboard in Power BI
What Is an Audit & Internal Controls Dashboard in Power BI?
An Audit & Internal Controls Dashboard is a data visualization tool built using Microsoft Power BI, designed to centralize and analyze audit-related information across departments, regions, and audit types. It gives a real-time view of your audit activities and control effectiveness, helping you spot risks early and ensure compliance with internal policies.
This dashboard simplifies complex data into a set of interactive visuals and metrics, allowing teams to make informed decisions faster. Instead of reviewing endless Excel sheets, auditors can now use a single Power BI dashboard to understand performance trends, identify problem areas, and assess the impact of findings instantly.
📊 Key Features of the Audit & Internal Controls Dashboard in Power BI
This Power BI file includes five interactive pages, each designed to provide actionable insights from a specific perspective — Overview, Department Analysis, Audit Type Analysis, Region Analysis, and Monthly Trends.
🏠 1. Overview Page
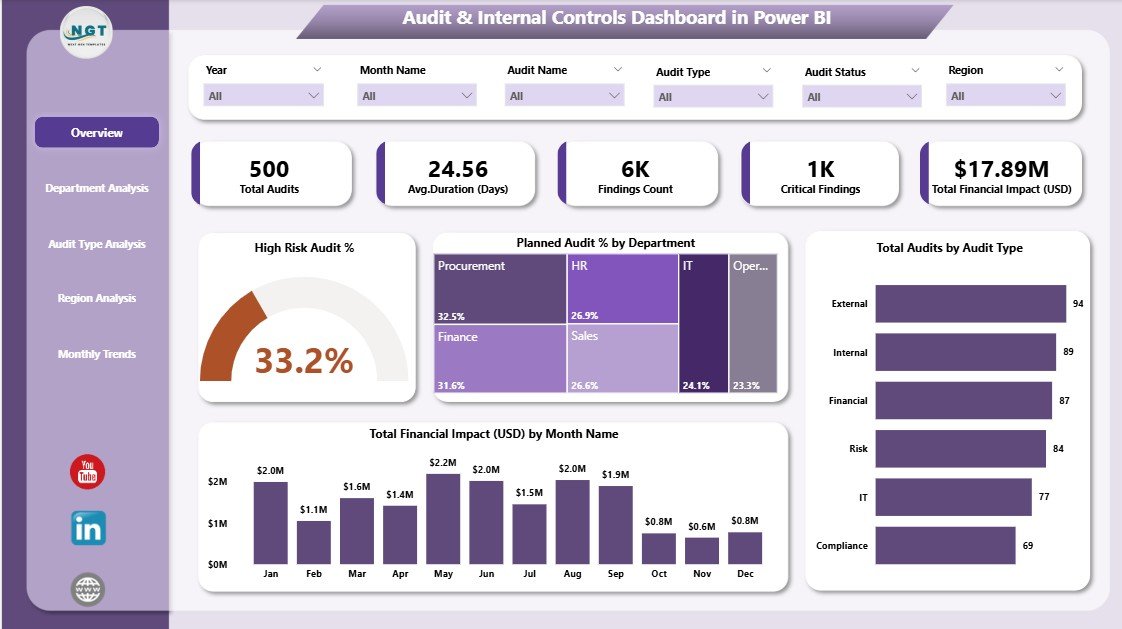
The Overview Page serves as the central hub of the dashboard.
It summarizes the overall audit performance and gives you a quick snapshot of key metrics.
Highlights include:
-
📈 Five KPI Cards displaying top-level insights such as total audits, completed audits, pending audits, high-risk audits percentage, and total financial impact (USD).
📊 Four dynamic charts showing:
- High-Risk Audit %
- Planned Audit % by Department
- Total Audits by Audit Type
- Total Financial Impact (USD) by Month
With slicers, users can filter data by month, department, region, or audit type, ensuring complete flexibility.
This page acts as your real-time control tower — helping management instantly see the organization’s overall audit health.
🏢 2. Department Analysis Page
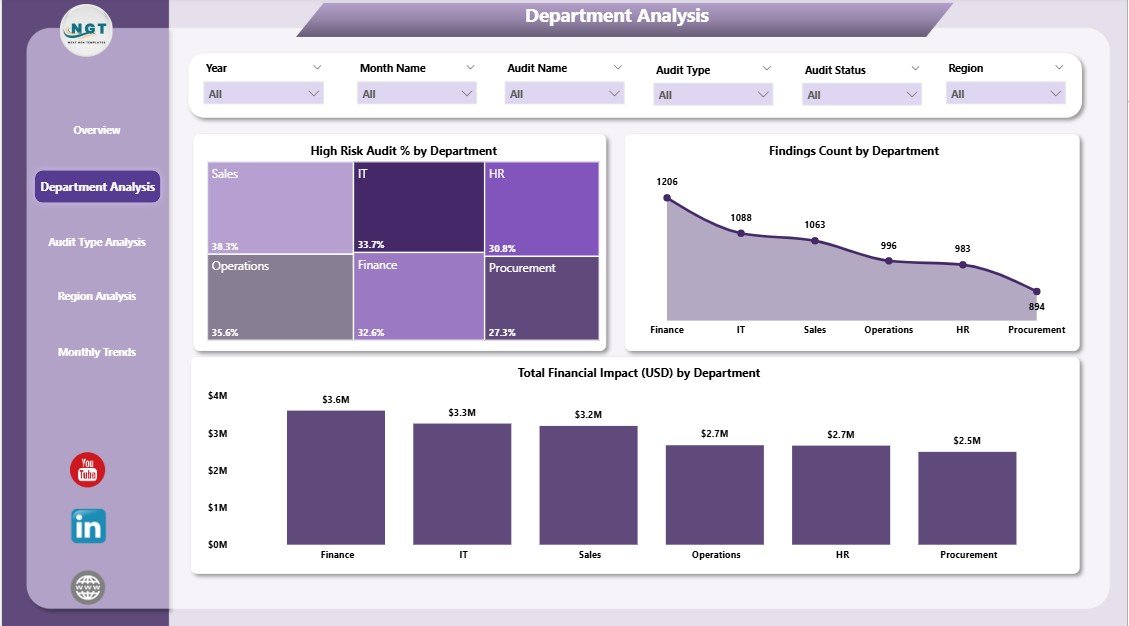
This page focuses on how each department performs in terms of audit planning, risk management, and financial impact.
Key Visuals:
-
High-Risk Audit % by Department
-
Finding Count by Department
-
Total Financial Impact (USD) by Department
By using interactive slicers, users can compare departmental performance, uncover trends, and spot outliers. For example, if one department consistently shows higher audit findings or risk percentages, it signals a need for deeper review or stronger controls.
This feature helps the internal audit team prioritize high-risk departments and allocate audit resources effectively.
Click to Purchases Audit & Internal Controls Dashboard in Power BI
📂 3. Audit Type Analysis Page
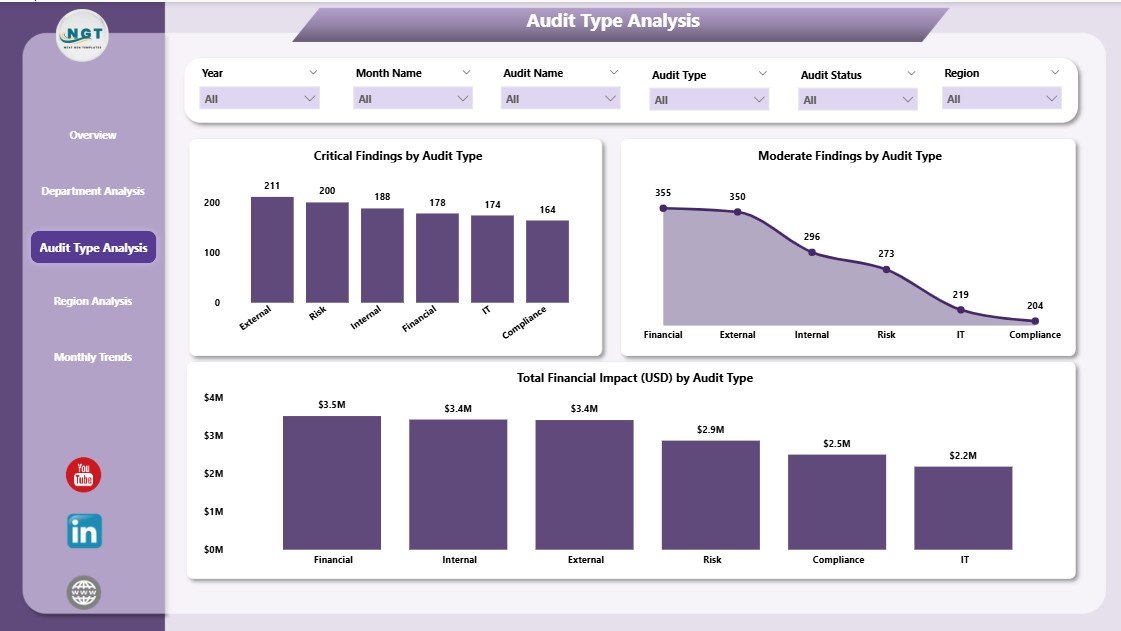
Different types of audits — such as operational, financial, IT, or compliance — come with different patterns of findings and impacts.
The Audit Type Analysis Page provides a clear breakdown of each audit category.
Included Charts:
-
Critical Findings by Audit Type
-
Moderate Findings by Audit Type
-
Total Finding Impact (USD) by Audit Type
These visuals highlight which audit types tend to produce more critical issues or financial implications.
By reviewing these trends, audit leaders can adjust audit frequencies, refine audit scopes, and improve preventive controls for the future.
🌍 4. Region Analysis Page
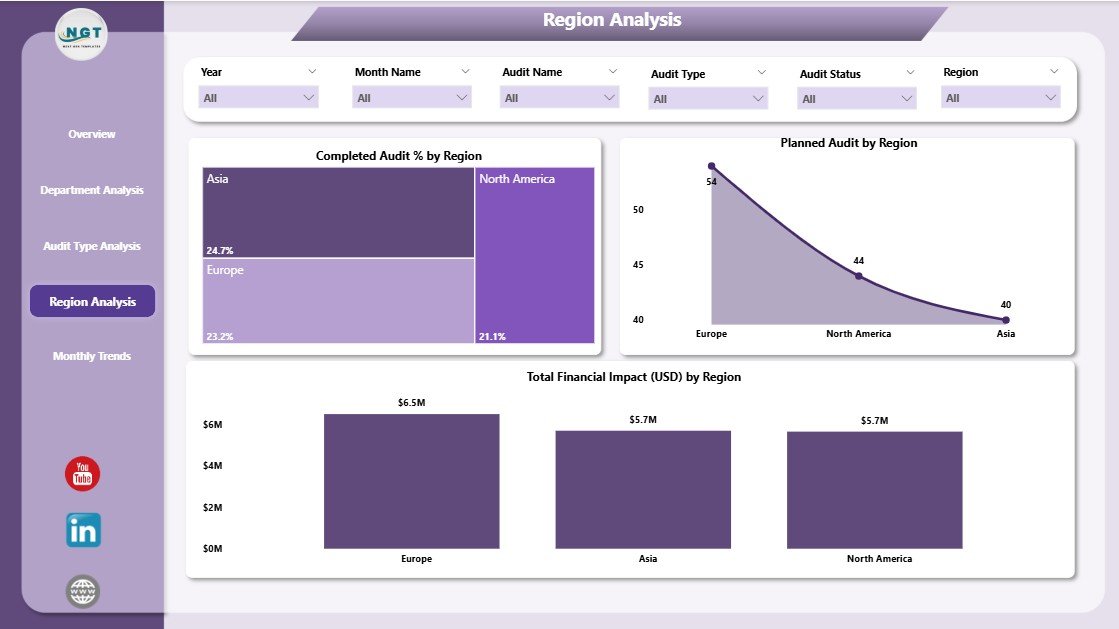
Large organizations often operate across multiple regions, and understanding how audit performance varies geographically is vital.
The Region Analysis Page helps visualize the completion status, planning rate, and financial exposure by location.
Charts on this page:
-
Completed Audit % by Region
-
Planned Audit % by Region
-
Total Financial Impact (USD) by Region
This regional comparison allows audit managers to ensure consistent compliance across branches, evaluate regional audit preparedness, and identify high-risk geographies where control mechanisms might be weaker.
📅 5. Monthly Trends Page
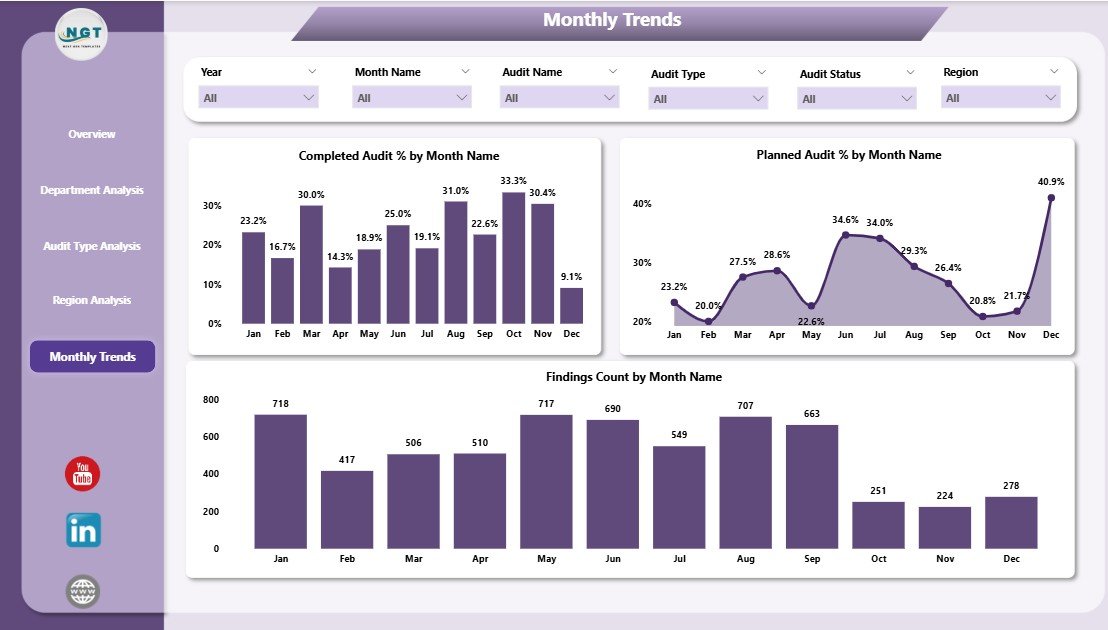
Audit results often vary month to month, especially during peak operational periods.
The Monthly Trends Page helps you understand the temporal performance of audits throughout the year.
Displayed Charts:
-
Completed Audit % by Month
-
Planned Audit % by Month
-
Finding Count by Month
By visualizing monthly fluctuations, you can assess audit team productivity, track issue resolution patterns, and forecast future workloads.
This feature helps top management make data-driven decisions regarding audit schedules and manpower allocation.
💡 Why Power BI for Audit & Internal Controls?
Microsoft Power BI is one of the most popular business intelligence platforms for audit professionals because it offers automation, interactivity, and real-time analysis.
Here’s why Power BI is ideal for internal control reporting:
-
Real-time visibility: Connect your audit data sources directly and refresh dashboards automatically.
-
Interactive visuals: Drill down into data without recreating reports manually.
-
Centralized reporting: Combine all audit data in one secure platform accessible to all stakeholders.
-
Data accuracy: Reduces the risk of human error through automation.
-
Ease of use: Even non-technical users can navigate, filter, and analyze audit results effortlessly.
By leveraging Power BI’s capabilities, the Audit & Internal Controls Dashboard offers both strategic insight and operational efficiency.
🚀 Advantages of Using an Audit & Internal Controls Dashboard in Power BI
Implementing this dashboard offers a wide range of benefits across the organization.
✅ 1. Enhanced Transparency
All audit information becomes centralized and accessible. Managers and auditors can see who completed what, when, and how effectively — ensuring full visibility across departments.
Click to Purchases Audit & Internal Controls Dashboard in Power BI
✅ 2. Improved Risk Management
High-risk areas are easy to spot thanks to visual indicators like percentages, color coding, and trend lines.
This helps leadership take preventive actions before small issues escalate into major problems.
✅ 3. Faster Decision-Making
Interactive visuals and real-time data updates empower executives to make quick, evidence-based decisions without waiting for monthly reports.
✅ 4. Better Resource Allocation
Department- and region-wise breakdowns show where resources are overused or underused, allowing teams to optimize audit workloads efficiently.
✅ 5. Consistent Compliance Monitoring
Continuous tracking of planned vs. completed audits ensures that compliance requirements are always met across business units.
✅ 6. Financial Insight
Monitoring the Total Financial Impact (USD) of audit findings helps prioritize high-impact risks and align budgets accordingly.
✅ 7. Customizable for Any Organization
You can easily modify this Power BI dashboard for your company’s structure, KPIs, and audit methodologies.
🧠 How This Dashboard Improves Internal Control Systems
Internal controls are vital for maintaining integrity, preventing fraud, and ensuring accurate financial reporting.
This Power BI dashboard supports these goals by offering a data-driven control monitoring system.
Here’s how it strengthens your internal control process:
-
Tracks Audit Planning vs. Execution: Ensures that audit plans align with organizational goals.
-
Identifies Control Gaps: Visuals pinpoint where procedures fail or are not followed.
-
Monitors Audit Findings: Helps assess recurring issues and their root causes.
-
Measures Control Effectiveness: KPI metrics reveal if controls are mitigating risks as intended.
-
Supports Continuous Improvement: Historical trend analysis helps refine internal audit frameworks.
This combination of analytical insight and visual simplicity ensures that management always has a clear view of control performance.
🛠️ Best Practices for Using the Audit & Internal Controls Dashboard in Power BI
To get the best out of this dashboard, it’s essential to follow a few best practices:
1️⃣ Maintain Accurate Data Sources
Connect your Power BI dashboard directly to your audit management system, spreadsheets, or ERP for real-time updates. Avoid manual entry whenever possible.
2️⃣ Set Clear KPI Definitions
Define each KPI — like “High-Risk Audit %” or “Total Financial Impact (USD)” — clearly. This ensures consistency and avoids misinterpretation among team members.
3️⃣ Use Filters Wisely
Power BI slicers allow you to filter by month, department, region, or audit type. Use these smartly to gain deeper insights into specific problem areas.
4️⃣ Automate Data Refresh
Schedule automatic refreshes to ensure that your dashboard always shows the most recent audit status and findings.
5️⃣ Secure Sensitive Information
Use Power BI’s role-based access controls to protect confidential audit data from unauthorized users.
6️⃣ Review Trends Regularly
Check monthly and regional trends to spot patterns and proactively address recurring audit issues.
7️⃣ Integrate with Existing Tools
Integrate Power BI with Excel or SharePoint to streamline workflows and simplify data sharing across teams.
8️⃣ Train Your Audit Team
Provide short Power BI training to auditors so they can interpret visuals correctly and make better use of insights.
By following these practices, organizations can maximize the value of their Power BI audit dashboard and improve governance performance.
💼 Who Can Benefit from the Audit & Internal Controls Dashboard
This Power BI dashboard serves a variety of professionals across industries:
-
Internal Auditors: Track progress, findings, and control gaps.
-
Finance Teams: Understand the financial impact of audits.
-
Compliance Officers: Monitor adherence to internal policies.
-
Department Heads: Gain transparency into team-level performance.
-
Executives: View a summary of organization-wide risk and control health.
-
Consultants: Use it to advise clients on improving internal processes.
Whether you’re in banking, manufacturing, government, or education, this dashboard adapts easily to any environment that values accountability.
📈 Real-World Applications
Let’s look at a few real-life examples of how organizations can use this dashboard:
-
A global bank uses it to track audit findings across 12 countries and identify high-risk business units.
-
A manufacturing firm monitors compliance with safety and environmental audits.
-
A government department reviews planned vs. completed audits quarterly to meet compliance deadlines.
-
An NGO evaluates financial impact and donor audit transparency through the Power BI dashboard.
These applications show how adaptable and versatile the Audit & Internal Controls Dashboard can be for different operational needs.
🧾 Conclusion
The Audit & Internal Controls Dashboard in Power BI isn’t just a visualization tool — it’s a game-changer for modern governance.
It helps organizations strengthen accountability, manage risks effectively, and ensure compliance — all through a unified, real-time, and data-driven approach.
By leveraging this Power BI solution, businesses can replace tedious manual reporting with automated insights that empower better decisions and faster corrective actions.
If you’re looking to streamline your internal audit management, this dashboard is your ideal companion for achieving clarity, efficiency, and transparency in every audit cycle.
❓ Frequently Asked Questions (FAQs)
1. What is the purpose of an Audit & Internal Controls Dashboard in Power BI?
The purpose is to centralize, visualize, and analyze audit data in real time. It helps organizations track performance, identify risks, and monitor compliance effectively.
2. How is this dashboard different from Excel reports?
Unlike static Excel sheets, Power BI dashboards are interactive and automatically updated. You can filter, drill down, and explore data from multiple perspectives instantly.
3. Can this dashboard handle multiple departments and regions?
Yes, it’s designed to manage multi-department and multi-region audits using interactive slicers and filters.
4. Do I need advanced technical skills to use it?
No. Power BI dashboards are user-friendly and require minimal technical knowledge. Basic training is enough to navigate and interpret results.
5. Can I customize KPIs in the dashboard?
Absolutely. All KPI cards and visuals are customizable to match your organization’s unique audit objectives and reporting structure.
6. Is my audit data secure in Power BI?
Yes. Power BI provides robust role-based access, data encryption, and secure cloud storage options to keep audit information protected.
7. How often should I update the dashboard?
Ideally, schedule daily or weekly data refreshes to keep insights accurate and relevant.
8. Can small businesses use this dashboard too?
Yes, Power BI dashboards are scalable. Small and mid-sized organizations can use them just as effectively as large enterprises.
9. What insights can managers get from this dashboard?
Managers can instantly see risk exposure, audit progress, compliance rates, and financial impact — all in a single interactive interface.
10. Where can I get this Audit & Internal Controls Dashboard in Power BI?
You can download the ready-to-use version from NextGenTemplates.com, where it’s available for instant access and full customization.
Visit our YouTube channel to learn step-by-step video tutorials