Effective irrigation management is essential for modern agriculture. Monitoring water usage, pump efficiency, field coverage, and system performance requires accurate data. Without proper tracking, irrigation systems can waste resources, increase costs, and reduce crop yield. That’s where the Irrigation Systems KPI Dashboard in Power BI comes into play.
This dashboard provides a ready-to-use solution for irrigation monitoring. It collects data from Excel, tracks key metrics, visualizes trends, and allows operators and managers to make smarter decisions quickly. In this article, we will explore the dashboard’s structure, features, benefits, best practices, and FAQs to help you maximize your irrigation system performance.
Click to Purchases Irrigation Systems KPI Dashboard in Power BI
What Is an Irrigation Systems KPI Dashboard in Power BI?
An Irrigation Systems KPI Dashboard in Power BI is a performance tracking tool that shows all important Key Performance Indicators (KPIs) in a single interface. It uses Excel as a data source and Power BI to visualize data through charts, tables, and indicators.
The dashboard includes three main pages:
-
Summary Page – The central hub for KPI tracking.
-
KPI Trend Page – Visualizes performance over time.
-
KPI Definition Page – Explains each KPI’s formula and purpose.
With this dashboard, irrigation managers, farm operators, and agricultural engineers can instantly see system performance, water usage efficiency, and areas needing attention.
Why Monitoring Irrigation KPIs Is Crucial
Modern irrigation systems are complex. They include multiple pumps, sensors, pipelines, and field zones. KPIs help in:
-
Optimizing water usage
-
Reducing operational costs
-
Improving crop yield
-
Preventing system downtime
-
Tracking seasonal trends
-
Ensuring regulatory compliance
Without a KPI dashboard, managers rely on manual data collection, which is error-prone and time-consuming. The dashboard provides real-time insights and supports proactive management.
Click to Purchases Irrigation Systems KPI Dashboard in Power BI
Key Features of the Irrigation Systems KPI Dashboard in Power BI
The dashboard comes ready to use in Power BI Desktop. Its features are designed to provide both high-level summaries and detailed KPI insights.
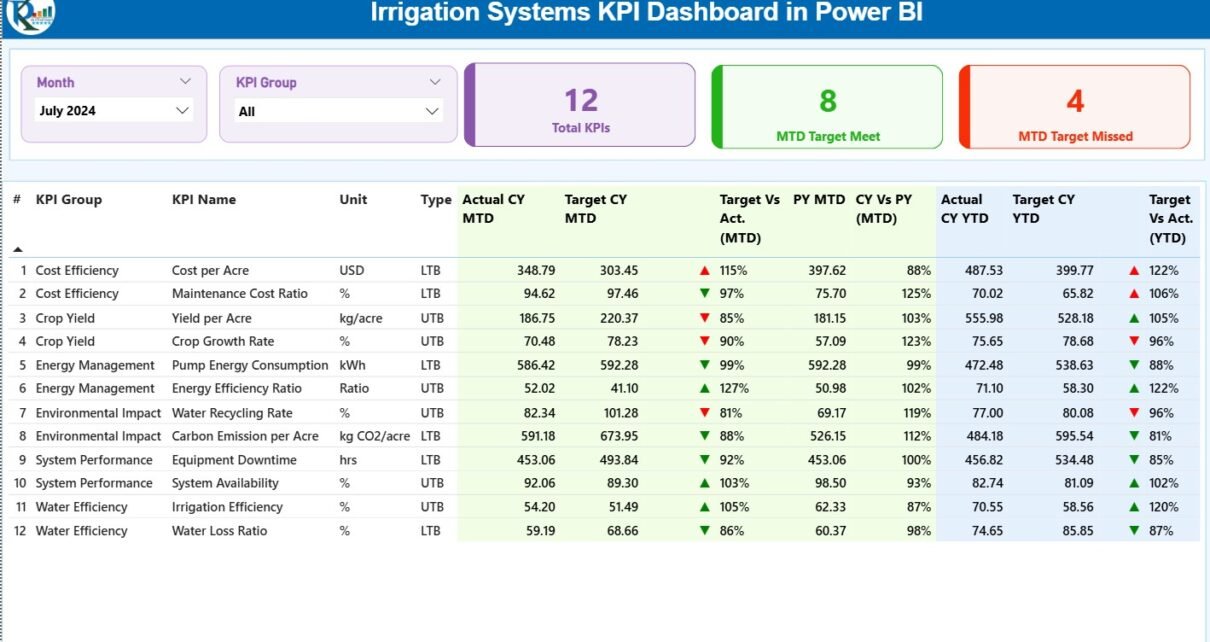
1. Summary Page – Main Performance Overview
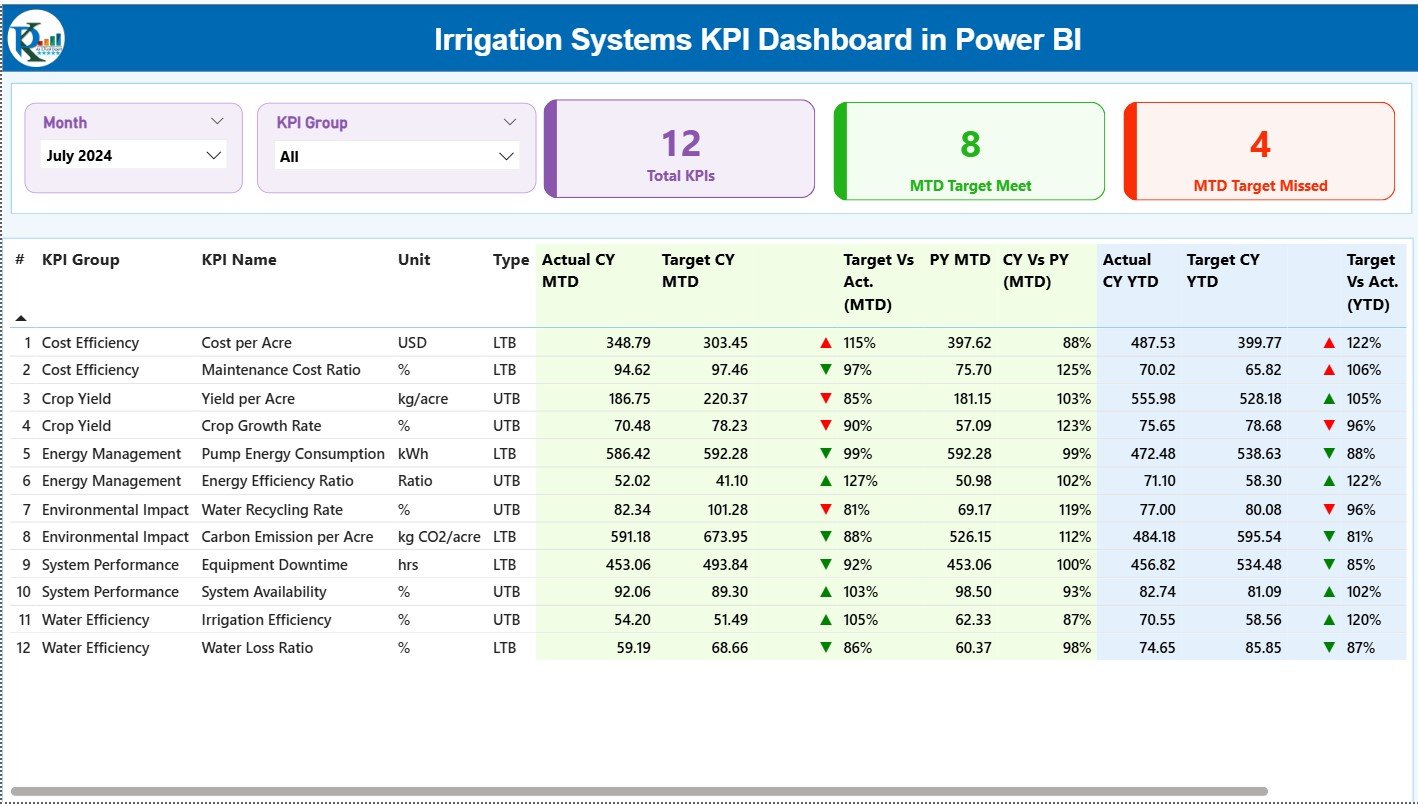
The Summary Page is the central page for monitoring irrigation KPIs.
Key Elements
-
Month Slicer – Filter data by month.
-
KPI Group Slicer – Filter KPIs by category (e.g., Water Usage, Pump Efficiency).
-
Cards for Quick Metrics
-
Total KPIs Count
-
MTD (Month-To-Date) Target Met Count
-
MTD Target Missed Count
-
These cards give a quick snapshot of the system’s health.
Detailed KPI Table
Below the cards, a detailed table displays:
-
KPI Number – Sequence of the KPI
-
KPI Group – Category such as Pump Performance or Water Usage
-
KPI Name – Name of the KPI
-
Unit – Unit of measurement
-
Type – LTB (Lower the Better) or UTB (Upper the Better)
-
Actual CY MTD – Actual value for the current month
-
Target CY MTD – Monthly target
-
MTD Icon – Green ▲ for met, Red ▼ for missed
-
Target vs Actual MTD % – Performance percentage
-
PY MTD – Previous year MTD for comparison
-
CY vs PY MTD % – Growth or drop percentage
-
Actual CY YTD – Year-To-Date actual value
-
Target CY YTD – Year-To-Date target
-
YTD Icon – Visual indicator
-
Target vs Actual YTD %
-
PY YTD – Previous year YTD
-
CY vs PY YTD % – Year-over-year performance
This table allows managers to see performance against targets, identify problem areas, and track improvements.
Click to Purchases Irrigation Systems KPI Dashboard in Power BI
2. KPI Trend Page – Track Performance Over Time
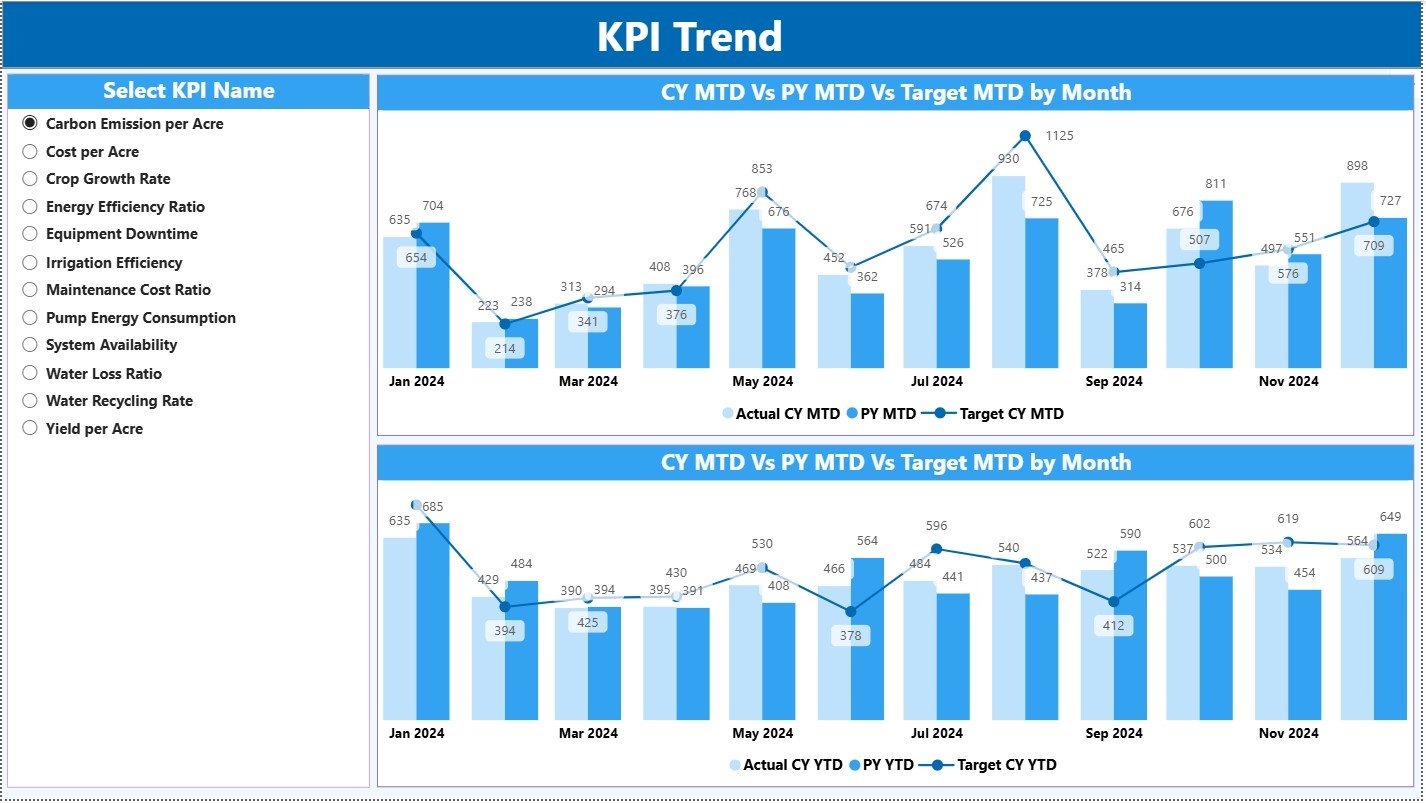
The KPI Trend Page provides trend analysis using charts.
Key Elements
-
KPI Name Slicer – Select any KPI to track.
-
Two Combo Charts
-
MTD Actual, Target, and Previous Year
-
YTD Actual, Target, and Previous Year
-
This page helps monitor long-term trends like seasonal water consumption, efficiency improvements, and system performance over multiple months or years.
3. KPI Definition Page – Clear KPI Understanding
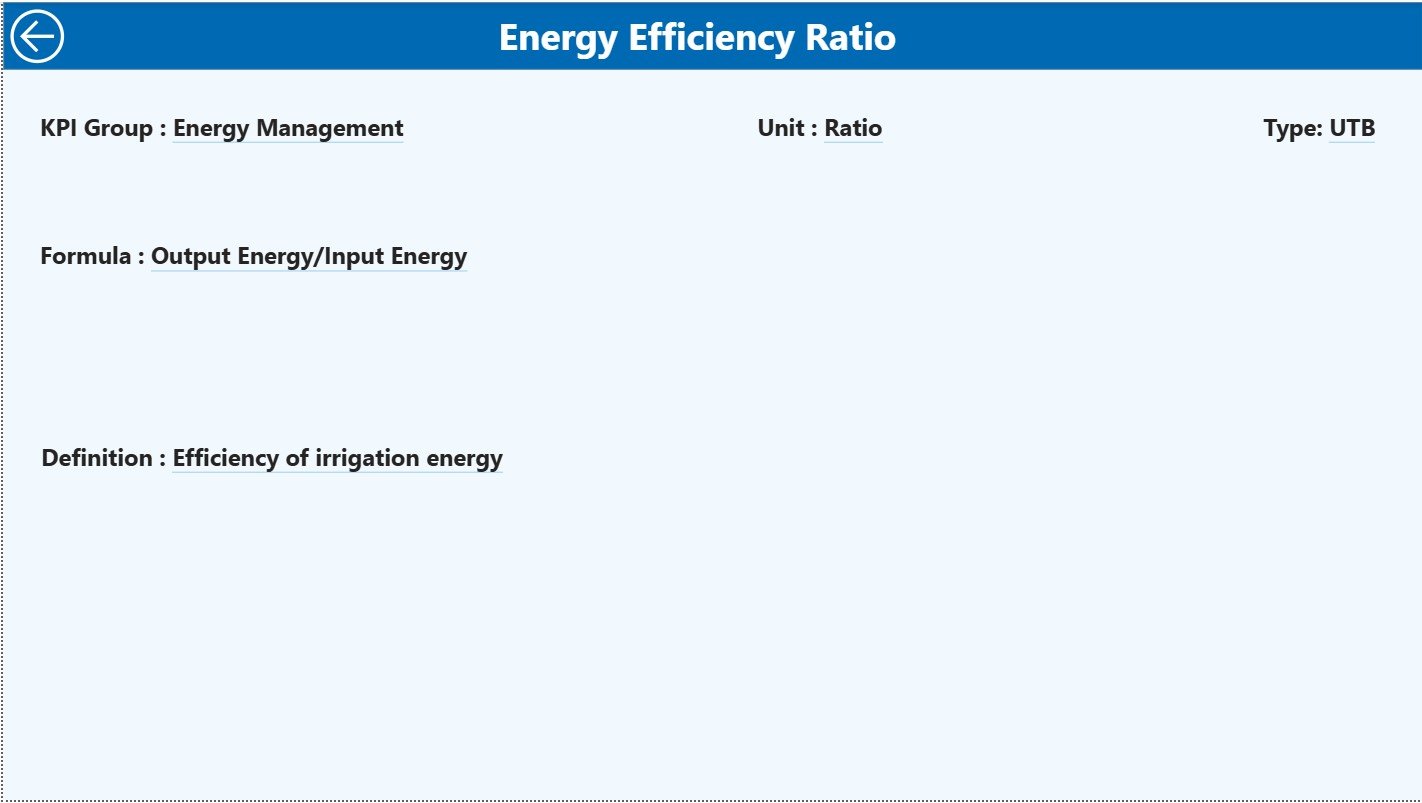
The KPI Definition Page is hidden but accessible via drill-through.
Contents
-
KPI Number
-
KPI Group
-
KPI Name
-
Unit
-
Type (LTB or UTB)
-
Formula
-
Detailed KPI Definition
This ensures every team member understands each metric and eliminates confusion during reporting.
Click to Purchases Irrigation Systems KPI Dashboard in Power BI
How the Excel Data Source Works
The dashboard uses an Excel file as the data source. It includes three worksheets:
1. Input_Actual Sheet
Fill:
-
KPI Name
-
Month (first date of month)
-
MTD Actual
-
YTD Actual
Power BI automatically updates visuals based on these values.
2. Input_Target Sheet
Fill:
-
KPI Name
-
Month
-
MTD Target
-
YTD Target
These values allow the dashboard to calculate target achievement percentages and display icons.
3. KPI Definition Sheet
Fill:
-
KPI Number
-
KPI Group
-
KPI Name
-
Unit
-
Formula
-
Definition
-
Type (LTB or UTB)
This keeps your KPIs organized and ensures the dashboard’s logic works correctly.
Click to Purchases Irrigation Systems KPI Dashboard in Power BI
Advantages of Irrigation Systems KPI Dashboard in Power BI
The dashboard provides several key benefits for irrigation management:
1. Real-Time Performance Monitoring
You instantly see the status of pumps, water distribution, and system performance.
2. Informed Decision Making
Compare actual and target values to make smart operational decisions, such as adjusting water supply or scheduling maintenance.
3. Simplified Data Visualization
Even complex irrigation systems can be monitored with simple tables, icons, and charts.
4. Improved Operational Efficiency
Identify underperforming pumps, pipelines, or zones and take corrective action quickly.
5. Easy Reporting
Replace time-consuming Excel reports with a single dashboard for management reviews.
6. Yearly and Seasonal Insights
Monitor trends across months and seasons to optimize irrigation schedules.
7. Reduced Water Wastage and Costs
By tracking performance, you ensure water is used efficiently, saving money and resources.
Best Practices for Using the Irrigation Systems KPI Dashboard
Follow these best practices for maximum impact:
1. Keep KPIs Clear and Updated
Define each KPI precisely and update definitions regularly.
2. Maintain Accurate Data in Excel
Correct data entry ensures the dashboard shows reliable results. Avoid gaps or errors.
3. Monitor Weekly and Monthly
Regular checks help detect issues early and allow proactive corrections.
4. Use LTB and UTB Properly
-
LTB (Lower the Better) – Water wastage, energy consumption
-
UTB (Upper the Better) – Pump efficiency, field coverage
Correct classification ensures icons reflect true performance.
5. Compare Current and Previous Year
Tracking year-over-year helps identify trends and improvements.
6. Keep Dashboard Simple
Avoid unnecessary visuals. A clean layout improves readability.
7. Train Your Team
Educate operators and managers on how to read KPIs to maximize benefits.
Click to Purchases Irrigation Systems KPI Dashboard in Power BI
How Irrigation Managers Can Use This Dashboard Daily
Practical applications include:
-
Monitor pump performance
-
Track water usage efficiency
-
Identify irrigation coverage gaps
-
Reduce downtime through preventive maintenance
-
Compare MTD and YTD performance
-
Plan irrigation schedules based on trends
-
Track energy consumption per field
-
Evaluate system upgrades or expansions
-
Ensure compliance with water regulations
Conclusion
The Irrigation Systems KPI Dashboard in Power BI is a complete solution for managing modern irrigation operations. It provides clarity, reduces errors, and enables data-driven decisions. With Summary, Trend, and Definition pages, managers gain an organized view of all KPIs.
Proper use, accurate data entry, and consistent monitoring make this dashboard an indispensable tool for any farm or irrigation enterprise aiming to increase efficiency, reduce costs, and improve crop yield.
Click to Purchases Irrigation Systems KPI Dashboard in Power BI
Frequently Asked Questions (FAQs)
1. What is the Irrigation Systems KPI Dashboard in Power BI?
It is a ready-to-use dashboard that tracks key irrigation metrics using Excel data and Power BI visuals.
2. Do I need coding skills to use it?
No. Simply fill in the Excel sheets; Power BI handles the calculations and visuals automatically.
3. How often should I update the data?
Update weekly or monthly depending on system activity and reporting needs.
4. Can I add new KPIs?
Yes. Add them to the KPI Definition sheet and adjust visuals if necessary.
5. Who can use this dashboard?
Farm managers, irrigation operators, agricultural engineers, and analysts.
6. Can I track both MTD and YTD KPIs?
Yes. The dashboard shows Month-To-Date and Year-To-Date values with clear icons and trends.
7. Is the dashboard customizable?
Yes. You can modify visuals, KPIs, and formulas to suit your irrigation system’s needs.
Click to Purchases Irrigation Systems KPI Dashboard in Power BI
Visit our YouTube channel to learn step-by-step video tutorials