Public health programs are critical for improving population health, reducing disease burden, and ensuring access to quality healthcare services. Monitoring the effectiveness of these programs requires accurate data and clear performance indicators. That’s why a Public Health Programs KPI Dashboard in Excel becomes an essential tool for health administrators, program managers, and policymakers.
This dashboard is designed to provide a ready-to-use solution for tracking key metrics, comparing actual performance against targets, analyzing trends, and making data-driven decisions. In this article, you will learn everything about this dashboard, its structure, features, benefits, best practices, and frequently asked questions.
Click to Purchases Public Health Programs KPI Dashboard in Excel
What Is a Public Health Programs KPI Dashboard in Excel?
A Public Health Programs KPI Dashboard in Excel is a performance tracking tool that displays important Key Performance Indicators (KPIs) in a visually organized format. Unlike raw spreadsheets, this dashboard allows users to:
-
Select months and view filtered data
-
Compare actual, target, and previous year values
-
Visualize KPIs through charts and conditional formatting
-
Track both Month-To-Date (MTD) and Year-To-Date (YTD) performance
It is built entirely in Excel, making it accessible to health program teams without requiring specialized software knowledge.
Why Public Health Programs Need KPI Dashboards
Public health programs often deal with:
-
Multiple health initiatives running simultaneously
-
Data from various sources such as hospitals, clinics, and field surveys
-
Seasonal and demographic variations in health outcomes
-
Regulatory and reporting requirements
A KPI dashboard simplifies the complexity by providing:
-
Clear visibility of program performance
-
Quick identification of underperforming areas
-
Data-backed insights for resource allocation and planning
-
Standardized reporting across teams and stakeholders
Key Features of the Public Health Programs KPI Dashboard in Excel
This dashboard is designed with seven worksheets that cover every aspect of KPI monitoring and analysis.
1. Home Sheet – Easy Navigation
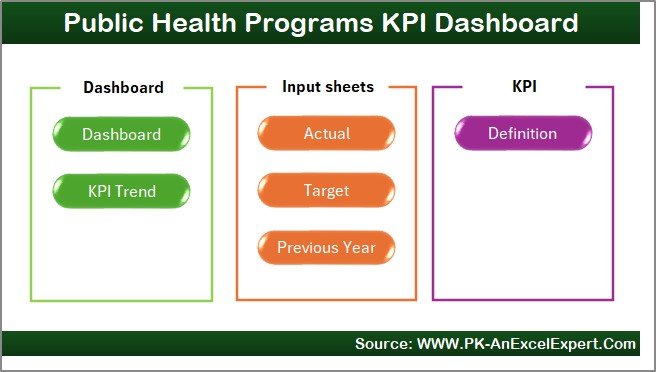
The Home Sheet serves as an index for the dashboard. It includes six buttons that allow users to jump to specific sheets. This design saves time and makes navigation easy, especially for large programs with multiple KPIs.
Click to Purchases Public Health Programs KPI Dashboard in Excel
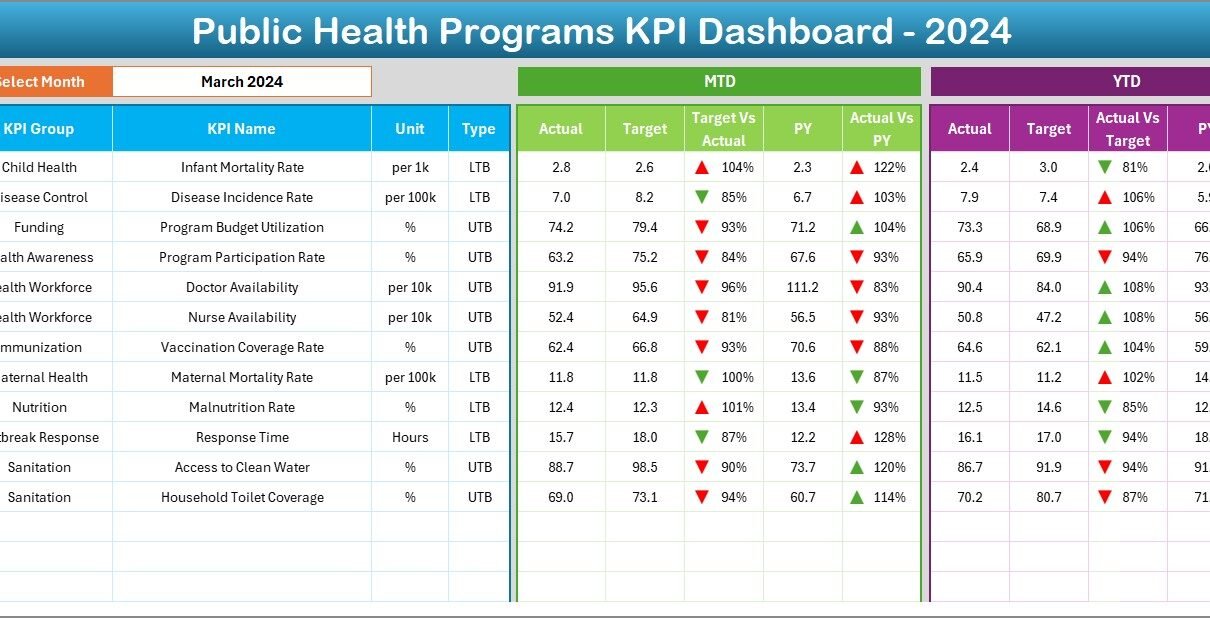
2. Dashboard Sheet – Main Performance View
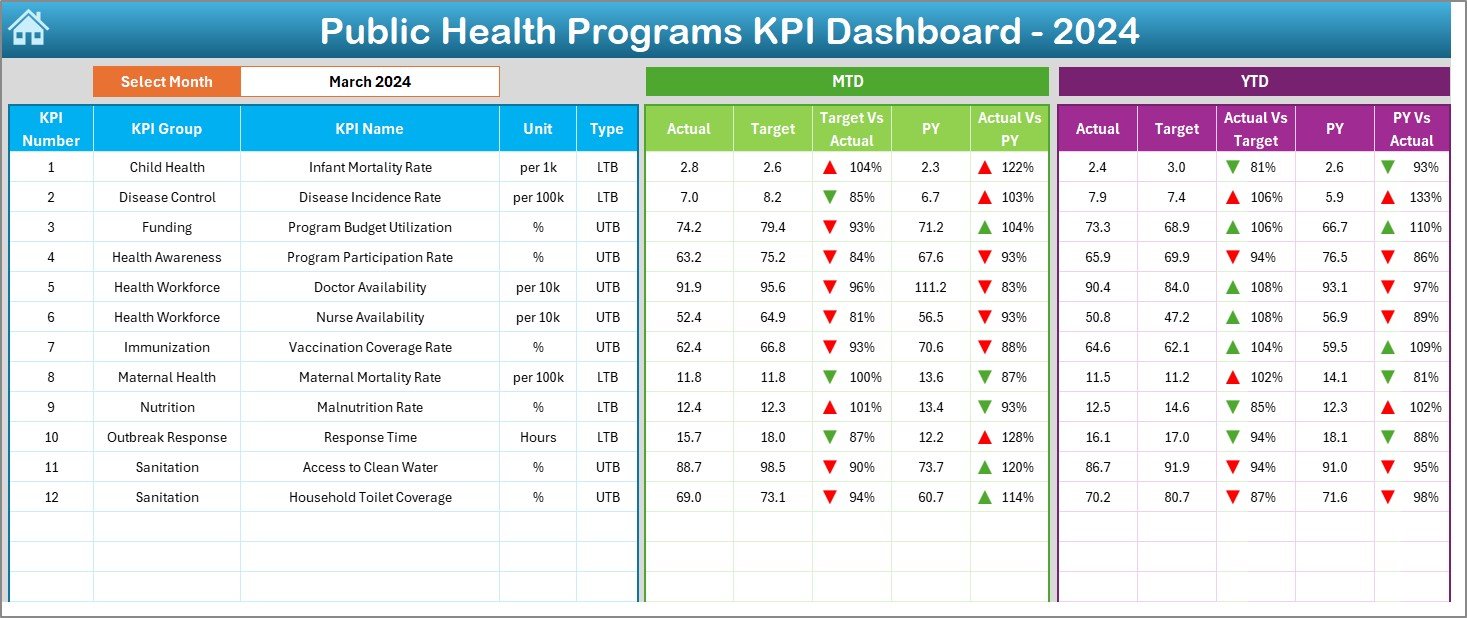
The Dashboard Sheet is the core of the tool. It provides a complete view of KPIs, both for MTD and YTD.
Key Features
-
Month Selection (D3) – Choose the month from a drop-down menu. All numbers update automatically.
-
MTD Metrics – Display Actual, Target, and Previous Year values. Conditional formatting shows up/down arrows to indicate performance against targets.
-
YTD Metrics – Year-To-Date Actual, Target, and Previous Year numbers, along with visual indicators for performance comparisons.
This sheet provides a quick snapshot of program health and allows managers to identify trends and areas needing attention.
3. KPI Trend Sheet – Visualize Performance Over Time
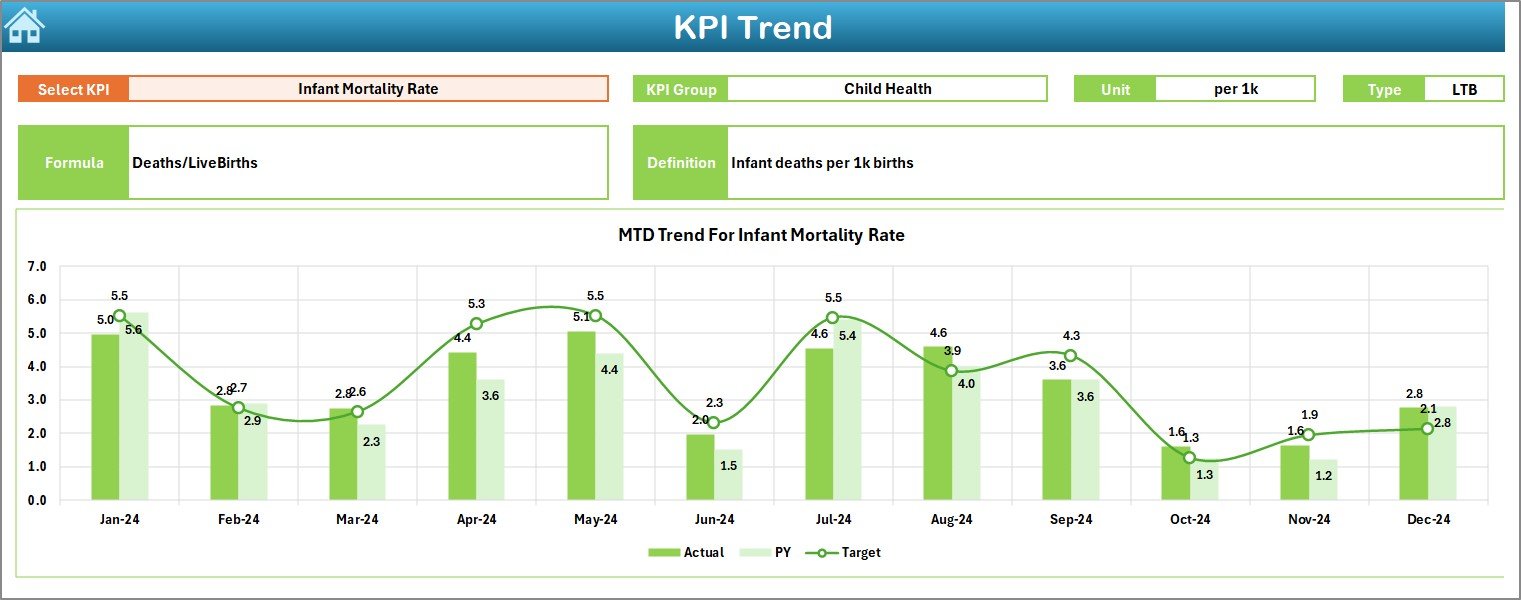
The KPI Trend Sheet enables detailed analysis of individual KPIs.
Key Features
-
KPI Selection (C3) – Choose the KPI to analyze.
-
KPI Details – Display KPI Group, Unit, Type (Lower the Better or Upper the Better), Formula, and Definition.
-
Trend Charts – Visualize MTD and YTD performance for Actual, Target, and Previous Year values.
Trend analysis helps in identifying improvements, seasonal patterns, or recurring issues in public health programs.
Click to Purchases Public Health Programs KPI Dashboard in Excel
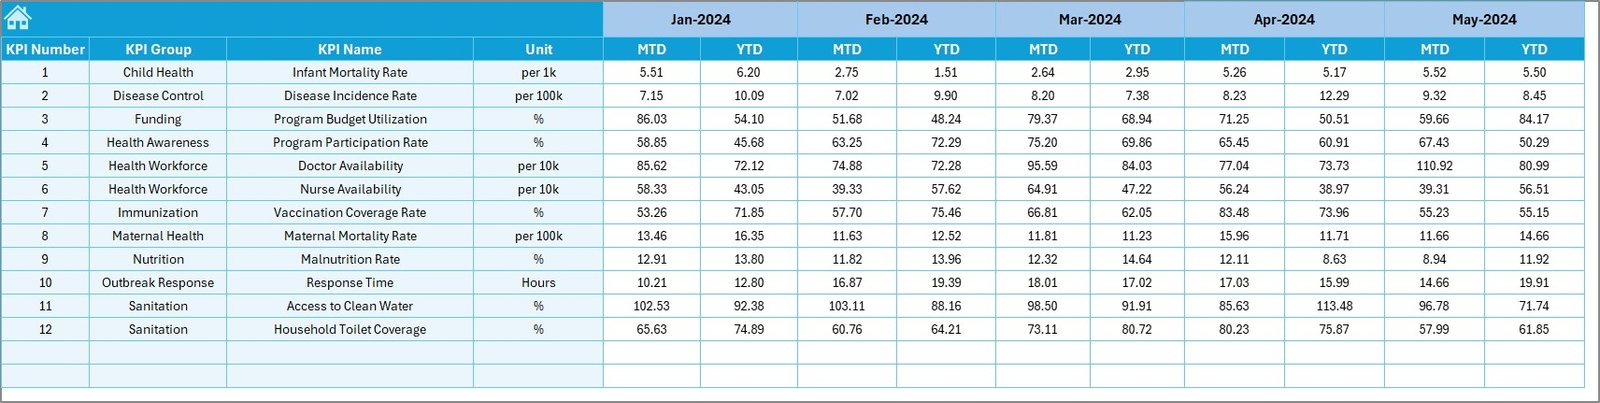
4. Actual Numbers Input Sheet – Enter Real-Time Data
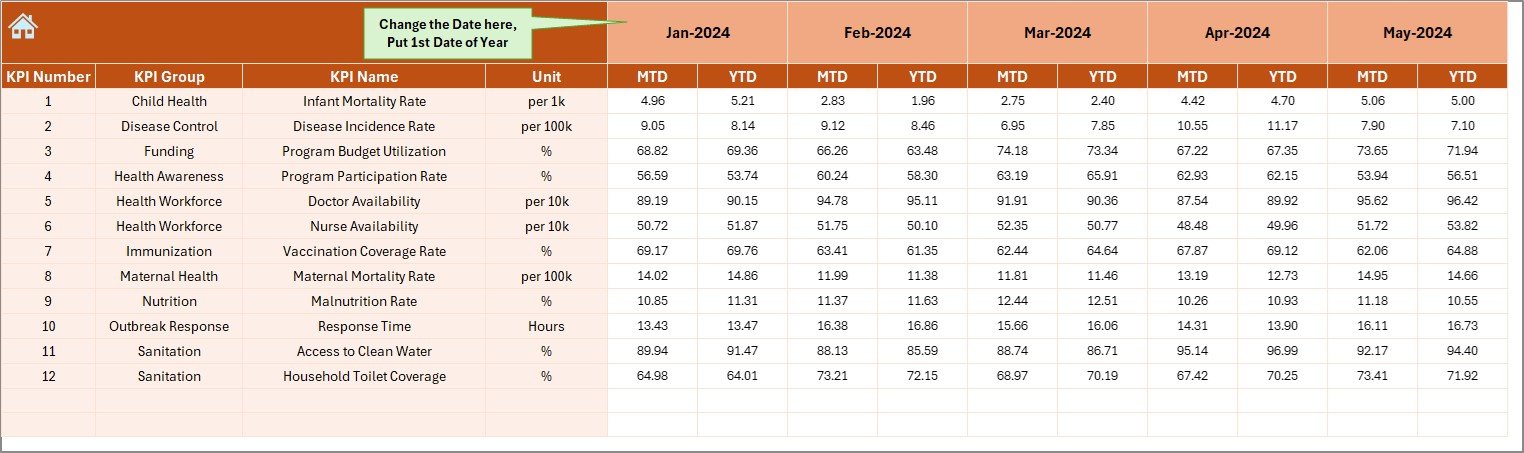
This sheet allows users to input actual performance numbers for each KPI.
-
YTD and MTD Input – Enter monthly and cumulative numbers.
-
Month Selection (E1) – Update the month to ensure accurate tracking.
Accurate data entry is crucial for generating reliable dashboard visuals and performance insights.
5. Target Sheet – Set Goals for KPIs
The Target Sheet allows you to input target numbers for each KPI.
-
Targets are entered for both MTD and YTD values.
-
Helps track performance against planned objectives.
By comparing actual performance with targets, program managers can assess program effectiveness.
6. Previous Year Numbers Sheet – Historical Comparison
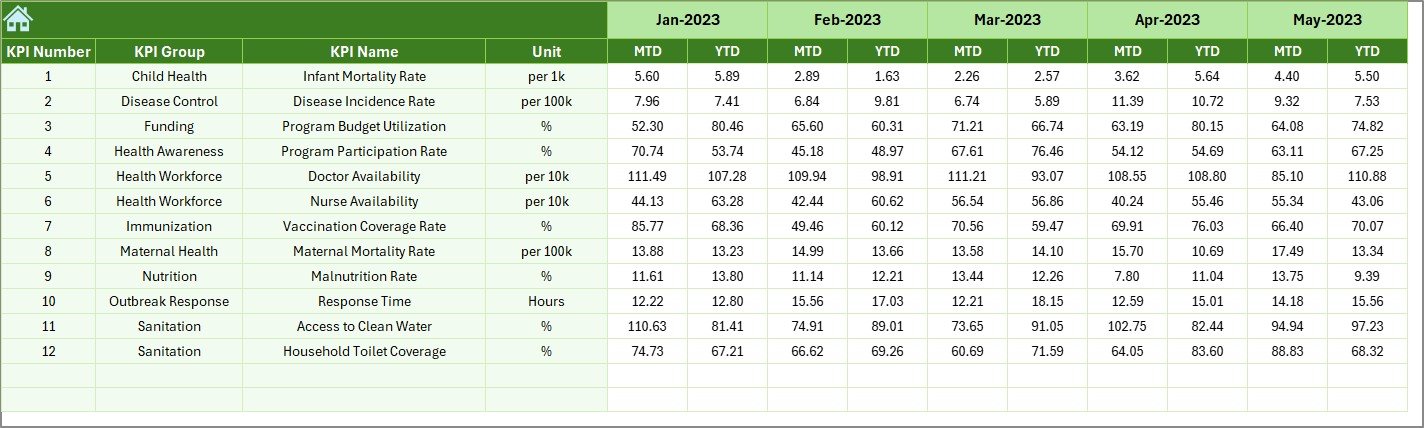
The Previous Year Number Sheet stores KPI data from the previous year.
-
Allows direct comparison of current performance against the same period in the previous year.
-
Supports year-over-year trend analysis.
This helps program managers understand performance improvements and identify areas of stagnation.
Click to Purchases Public Health Programs KPI Dashboard in Excel
7. KPI Definition Sheet – Clear Understanding of Metrics
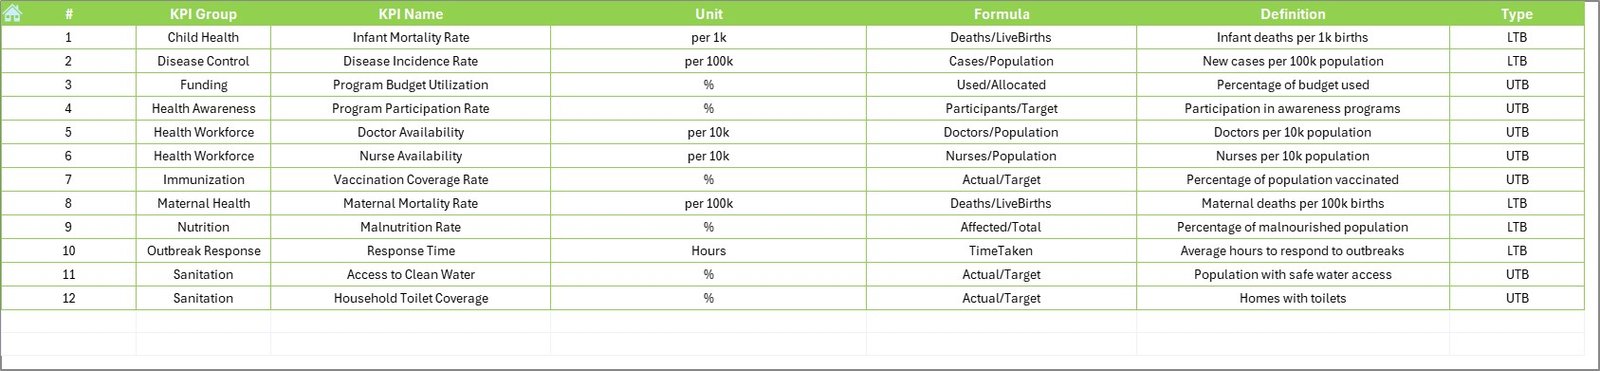
The KPI Definition Sheet provides detailed explanations for each metric.
-
Enter KPI Name, KPI Group, Unit, Formula, and Definition.
-
Ensures all stakeholders understand the meaning and calculation of each KPI.
-
Reduces misinterpretation and enhances consistency in reporting.
Advantages of Public Health Programs KPI Dashboard in Excel
Using this dashboard provides several benefits for public health programs:
1. Real-Time Performance Tracking
Monitor MTD and YTD performance as data is updated, ensuring timely interventions.
2. Data-Driven Decision Making
Compare actual values against targets and previous year data to make informed operational decisions.
3. Simplified Reporting
Replace complex spreadsheets with a single dashboard for management, donors, and policymakers.
4. Easy Visualization of Trends
Charts and conditional formatting highlight trends, improvements, and areas needing attention.
5. Better Resource Allocation
Identify underperforming areas and allocate resources efficiently.
6. Historical Comparison
Track progress over years to assess program growth and effectiveness.
7. Enhanced Accountability
Standardized KPI definitions ensure every team member understands their role in achieving program targets.
Click to Purchases Public Health Programs KPI Dashboard in Excel
Best Practices for Using the Public Health Programs KPI Dashboard
To maximize benefits, follow these best practices:
1. Maintain Accurate Data Entry
Ensure timely and correct input of actual, target, and previous year numbers.
2. Update KPI Definitions Regularly
Keep definitions, formulas, and units up-to-date to avoid confusion.
3. Monitor KPIs Monthly
Regular monitoring allows early detection of issues and corrective actions.
4. Use Trend Analysis Effectively
Analyze both MTD and YTD trends to identify seasonal patterns and performance gaps.
5. Customize KPI Groups
Group KPIs logically (e.g., maternal health, immunization, disease control) for clarity.
6. Train Staff
Educate team members on reading dashboards and interpreting trends for informed decision-making.
How Public Health Teams Can Use This Dashboard
Practical applications include:
-
Tracking vaccination coverage and immunization rates
-
Monitoring maternal and child health program outcomes
-
Assessing disease control initiatives
-
Comparing current program performance with targets and previous years
-
Planning interventions based on trends
-
Reporting to donors, government, and management teams
-
Allocating resources to underperforming areas
-
Evaluating program effectiveness over months and years
Conclusion
The Public Health Programs KPI Dashboard in Excel is a comprehensive tool for monitoring, analyzing, and improving public health initiatives. By tracking MTD and YTD performance, comparing data with previous years, and visualizing trends, program managers can make informed decisions, optimize resources, and improve health outcomes.
Proper data entry, trend analysis, and adherence to best practices make this dashboard an invaluable asset for public health programs aiming for efficiency, accountability, and measurable impact.
Click to Purchases Public Health Programs KPI Dashboard in Excel
Frequently Asked Questions (FAQs)
1. What is the Public Health Programs KPI Dashboard in Excel?
It is a ready-to-use Excel dashboard that tracks and visualizes key performance indicators for public health programs.
2. Do I need advanced Excel skills to use it?
No. Basic Excel skills are sufficient. Most calculations and charts are prebuilt; you only need to enter data.
3. How often should I update the data?
Monthly updates are recommended for accurate MTD and YTD tracking. Weekly updates can be used for ongoing monitoring.
4. Can I add new KPIs to the dashboard?
Yes. New KPIs can be added in the KPI Definition sheet and linked to the dashboard.
5. Who can use this dashboard?
Program managers, health administrators, monitoring and evaluation teams, donors, and policymakers can use it.
6. Does the dashboard show historical trends?
Yes. By comparing current data with previous year numbers, the dashboard provides trend analysis for MTD and YTD metrics.
7. Is the dashboard customizable?
Yes. You can customize KPI groups, visuals, formulas, and layout to meet specific program requirements.
Click to Purchases Public Health Programs KPI Dashboard in Excel
Visit our YouTube channel to learn step-by-step video tutorials