Managing investor services without a centralized performance view often leads to delayed decisions, missed opportunities, and dissatisfied investors. However, when organizations adopt an Investor Services Dashboard in Power BI, they gain clarity, speed, and confidence in every service and transaction they manage.
Therefore, this in-depth guide explains what an Investor Services Dashboard in Power BI is, why it matters, how it works, its page-wise structure, advantages, best practices, and frequently asked questions. Moreover, the article uses clear language, practical examples, and actionable insights so investment firms, asset managers, and financial service providers can apply it easily.
Click to Purchases Investor Services Dashboard in power BI
What Is an Investor Services Dashboard in Power BI?
An Investor Services Dashboard in Power BI is an interactive analytics solution that tracks, analyzes, and visualizes key investor-related metrics in one centralized platform.
Instead of reviewing multiple Excel sheets or static reports, this dashboard converts raw operational and financial data into meaningful insights. As a result, teams can monitor service progress, investor satisfaction, transaction values, and portfolio performance in real time.
Moreover, Power BI allows users to filter, drill down, and compare metrics across investor types, service categories, regions, and time periods. Consequently, decision-makers gain complete visibility into investor services performance.
Why Do Organizations Need an Investor Services Dashboard?
Investor services involve complex processes such as transaction handling, portfolio servicing, compliance reporting, and customer communication. However, when teams rely on manual tracking, errors and delays increase.
Therefore, an Investor Services Dashboard becomes essential because it:
-
Centralizes all investor service data
-
Improves transparency across teams
-
Enhances investor satisfaction tracking
-
Supports faster, data-driven decisions
-
Reduces reporting effort and errors
Furthermore, leadership teams can easily identify bottlenecks, service gaps, and growth opportunities through a single dashboard.
How Does an Investor Services Dashboard in Power BI Work?
An Investor Services Dashboard in Power BI works through a structured and logical flow:
-
Data Collection
Data flows from Excel files, databases, or financial systems into Power BI. -
Data Modeling
Relationships, measures, and calculations transform raw data into KPIs. -
Visualization
Cards, charts, tables, and slicers present insights clearly. -
Interactivity
Users filter by month, investor type, service type, region, or transaction category. -
Decision Support
Managers use insights to improve service efficiency and investor experience.
As a result, the dashboard becomes a daily decision-making tool rather than a static report.
Page-Wise Structure of the Investor Services Dashboard in Power BI
This Investor Services Dashboard in Power BI includes five structured pages, each designed to answer specific business questions.
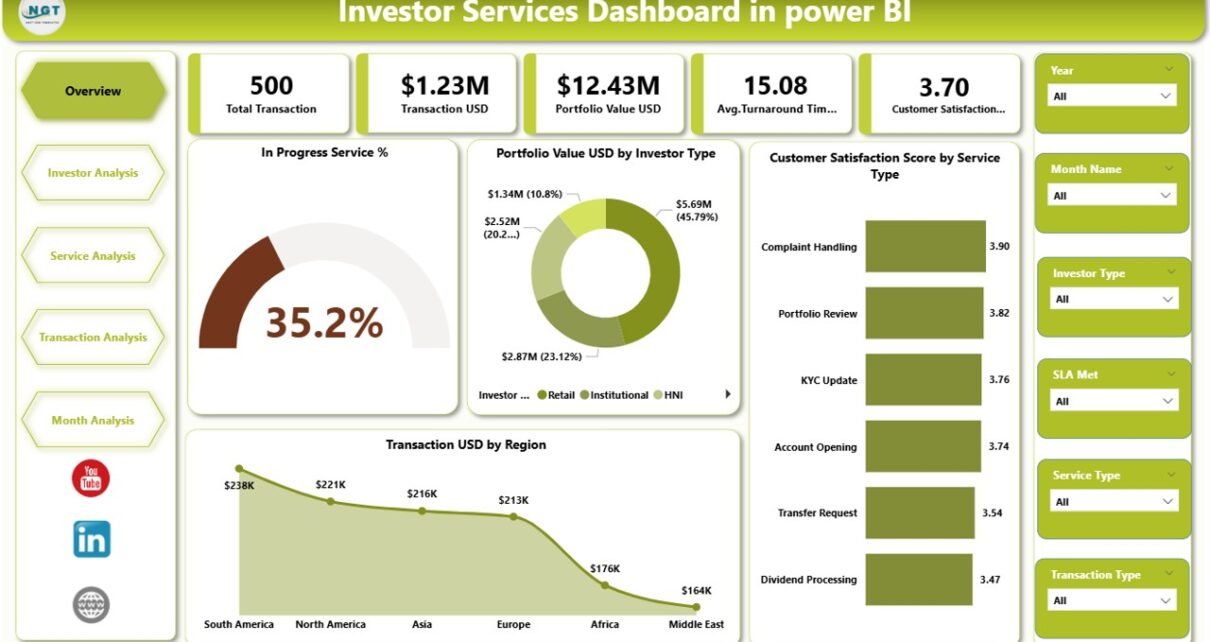
1. Overview Page: How Is Overall Investor Services Performance?
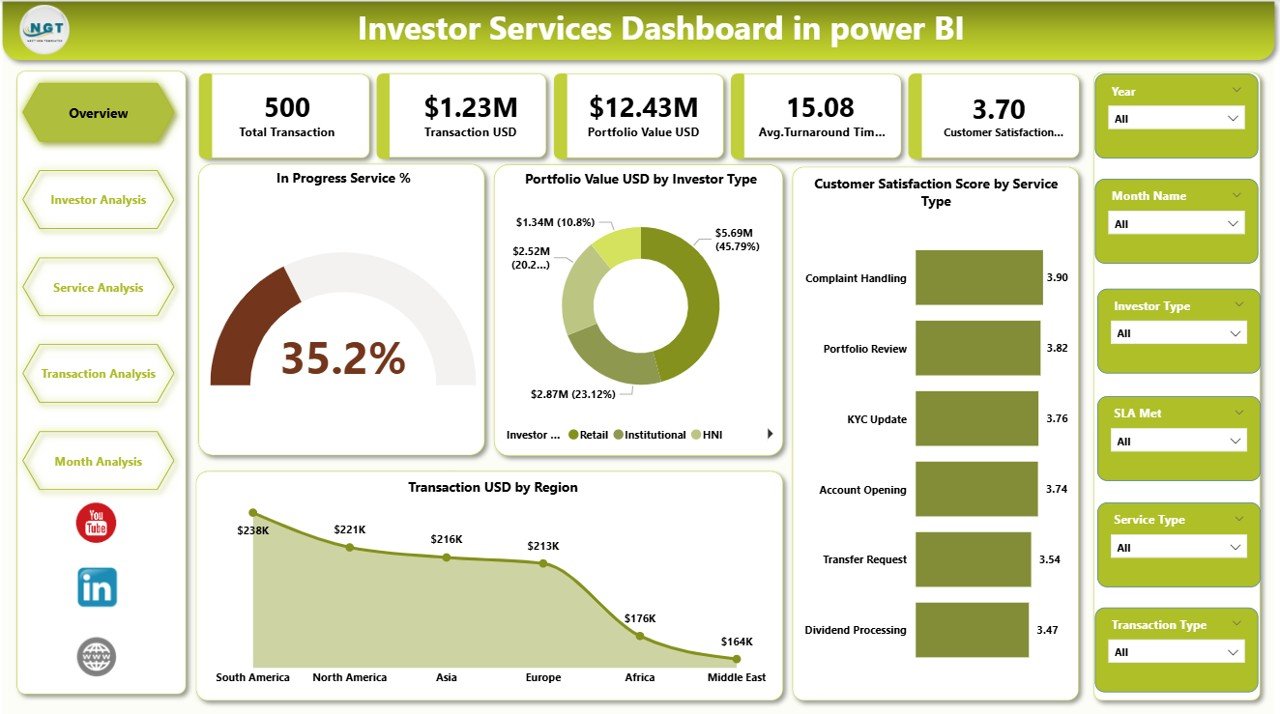
The Overview Page acts as the command center of the dashboard. Therefore, it provides a high-level snapshot of investor services performance.
Key Features of the Overview Page
Slicers
-
Month
-
Investor Type
-
Service Type
-
Region
KPI Cards
-
In Progress Service %
-
Profit Value (USD)
-
Customer Satisfaction Score
-
Total Transaction Value (USD)
Charts
-
In Progress Service % by Service Type
-
Profit Value USD by Investor Type
-
Customer Satisfaction Score by Service Type
-
Transaction USD by Region
Why This Page Matters
Click to Purchases Investor Services Dashboard in power BI
This page helps leadership instantly understand:
-
Current service workload
-
Profit contribution by investor type
-
Investor satisfaction trends
-
Regional transaction performance
As a result, executives can act quickly without diving into details.
2. Investor Analysis Page: How Are Different Investor Types Performing?
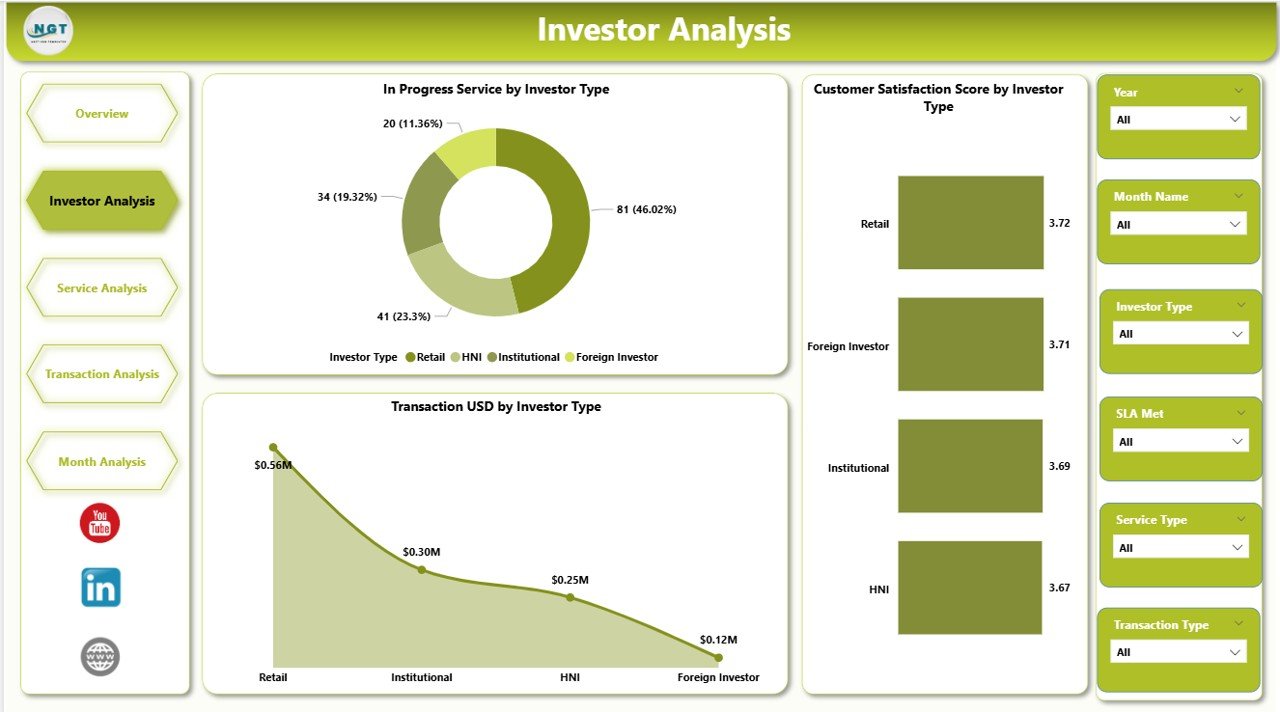
The Investor Analysis Page focuses on performance across various investor categories such as retail, institutional, or high-net-worth investors.
Key Charts on Investor Analysis Page
-
In Progress Service by Investor Type
-
Customer Satisfaction Score by Investor Type
-
Transaction USD by Investor Type
Business Value
This page answers critical questions:
-
Which investor type generates the highest transaction value?
-
Which investor segment reports lower satisfaction?
-
Where do service delays occur by investor category?
Consequently, teams can tailor service strategies for each investor segment.
3. Service Analysis Page: Which Services Need Improvement?
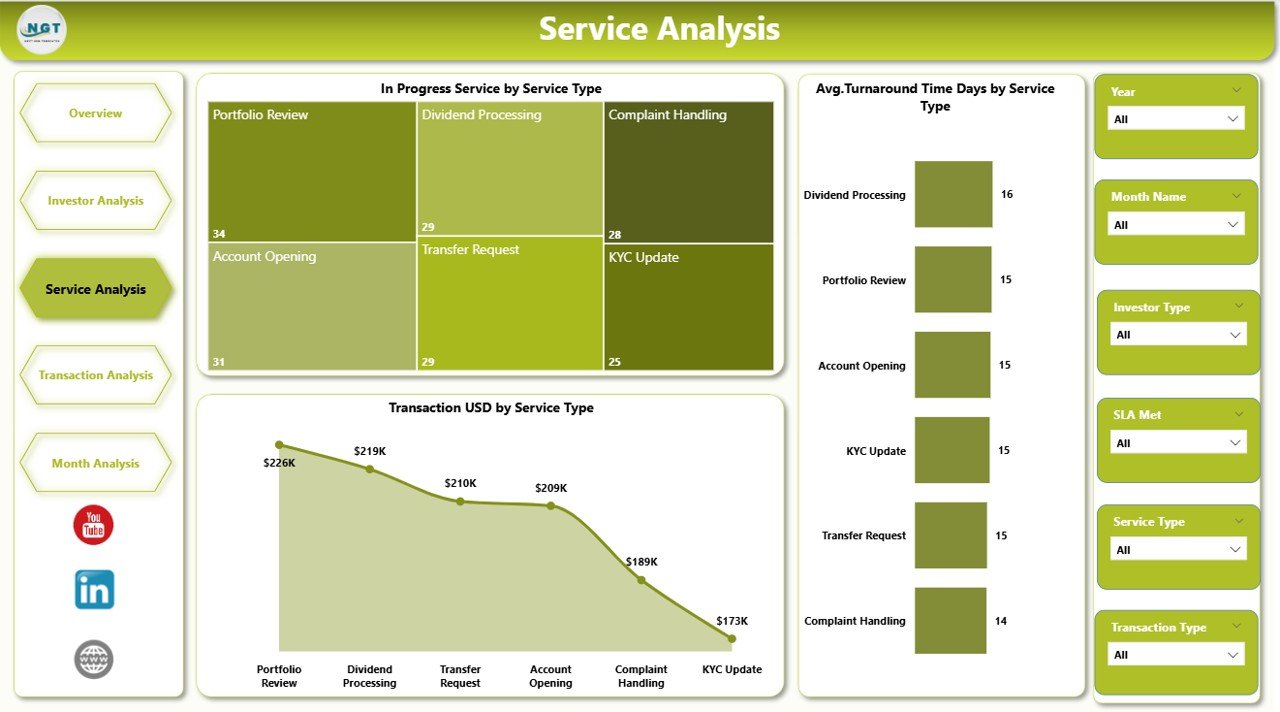
The Service Analysis Page evaluates performance by service type, such as onboarding, transaction processing, reporting, or support.
Key Charts on Service Analysis Page
-
In Progress Service by Service Type
-
Average Turnaround Time (Days) by Service Type
-
Transaction USD by Service Type
Why Service Analysis Is Critical
Click to Purchases Investor Services Dashboard in power BI
Through this page, managers can:
-
Identify slow or overloaded services
-
Reduce turnaround time
-
Improve service quality and efficiency
Therefore, service teams can prioritize improvement initiatives effectively.
4. Transaction Analysis Page: How Are Transactions Performing?
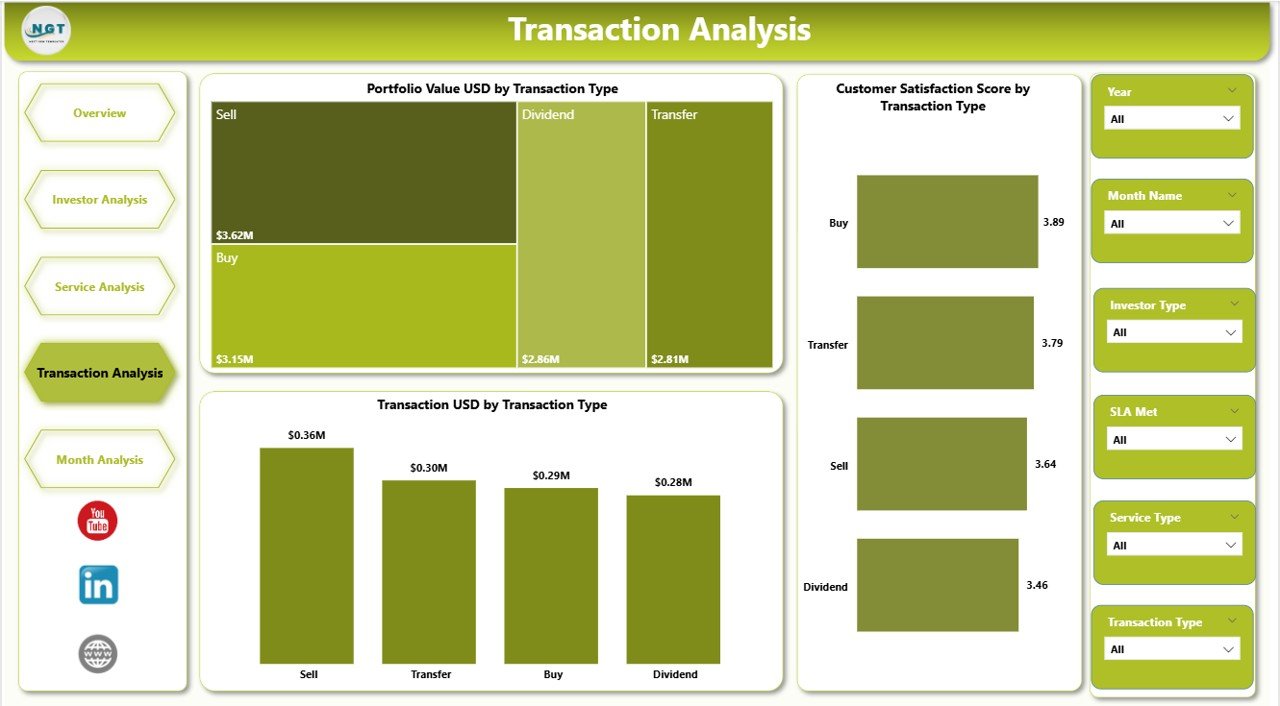
The Transaction Analysis Page focuses on transaction behavior and portfolio movement.
Key Charts on Transaction Analysis Page
-
Portfolio Value USD by Transaction Type
-
Customer Satisfaction Score by Transaction Type
-
Transaction USD by Transaction Type
Insights Delivered
This page helps organizations:
-
Track high-value transaction types
-
Identify transaction-specific satisfaction gaps
-
Monitor portfolio value movement
As a result, financial controllers and investment managers gain better transaction visibility.
5. Monthly Trends Page: How Are Performance Trends Changing Over Time?
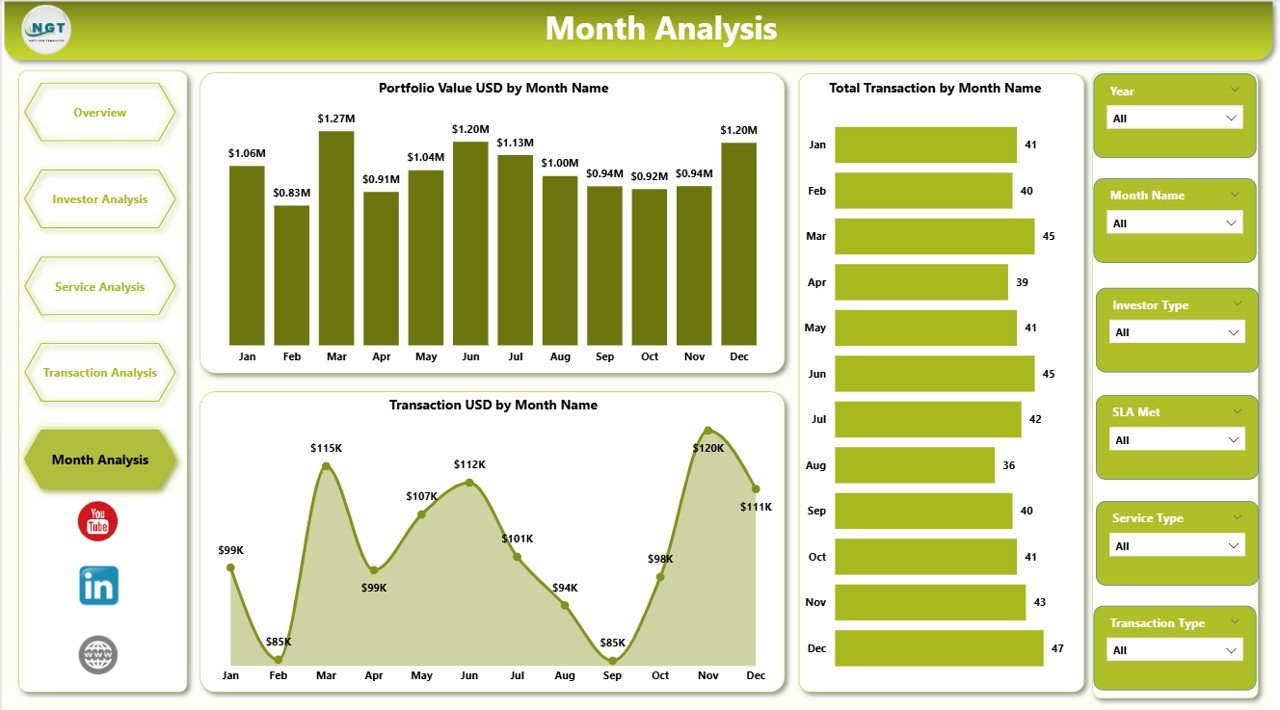
The Monthly Trends Page tracks performance evolution over time.
Key Charts on Monthly Trends Page
-
Portfolio Value USD by Month
-
Total Transactions by Month
-
Transaction USD by Month
Why Trends Matter
Trends help organizations:
-
Identify seasonal patterns
-
Forecast future transaction volumes
-
Measure growth or decline over time
Therefore, leadership can plan capacity and resources more effectively.
Key KPIs Tracked in an Investor Services Dashboard
An effective dashboard tracks the right KPIs. Common KPIs include:
-
In Progress Service %
-
Profit Value (USD)
-
Customer Satisfaction Score
-
Transaction Value (USD)
-
Portfolio Value (USD)
-
Average Turnaround Time (Days)
Each KPI directly supports operational and strategic decisions.
Click to Purchases Investor Services Dashboard in power BI
Advantages of Investor Services Dashboard in Power BI
1. Centralized Performance Visibility
All investor service metrics appear in one dashboard, which eliminates scattered reports.
2. Faster Decision-Making
Interactive visuals help managers act quickly on real-time insights.
3. Improved Investor Satisfaction
By tracking satisfaction scores, teams can proactively address service issues.
4. Enhanced Operational Efficiency
Service bottlenecks become visible instantly.
5. Scalability and Flexibility
Power BI dashboards scale easily as data volume grows.
Opportunities for Improvement in Investor Services Dashboards
Although dashboards deliver value, organizations can further enhance them by:
-
Adding predictive analytics for service demand
-
Integrating automated alerts for SLA breaches
-
Including drill-through pages for detailed analysis
-
Connecting real-time data sources
-
Enhancing role-based access control
These improvements increase dashboard maturity and usability.
Best Practices for the Investor Services Dashboard in Power BI
1. Define Clear KPIs First
Always align KPIs with business objectives.
2. Keep Visuals Simple
Use clear charts and avoid clutter.
3. Use Consistent Metrics
Maintain consistent definitions across all pages.
4. Enable Drill-Downs
Allow users to explore deeper insights easily.
5. Update Data Regularly
Schedule refreshes to keep insights current.
6. Train End Users
Ensure users understand how to interpret dashboard insights.
Following these best practices ensures long-term dashboard success.
Who Should Use an Investor Services Dashboard?
This dashboard benefits:
-
Investment firms
-
Asset management companies
-
Wealth management providers
-
Portfolio managers
-
Investor relations teams
-
Financial controllers
Any organization managing investor services can gain value from it.
How Does Power BI Improve Investor Reporting Compared to Excel?
Power BI offers:
-
Interactive filtering
-
Automated refresh
-
Advanced visuals
-
Better scalability
Therefore, Power BI dashboards outperform static Excel reports for investor services analytics.
Conclusion: Why Investor Services Dashboards Drive Better Decisions
An Investor Services Dashboard in Power BI transforms how organizations manage investor relationships, services, and transactions. By centralizing data, visualizing KPIs, and enabling interactivity, the dashboard empowers teams to act faster and smarter.
Moreover, when organizations follow best practices and continuously enhance their dashboards, they create a sustainable analytics foundation that improves investor satisfaction and financial performance.
Frequently Asked Questions (FAQs)
What is the main purpose of an Investor Services Dashboard in Power BI?
The main purpose is to track, analyze, and improve investor service performance using real-time, interactive analytics.
Can small investment firms use this dashboard?
Yes, both small and large firms can use it because Power BI scales easily.
How often should the dashboard refresh data?
Most organizations refresh data daily or weekly, depending on transaction volume.
Does this dashboard require advanced Power BI skills?
No, end users only need basic navigation skills to use it.
Can this dashboard integrate with Excel?
Yes, Power BI connects seamlessly with Excel data sources.
Which KPIs matter most in investor services?
Customer satisfaction, transaction value, turnaround time, and portfolio value matter the most.
Visit our YouTube channel to learn step-by-step video tutorials