Managing treasury operations has become more complex than ever. Cash inflows and outflows change daily. Interest income and expenses fluctuate across entities, regions, and counterparties. Moreover, liquidity risk continues to increase due to market uncertainty. Therefore, finance teams need a structured, reliable, and visual system to manage treasury performance effectively.
That is exactly where a Treasury Operations Dashboard in Excel becomes a powerful and practical solution.
In this detailed article, you will learn what a Treasury Operations Dashboard in Excel is, why it is important, how it works, its page-wise structure, key features, advantages, best practices, and frequently asked questions. Additionally, this guide explains everything in simple language so that finance professionals can easily understand and apply it.
Click to Purchases Treasury Operations Dashboard in Excel
What Is a Treasury Operations Dashboard in Excel?
A Treasury Operations Dashboard in Excel is a centralized and interactive reporting tool designed to track, analyze, and visualize treasury-related financial metrics using Microsoft Excel.
Instead of managing multiple spreadsheets for cash flow, interest income, liquidity, and counterparty exposure, this dashboard consolidates all critical treasury data into a single visual interface. As a result, treasury managers and finance leaders can monitor performance faster and make informed decisions confidently.
Moreover, because the dashboard works entirely in Excel, organizations do not need expensive software or complex integrations.
Why Do Organizations Need a Treasury Operations Dashboard?
Treasury functions play a critical role in maintaining financial stability. However, manual treasury reporting creates several challenges.
Common Treasury Management Challenges
-
Cash visibility remains unclear across regions and entities
-
Liquidity risk increases due to delayed insights
-
Interest income and expense tracking becomes inconsistent
-
Counterparty exposure stays hidden in raw data
-
Decision-making slows due to scattered reports
Therefore, organizations need a solution that provides real-time visibility, accuracy, and control.
A Treasury Operations Dashboard in Excel solves these problems by transforming raw data into actionable insights.
How Does a Treasury Operations Dashboard in Excel Work?
The dashboard works through a structured and logical flow.
First, treasury data gets stored in a Data Sheet.
Next, calculations and aggregations process the data automatically.
Then, interactive charts, slicers, and KPI cards display insights visually.
As a result, users can analyze treasury performance across entities, regions, counterparties, and months without manual effort.
Key Features of the Treasury Operations Dashboard in Excel
This ready-to-use dashboard includes multiple powerful features designed for treasury professionals.
🔹 Page Navigator for Easy Access
A Page Navigator located on the left side allows smooth navigation between analytical pages. Consequently, users can switch views instantly without searching through worksheets.
🔹 Right-Side Slicers for Dynamic Filtering
Each analytical page includes right-side slicers, enabling users to filter data by entity, region, counterparty, or time period. Therefore, analysis becomes fast and flexible.
🔹 Executive KPI Cards
The dashboard includes KPI cards that present critical metrics at a glance. As a result, decision-makers quickly understand treasury health.
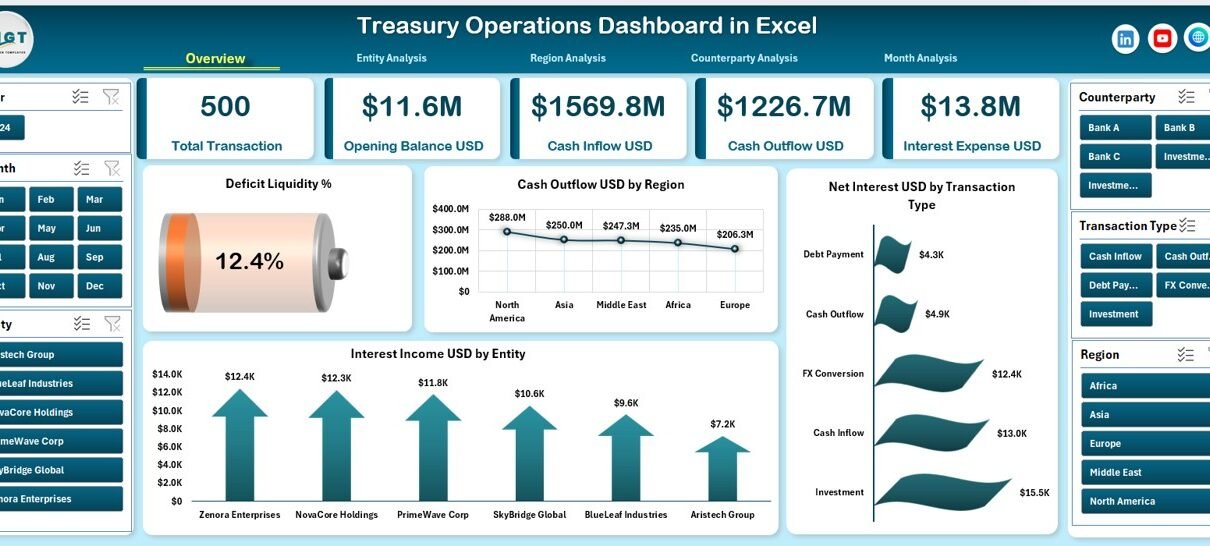
Overview Page: What Insights Does It Provide?
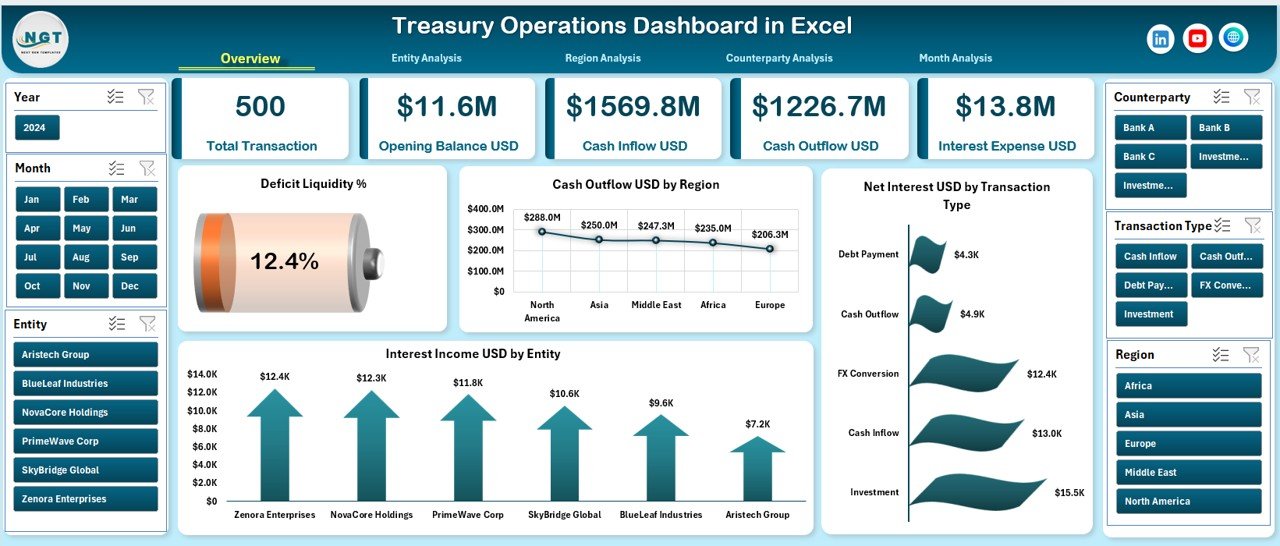
The Overview Page serves as the executive summary of the Treasury Operations Dashboard.
Key Elements of the Overview Page
-
Right-side slicer for dynamic analysis
-
Four KPI cards for quick performance tracking
-
Four high-impact charts
Charts on the Overview Page
-
Deficit Liquidity %
-
Cash Outflow USD by Region
-
Net Interest USD by Transaction
-
Interest Income USD by Entity
Because this page presents high-level insights, finance leaders can immediately identify risks and opportunities.
Click to Purchases Treasury Operations Dashboard in Excel
Entity Analysis Page: How Does It Help Entity-Level Control?
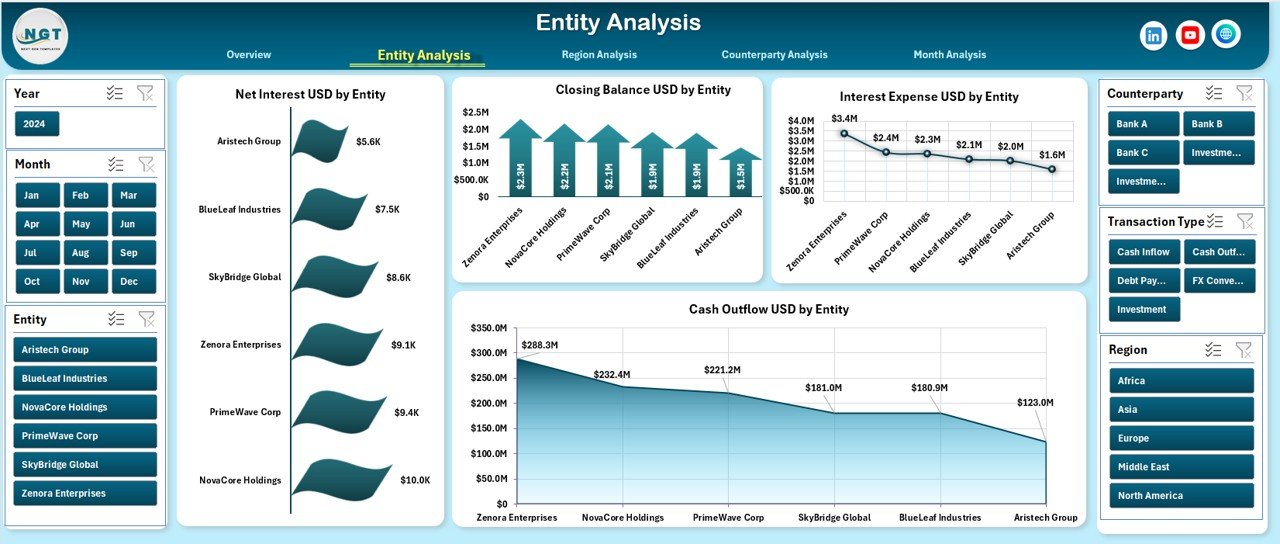
The Entity Analysis Page focuses on treasury performance across different business entities.
Charts on the Entity Analysis Page
-
Net Interest USD by Entity
-
Closing Balance USD by Entity
-
Interest Expenses USD by Entity
-
Cash Outflow USD by Entity
With these insights, treasury teams can compare entity-level performance and identify underperforming units.
Region Analysis Page: Why Is Regional Treasury Tracking Important?
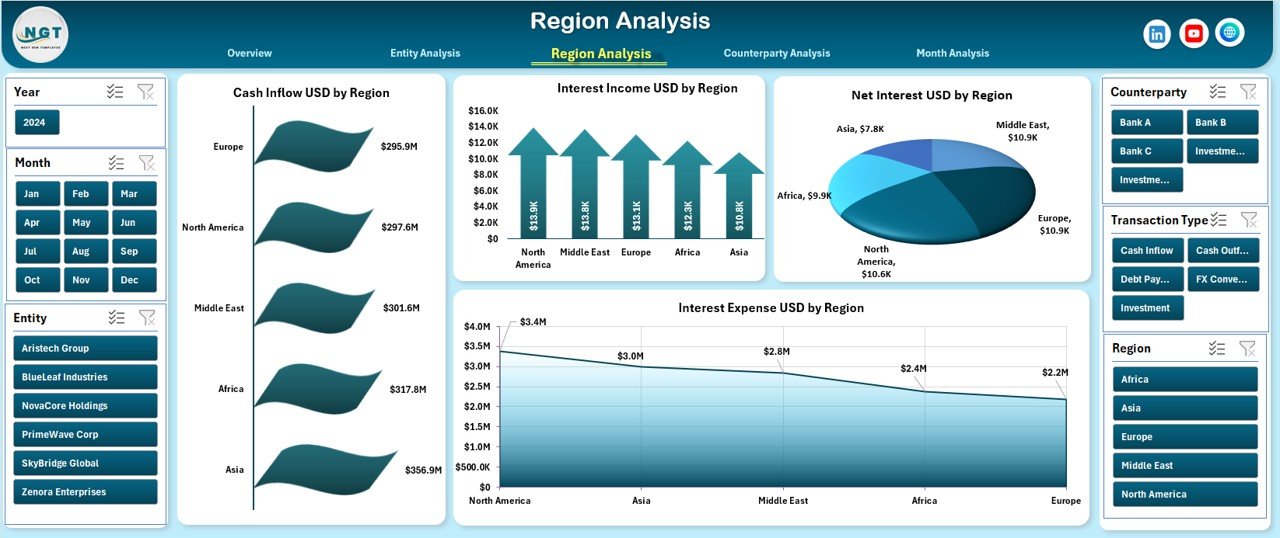
Regional treasury performance often varies due to market conditions, currency exposure, and regulatory environments. Therefore, regional analysis remains essential.
Charts on the Region Analysis Page
-
Cash Inflow USD by Region
-
Interest Income USD by Region
-
Net Interest USD by Region
-
Interest Expenses USD by Region
This page helps organizations optimize treasury strategies across regions.
Counterparty Analysis Page: How Does It Reduce Risk?
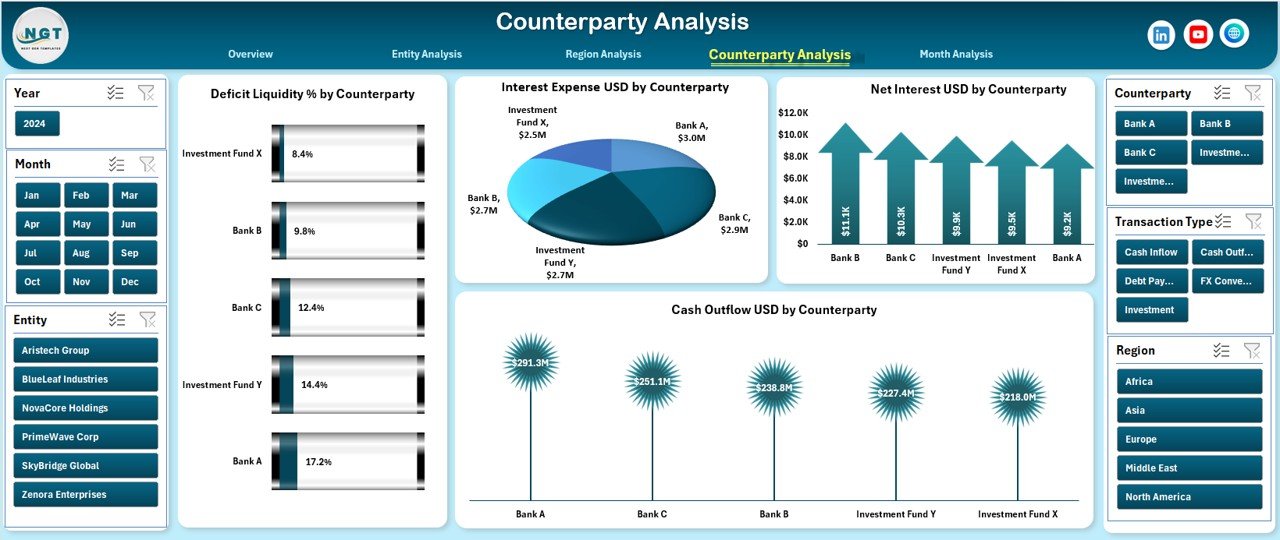
Counterparty exposure can significantly impact liquidity and profitability. Therefore, monitoring counterparties remains critical.
Charts on the Counterparty Analysis Page
-
Deficit Liquidity % by Counterparty
-
Interest Expense USD by Counterparty
-
Net Interest USD by Counterparty
-
Cash Outflow USD by Counterparty
As a result, treasury teams can identify risky counterparties early and take corrective action.
Month Analysis Page: How Does It Support Trend Analysis?
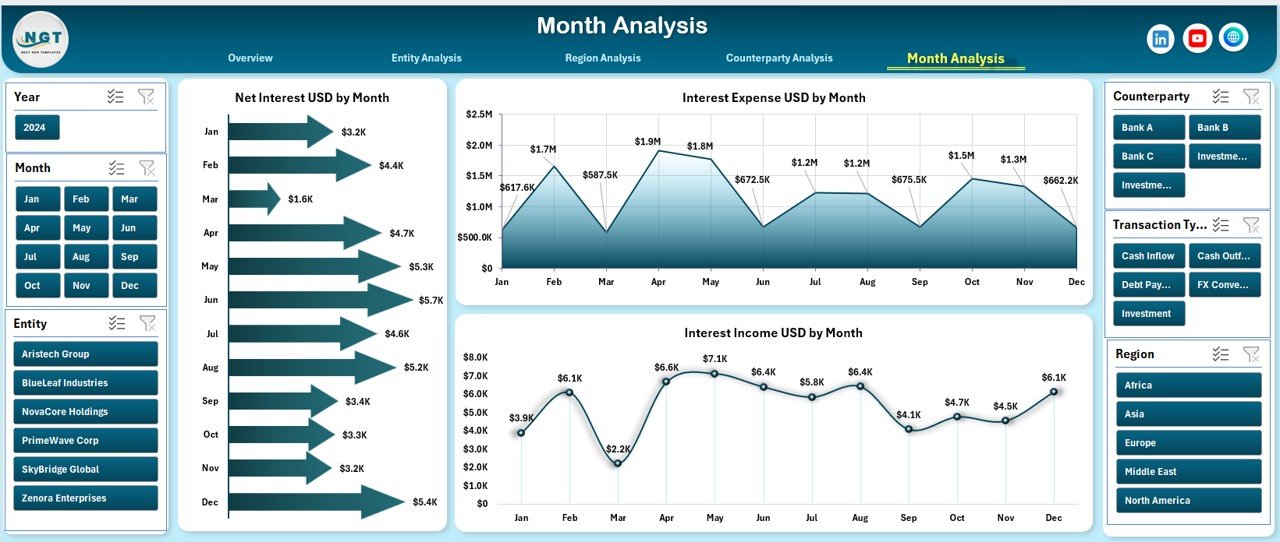
Treasury performance changes over time. Therefore, monthly trend analysis provides valuable insights.
Charts on the Month Analysis Page
-
Net Interest USD by Month
-
Interest Expense USD by Month
-
Interest Income USD by Month
With this view, organizations can track seasonality, growth, and volatility trends effectively.
Data Sheet and Support Sheet: Why Are They Important?
Data Sheet
The Data Sheet stores raw treasury data such as transactions, interest amounts, regions, entities, and counterparties. All dashboard calculations depend on this structured data.
Support Sheet
The Support Sheet contains lookup tables, mappings, and helper calculations. As a result, the dashboard remains accurate, scalable, and easy to maintain.
Advantages of Treasury Operations Dashboard in Excel
Click to Purchases Treasury Operations Dashboard in Excel
Using a Treasury Operations Dashboard in Excel offers several strategic advantages.
✅ Advantages
-
📊 Centralized treasury visibility in one Excel file
-
⚡ Faster decision-making through real-time insights
-
💰 Improved liquidity and cash flow control
-
🔍 Better counterparty risk management
-
📈 Accurate tracking of interest income and expenses
-
🔄 Flexible filtering with slicers
-
🧩 No need for complex software or IT support
Because Excel remains widely used, adoption becomes quick and cost-effective.
Opportunities for Improvement in Treasury Dashboards
Although Excel dashboards are powerful, organizations can further enhance their treasury reporting.
🔹 Improvement Opportunities
-
Automate data imports using Power Query
-
Add scenario analysis for stress testing
-
Include currency exposure tracking
-
Integrate rolling cash flow forecasts
-
Add alert indicators for liquidity thresholds
These improvements make treasury dashboards even more robust.
Best Practices for the Treasury Operations Dashboard in Excel
Following best practices ensures long-term success and accuracy.
⭐ Best Practices
-
Keep the Data Sheet clean and structured
-
Use consistent date and currency formats
-
Refresh data regularly to avoid outdated insights
-
Limit manual formula edits to prevent errors
-
Use clear naming conventions for entities and regions
-
Protect critical calculation cells
-
Validate data before analysis
By following these practices, treasury teams maintain trust in their dashboard.
Who Can Benefit from a Treasury Operations Dashboard in Excel?
This dashboard supports multiple stakeholders across finance.
👥 Beneficiaries
-
Treasury Managers
-
Finance Controllers
-
CFOs and Finance Directors
-
Risk Management Teams
-
Corporate Finance Analysts
-
Internal Auditors
Each group gains clear, actionable treasury insights.
How to Implement a Treasury Operations Dashboard Successfully?
Implementation does not need to be complex.
Step-by-Step Approach
-
Define treasury KPIs and objectives
-
Prepare clean and accurate data
-
Load data into the Data Sheet
-
Review dashboard visuals and slicers
-
Train users on navigation and filters
-
Monitor and improve regularly
This approach ensures smooth adoption.
Treasury Operations Dashboard vs Traditional Treasury Reporting
Traditional reporting relies on static spreadsheets and manual summaries. In contrast, dashboards offer dynamic insights.
Key Differences
-
Static reports vs interactive dashboards
-
Manual effort vs automated analysis
-
Delayed insights vs real-time visibility
-
High error risk vs controlled calculations
Therefore, dashboards clearly outperform traditional methods.
Conclusion: Why Is a Treasury Operations Dashboard in Excel Essential?
A Treasury Operations Dashboard in Excel transforms treasury management from reactive to proactive. It centralizes cash flow, interest, liquidity, and counterparty insights into a single, interactive system.
Because it works in Excel, organizations gain flexibility without heavy investment. Moreover, the dashboard improves visibility, reduces risk, and accelerates decision-making.
In today’s volatile financial environment, adopting a treasury dashboard is no longer optional. Instead, it is a strategic necessity.
Frequently Asked Questions (FAQs)
❓ What is a Treasury Operations Dashboard in Excel used for?
It tracks cash flow, liquidity, interest income, expenses, and counterparty exposure in a visual and interactive format.
❓ Can small organizations use this dashboard?
Yes. Small and medium organizations can use it effectively because it runs entirely in Excel.
❓ Does this dashboard require advanced Excel skills?
No. Users only need basic Excel knowledge to navigate slicers and charts.
❓ How often should treasury data be updated?
Ideally, treasury data should be updated daily or weekly for accurate insights.
❓ Can this dashboard handle multiple currencies?
Yes. With proper data design, it can support multi-currency analysis.
❓ Is the dashboard customizable?
Yes. Organizations can add KPIs, charts, and analysis pages based on their needs.
Visit our YouTube channel to learn step-by-step video tutorials