The esports streaming industry continues to grow at a rapid pace. Platforms such as Twitch, YouTube Gaming, and Facebook Gaming generate massive volumes of data every day. Streamers, esports organizations, and managers must track revenue, costs, viewers, and profitability to stay competitive. However, without a structured analytics system, decision-making becomes slow and inaccurate.
That is exactly where an Esports Streaming Dashboard in Excel becomes a powerful and practical solution.
In this detailed article, you will learn what an Esports Streaming Dashboard in Excel is, why it is important, how it works, its page-wise structure, key features, advantages, best practices, and frequently asked questions. Moreover, this article uses simple language, strong transitions, and active voice to ensure clarity and SEO effectiveness.
Click to Purchases Esports Streaming Dashboard in Excel
What Is an Esports Streaming Dashboard in Excel?
An Esports Streaming Dashboard in Excel is a ready-to-use analytics template designed to track and visualize esports streaming performance using Microsoft Excel.
Instead of managing multiple spreadsheets, this dashboard consolidates financial, audience, and content performance metrics into one interactive file. As a result, users can monitor costs, revenue streams, viewer engagement, and profit trends from a single dashboard.
Additionally, because the dashboard runs entirely in Excel, it remains easy to update, flexible to customize, and accessible without advanced BI tools.
Why Do Esports Streamers and Organizations Need a Dashboard?
Esports streaming performance depends on many variables such as platform choice, content type, game title, streamer tier, and audience demographics. Therefore, teams must analyze data continuously rather than rely on assumptions.
Here is why a dashboard becomes essential:
-
First, esports teams manage multiple revenue streams, including ads, subscriptions, and donations.
-
Second, managers need clear visibility into costs and profit margins.
-
Third, audience engagement metrics such as average concurrent viewers drive sponsorship value.
-
Finally, trend analysis helps teams optimize content and platform strategy.
Because of these reasons, an Esports Streaming Dashboard in Excel becomes a critical performance-tracking tool.
How Does an Esports Streaming Dashboard in Excel Work?
The dashboard follows a simple and efficient workflow.
First, users enter raw streaming data into the Data Sheet.
Next, Excel formulas and pivot tables process the data automatically.
Then, charts, KPIs, and cards update instantly across all dashboard pages.
Finally, slicers allow users to filter insights by platform, game title, region, or month.
Because of this structure, the dashboard delivers real-time insights without complex automation.
Click to Purchases Esports Streaming Dashboard in Excel
What Are the Key Features of the Esports Streaming Dashboard in Excel?
This dashboard includes several carefully designed features to support performance analysis.
Key Highlights
-
Fully Excel-based and ready to use
-
Page Navigator for quick navigation
-
Interactive slicers on each page
-
KPI cards for instant performance overview
-
Revenue, cost, and profit analysis
-
Viewer engagement tracking
-
Monthly trend analysis
Together, these features convert raw streaming data into actionable insights.
Page-Wise Structure of the Esports Streaming Dashboard in Excel
The dashboard contains five well-structured pages, each focused on a specific analytical area.
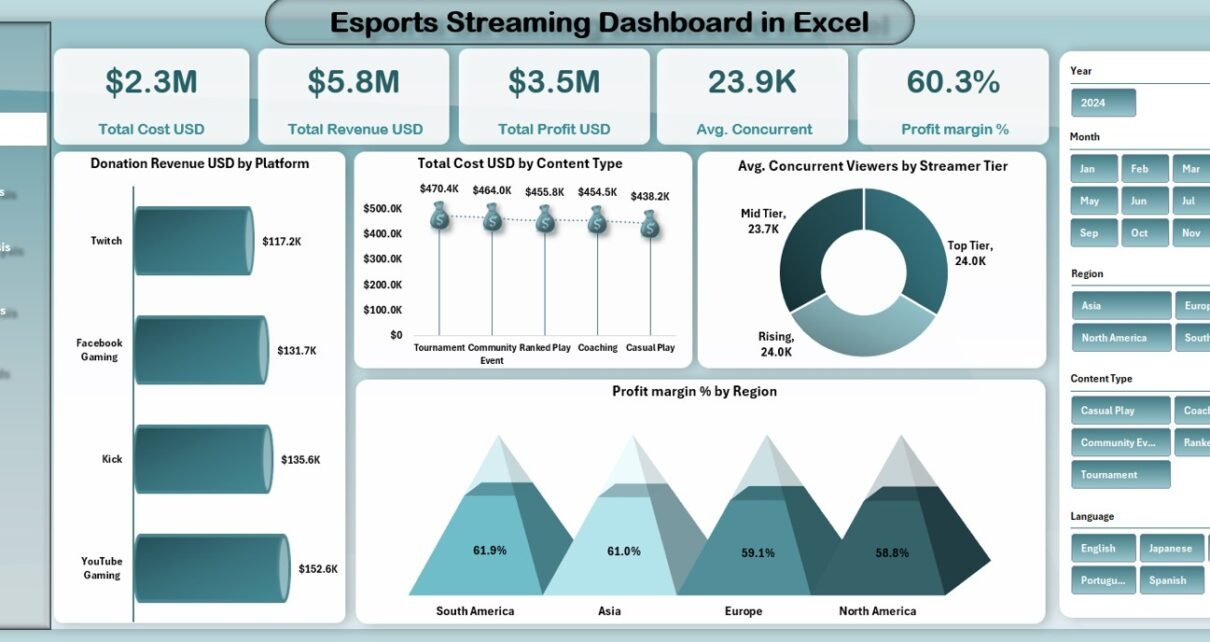
1. What Does the Overview Page Show?
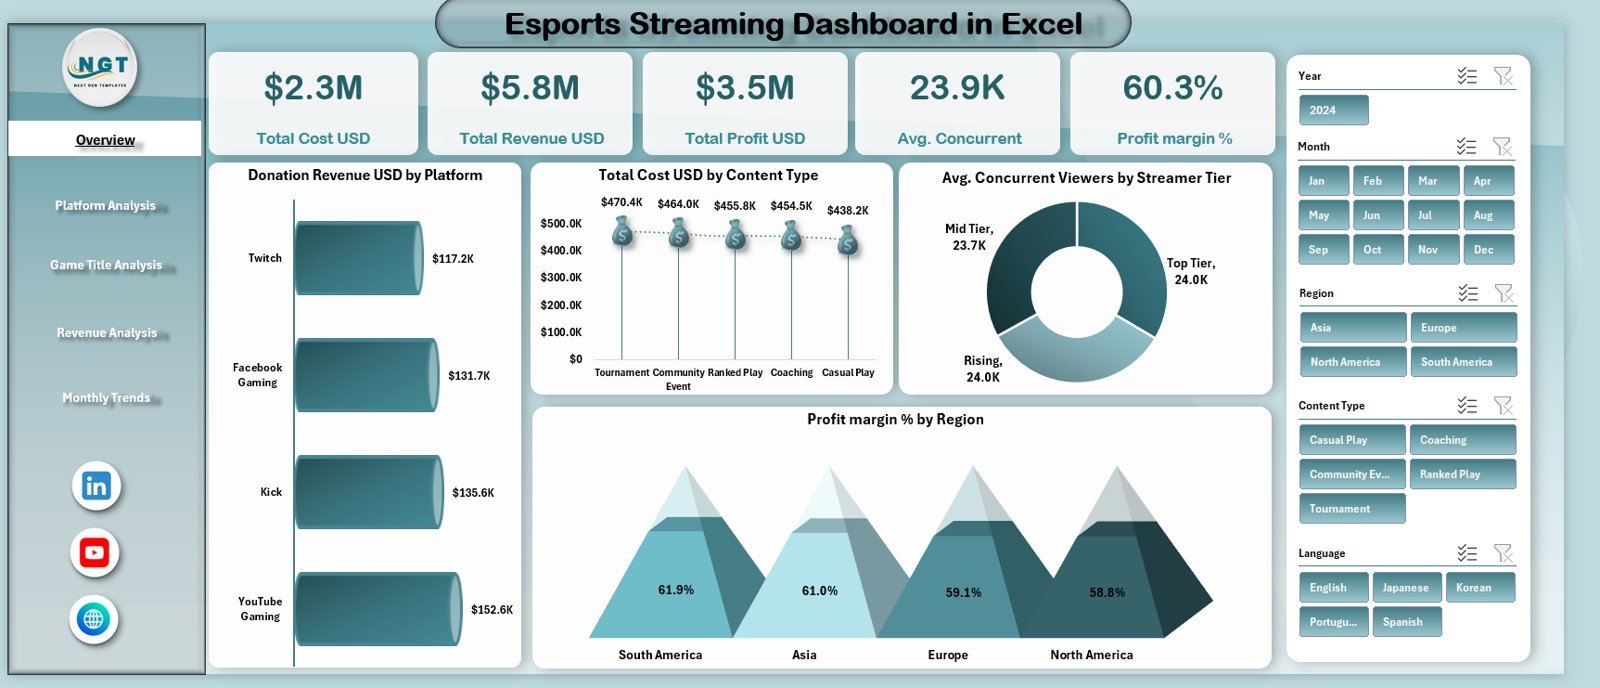
The Overview Page serves as the main summary of the entire dashboard.
Interactive Slicer
A slicer on the right side allows users to filter data dynamically across platforms, regions, or time periods.
KPI Cards for Quick Insights
This page displays five KPI cards:
-
Total Cost (USD)
-
Total Revenue (USD)
-
Total Profit (USD)
-
Average Concurrent Viewers
-
Profit Margin (%)
Because of these cards, users can quickly assess overall performance.
Charts on the Overview Page
The page also includes four key charts:
-
Donation Revenue (USD) by Platform
-
Total Cost (USD) by Content Type
-
Average Concurrent Viewers by Streamer Tier
-
Profit Margin (%) by Region
These visuals provide instant insights into profitability and audience behavior.
2. How Does the Platform Analysis Page Help?
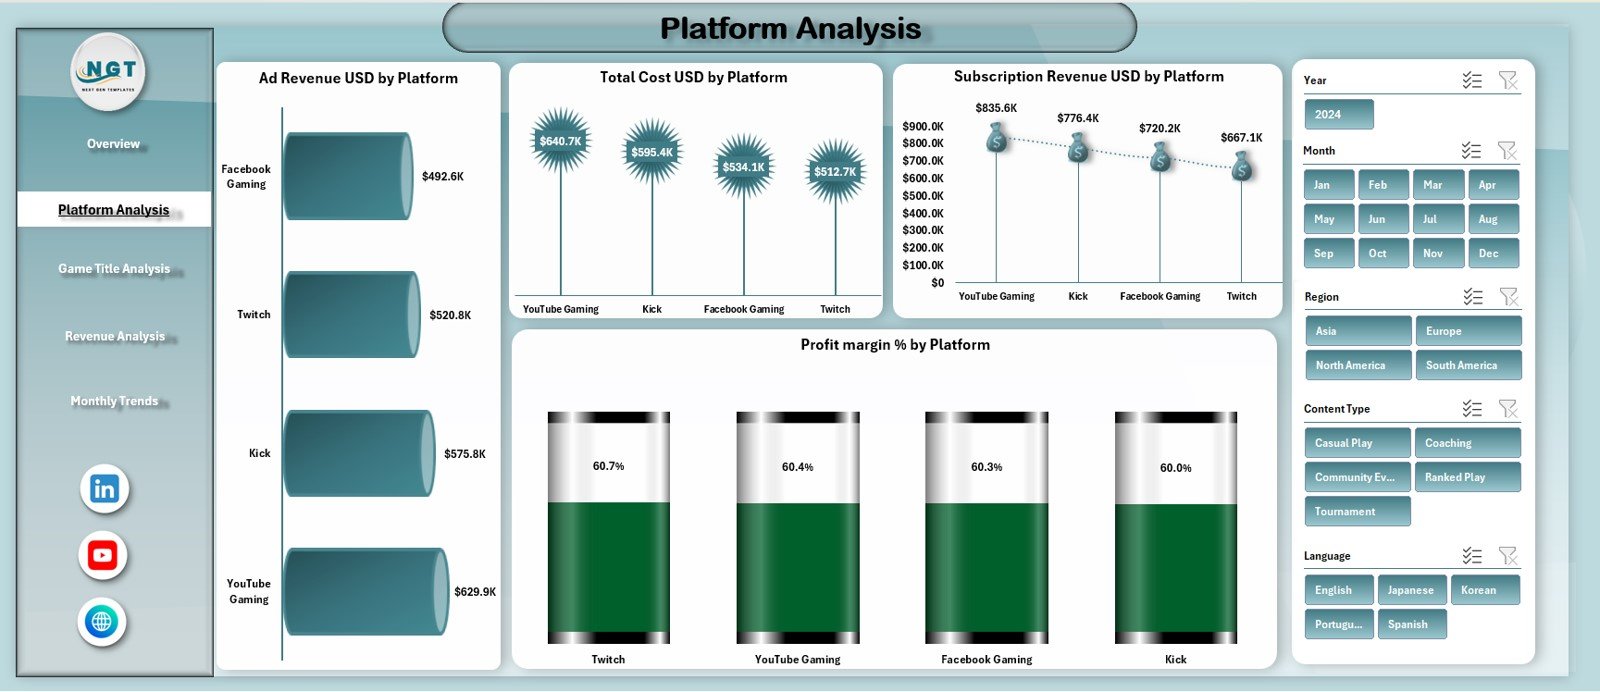
The Platform Analysis Page focuses on performance comparison across streaming platforms.
Slicer-Driven Analysis
A right-side slicer allows users to filter data dynamically.
Key Charts on This Page
-
Ad Revenue (USD) by Platform
-
Total Cost (USD) by Platform
-
Subscription Revenue (USD) by Platform
-
Profit Margin (%) by Platform
As a result, users can identify which platforms generate the highest returns.
3. What Insights Does the Game Title Analysis Page Provide?
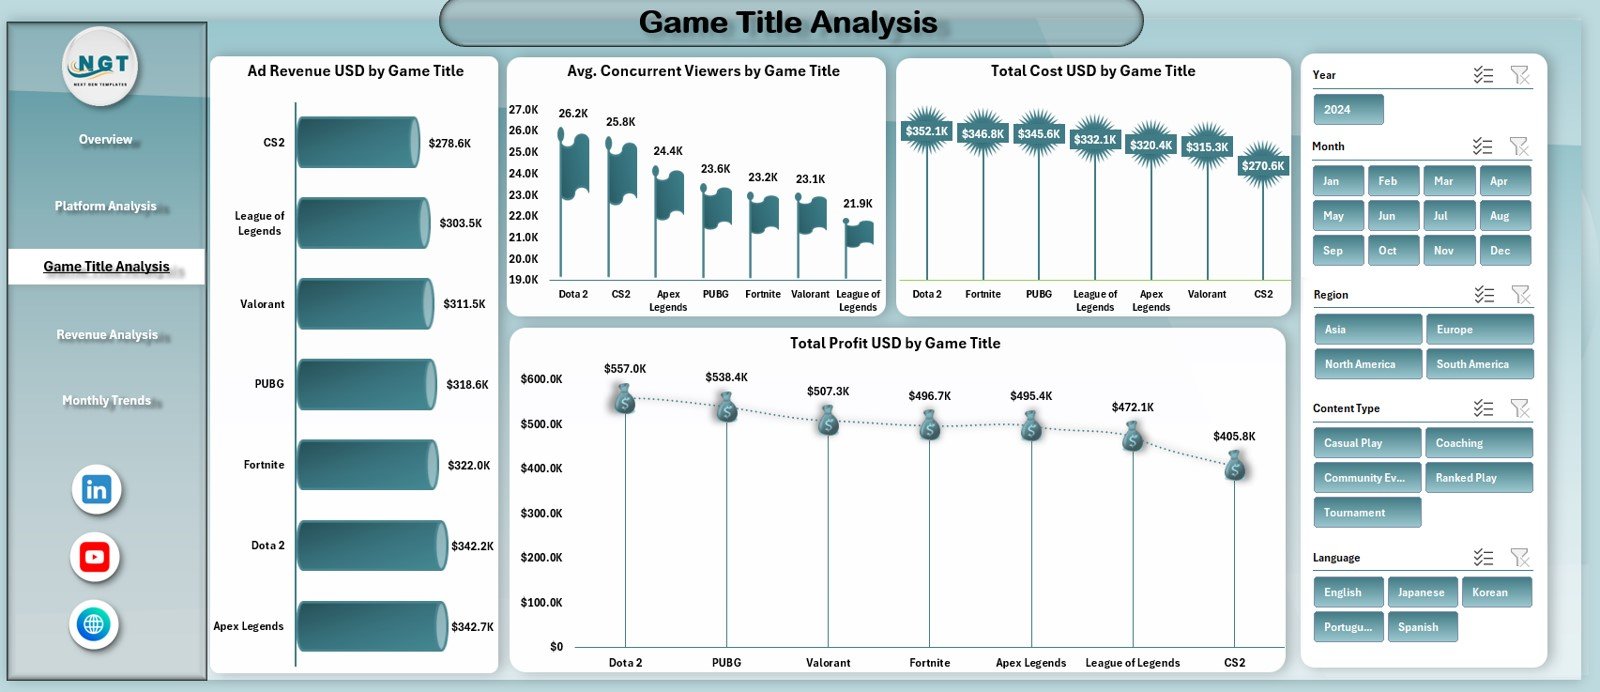
The Game Title Analysis Page highlights performance across different esports titles.
Right-Side Slicer
Users filter data by game title or category.
Charts Included
-
Ad Revenue (USD) by Game Title
-
Average Concurrent Viewers by Game Title
-
Total Cost (USD) by Game Title
-
Total Profit (USD) by Game Title
This analysis helps teams decide which games drive engagement and profitability.
4. Why Is the Revenue Analysis Page Important?
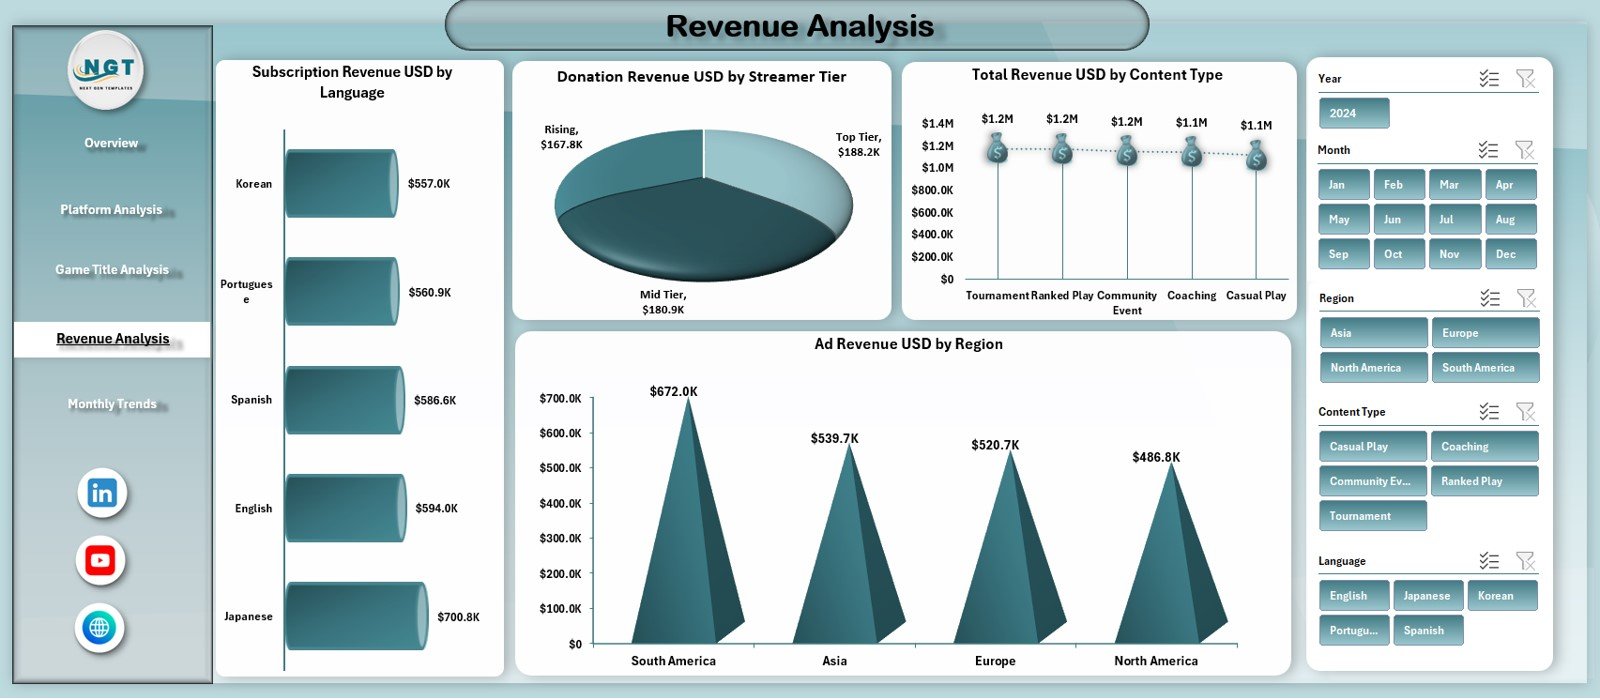
The Revenue Analysis Page focuses on revenue distribution across different dimensions.
Interactive Slicer
Users filter data dynamically using the right-side slicer.
Charts on This Page
-
Subscription Revenue (USD) by Language
-
Donation Revenue (USD) by Streamer Tier
-
Total Revenue (USD) by Content Type
-
Ad Revenue (USD) by Region
These insights help teams optimize monetization strategies.
Click to Purchases Esports Streaming Dashboard in Excel
5. How Does the Monthly Trends Page Support Planning?
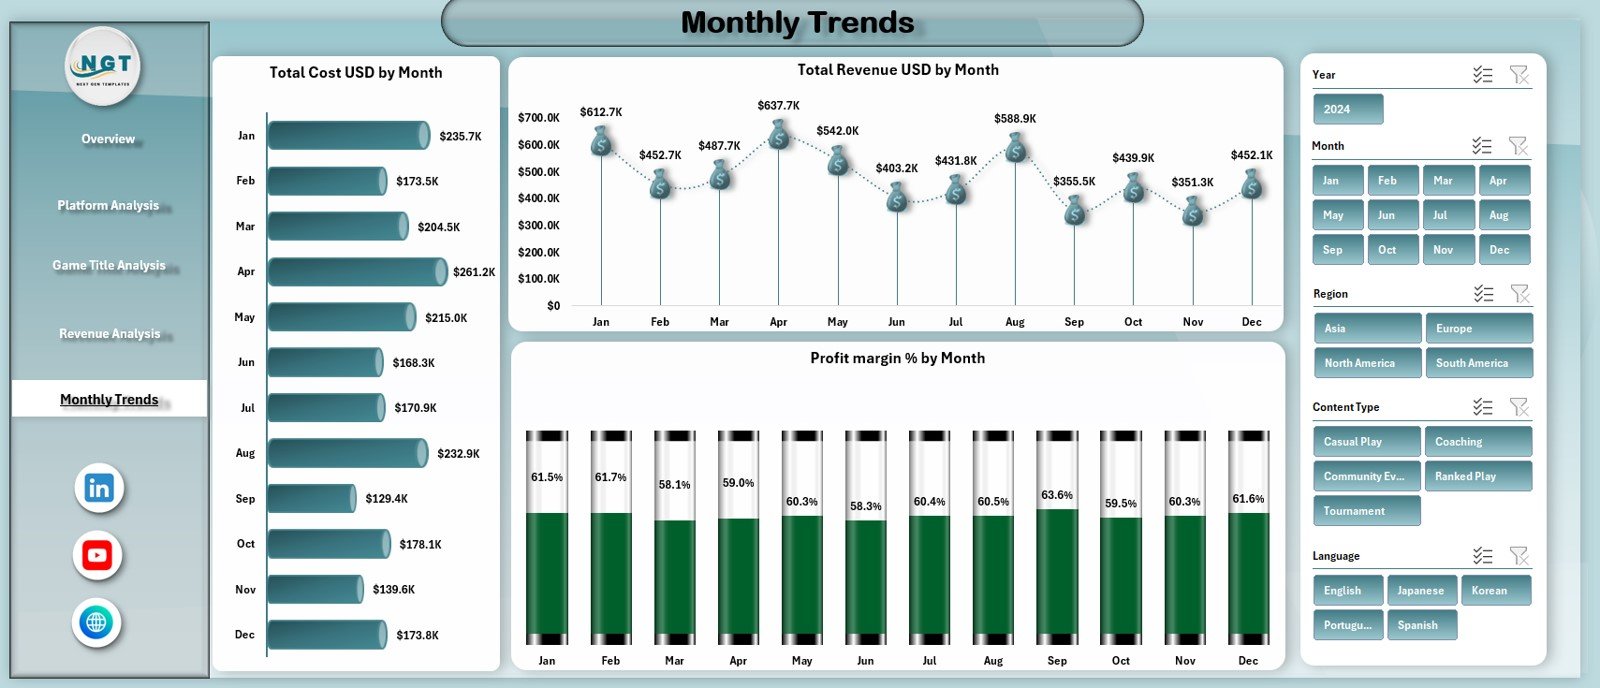
The Monthly Trends Page focuses on performance changes over time.
Right-Side Slicer
Users select months or periods easily.
Trend Charts
-
Total Cost (USD) by Month
-
Total Revenue (USD) by Month
-
Profit Margin (%) by Month
Because of these charts, users can identify seasonal patterns and growth trends.
What Are the Supporting Sheets in the Dashboard?
Data Sheet
This sheet stores all raw streaming data, including costs, revenues, viewers, platforms, games, and dates.
Support Sheet
This sheet supports calculations, lookup tables, and backend logic required for the dashboard visuals.
Advantages of Esports Streaming Dashboard in Excel
Using this dashboard delivers several business benefits.
Key Advantages
-
✔ Centralized streaming analytics
-
✔ Clear visibility into revenue and costs
-
✔ Better content and platform decisions
-
✔ Improved profit margin tracking
-
✔ Easy Excel-based customization
-
✔ No dependency on advanced BI tools
Because of these advantages, esports teams gain better control over performance.
How Does This Dashboard Improve Esports Decision-Making?
This dashboard helps teams:
-
Optimize content strategy
-
Select high-performing platforms
-
Improve monetization models
-
Track viewer engagement trends
-
Control operational costs
As a result, decisions become data-driven instead of assumption-based.
Click to Purchases Esports Streaming Dashboard in Excel
Best Practices for the Esports Streaming Dashboard in Excel
Follow these best practices to maximize dashboard value.
1. Keep Data Updated
Update streaming data regularly to ensure accuracy.
2. Use Consistent Categories
Maintain consistent naming for platforms, games, and regions.
3. Monitor Trends Monthly
Review monthly trends to identify growth opportunities.
4. Focus on Profitability
Track profit margin along with revenue.
5. Train Users
Ensure users understand KPI meanings and chart interpretations.
Conclusion
An Esports Streaming Dashboard in Excel transforms complex streaming data into clear, actionable insights. By combining interactive slicers, KPI cards, and detailed charts, this dashboard empowers streamers and esports organizations to monitor performance, improve profitability, and plan future growth effectively.
In a fast-paced esports ecosystem, this dashboard becomes an essential tool for sustainable success.
Click to Purchases Esports Streaming Dashboard in Excel
Frequently Asked Questions (FAQs)
What is an Esports Streaming Dashboard in Excel?
It is an Excel-based dashboard that tracks esports streaming performance, revenue, costs, and viewer engagement.
Can I customize the dashboard?
Yes, you can easily modify charts, KPIs, and slicers.
Does it support multiple platforms?
Yes, it analyzes performance across different streaming platforms.
Can beginners use this dashboard?
Yes, it works with basic Excel knowledge.
Does the dashboard track profit margin?
Yes, profit margin (%) appears across multiple pages.
Is this dashboard suitable for esports organizations?
Yes, it works for individual streamers and large esports teams.
Click to Purchases Esports Streaming Dashboard in Excel
Visit our YouTube channel to learn step-by-step video tutorials