Trucking companies operate in a highly competitive and cost-sensitive environment. Fuel prices fluctuate, maintenance costs rise, delivery delays impact customer satisfaction, and profit margins remain under constant pressure. Therefore, trucking businesses need accurate data, clear visibility, and fast decision-making.
That is exactly why a Trucking Companies Dashboard in Power BI becomes a powerful and essential analytics tool.
In this detailed article, you will learn what a Trucking Companies Dashboard in Power BI is, why trucking businesses need it, how it works, page-wise dashboard structure, key KPIs, advantages, best practices, and frequently asked questions. Moreover, the article uses clear language, strong transitions, and practical explanations to ensure both usability and SEO effectiveness.
Click to Purchases Trucking Companies Dashboard in Power BI
What Is a Trucking Companies Dashboard in Power BI?
A Trucking Companies Dashboard in Power BI is an interactive, data-driven reporting solution designed to monitor and analyze trucking operations in real time.
Instead of managing multiple spreadsheets for fuel, shipments, drivers, maintenance, and revenue, this dashboard consolidates everything into a single Power BI file. As a result, operations managers, fleet managers, and executives gain instant insights into performance, costs, and trends.
Moreover, because the dashboard uses Power BI’s interactive visuals and slicers, users can drill down into details quickly and confidently.
Why Do Trucking Companies Need a Power BI Dashboard?
Trucking operations generate massive amounts of data every day. Fuel consumption, driver performance, delivery times, maintenance expenses, and shipment revenue all impact profitability. Therefore, manual reporting becomes slow, inconsistent, and error-prone.
A Trucking Companies Dashboard in Power BI solves these challenges effectively.
Key reasons trucking companies need this dashboard:
-
Rising fuel and maintenance costs
-
Increasing pressure to reduce delivery delays
-
Need to track driver-level performance
-
Difficulty in analyzing destination-wise profitability
-
Lack of visibility into monthly trends
As a result, this dashboard acts as a single source of truth for trucking performance.
Click to Purchases Trucking Companies Dashboard in Power BI
How Does the Trucking Companies Dashboard in Power BI Work?
The dashboard follows a simple and structured analytical workflow.
First, trucking data is captured from operational systems or Excel files. Then, Power BI transforms this data into KPIs, cards, charts, and trends using a clean data model.
Overall workflow:
-
Load trucking data into Power BI
-
Apply slicers to filter insights
-
Review KPIs and summary cards
-
Analyze costs, shipments, and drivers
-
Track trends and profitability
Because of this approach, teams spend less time preparing reports and more time improving operations.
Page-Wise Structure of the Trucking Companies Dashboard in Power BI
This dashboard contains 5 analytical pages, each focused on a specific business area.
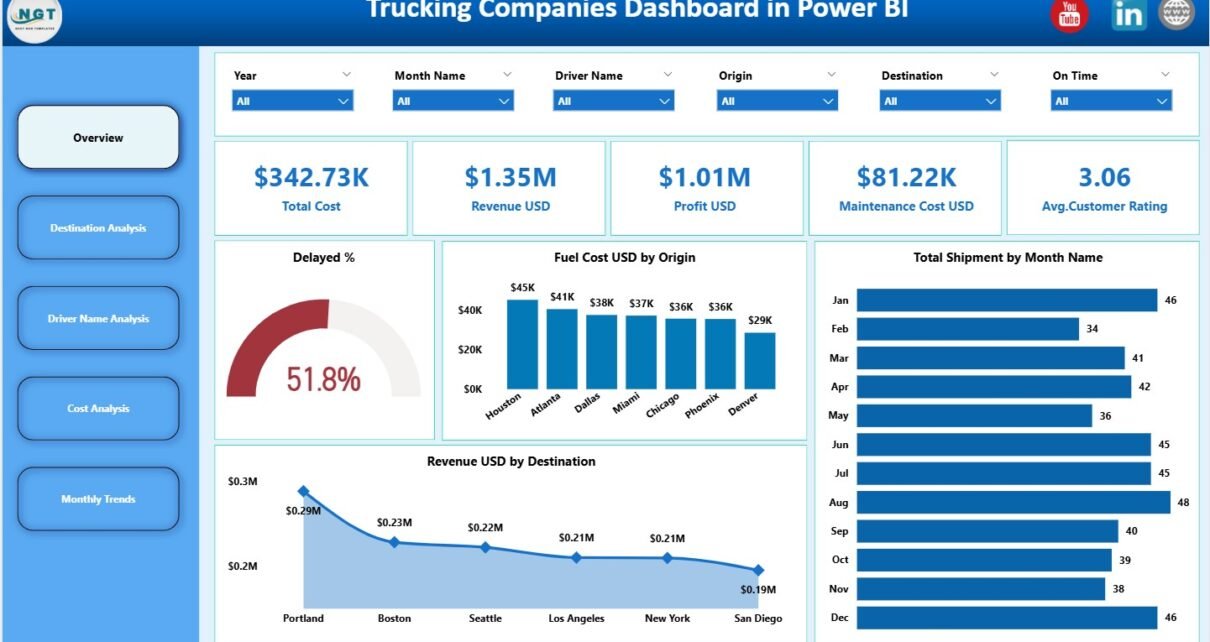
1) Overview Page: The Complete Business Snapshot
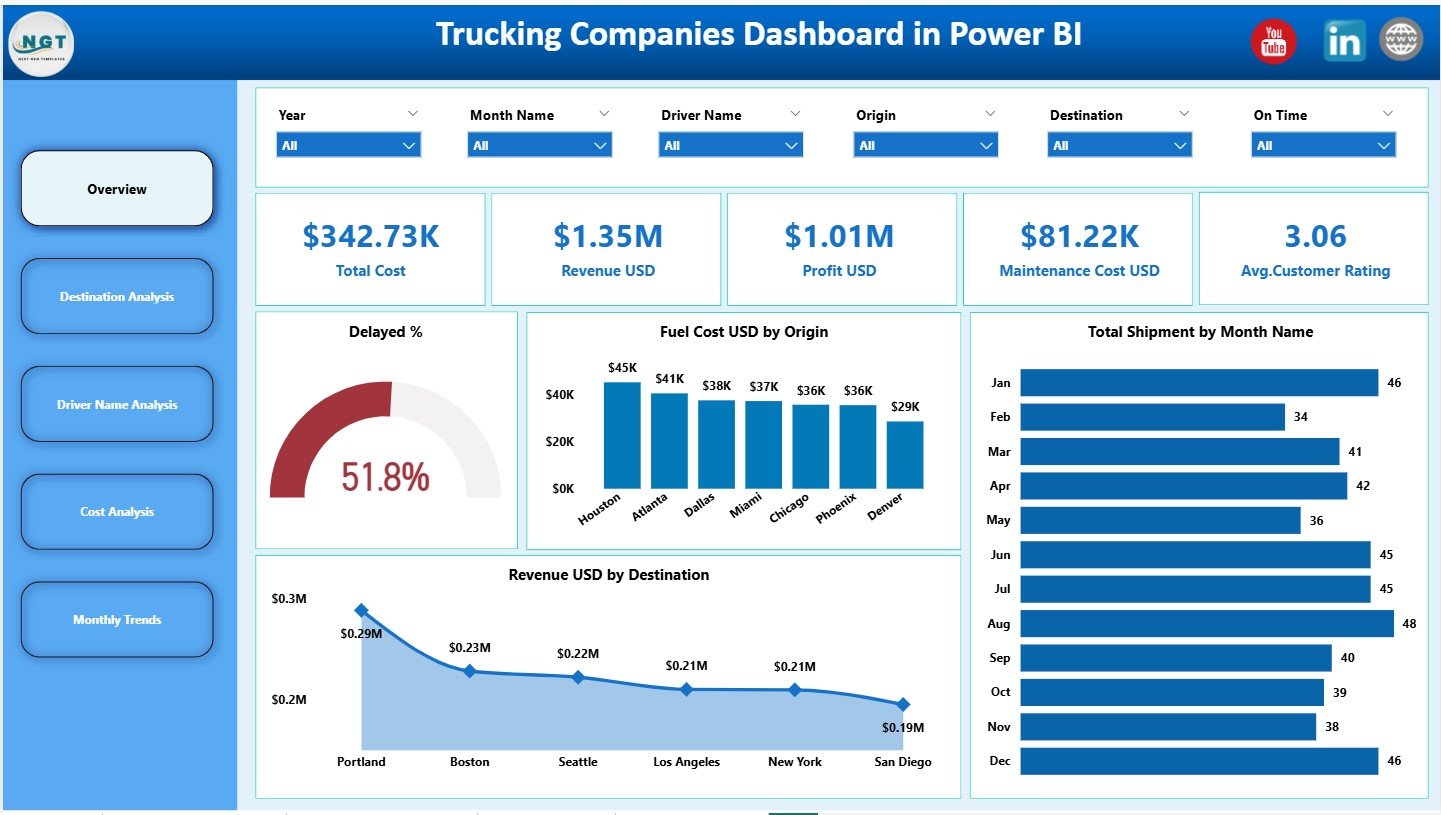
The Overview Page acts as the executive summary of the dashboard.
Slicers on the Overview Page
Slicers allow users to filter data easily by time, destination, driver, or other dimensions. As a result, insights become faster and more focused.
KPI Cards on the Overview Page
The dashboard displays five KPI cards that provide an instant overview of business health:
-
Total Cost
-
Revenue (USD)
-
Profit (USD)
-
Maintenance Cost (USD)
-
Average Customer Rating
These KPIs help decision-makers understand financial performance and service quality at a glance.
Charts on the Overview Page
The Overview Page also includes four key charts:
-
Delayed Percentage (%)
-
Fuel Cost (USD)
-
Total Shipments by Month
-
Revenue (USD) by Destination
Together, these visuals show how efficiently the company operates and where improvements are needed.
Click to Purchases Trucking Companies Dashboard in Power BI
2) Destination Analysis Page: Which Routes Perform Best?
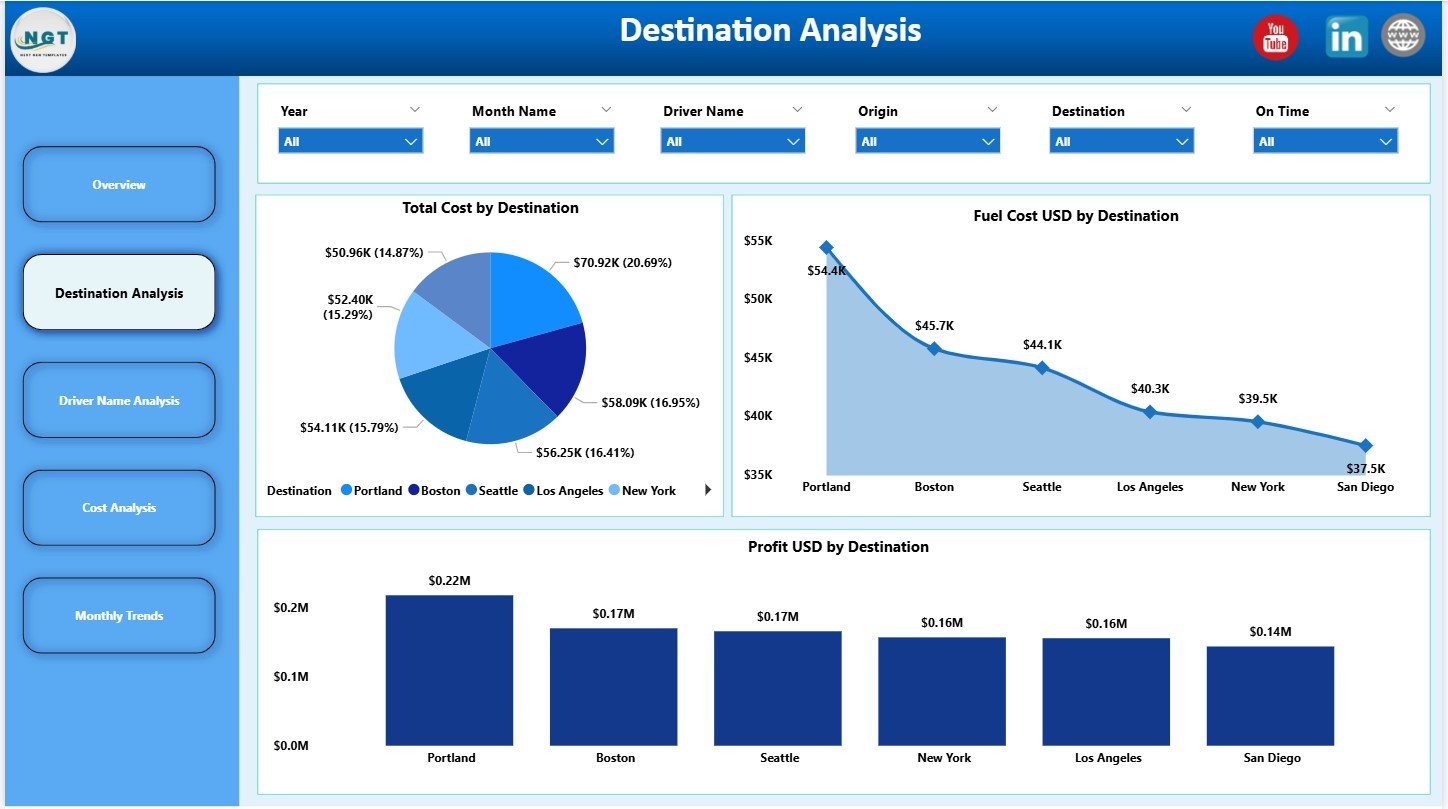
The Destination Analysis Page focuses on location-wise performance.
Slicers
Slicers allow users to filter destinations quickly.
Charts on the Destination Analysis Page
This page includes three insightful charts:
-
Total Cost by Destination
-
Fuel Cost (USD) by Destination
-
Profit (USD) by Destination
As a result, managers can identify:
-
High-cost routes
-
Profitable destinations
-
Fuel-intensive locations
This analysis supports better route planning and pricing decisions.
3) Driver Name Analysis Page: How Are Drivers Performing?
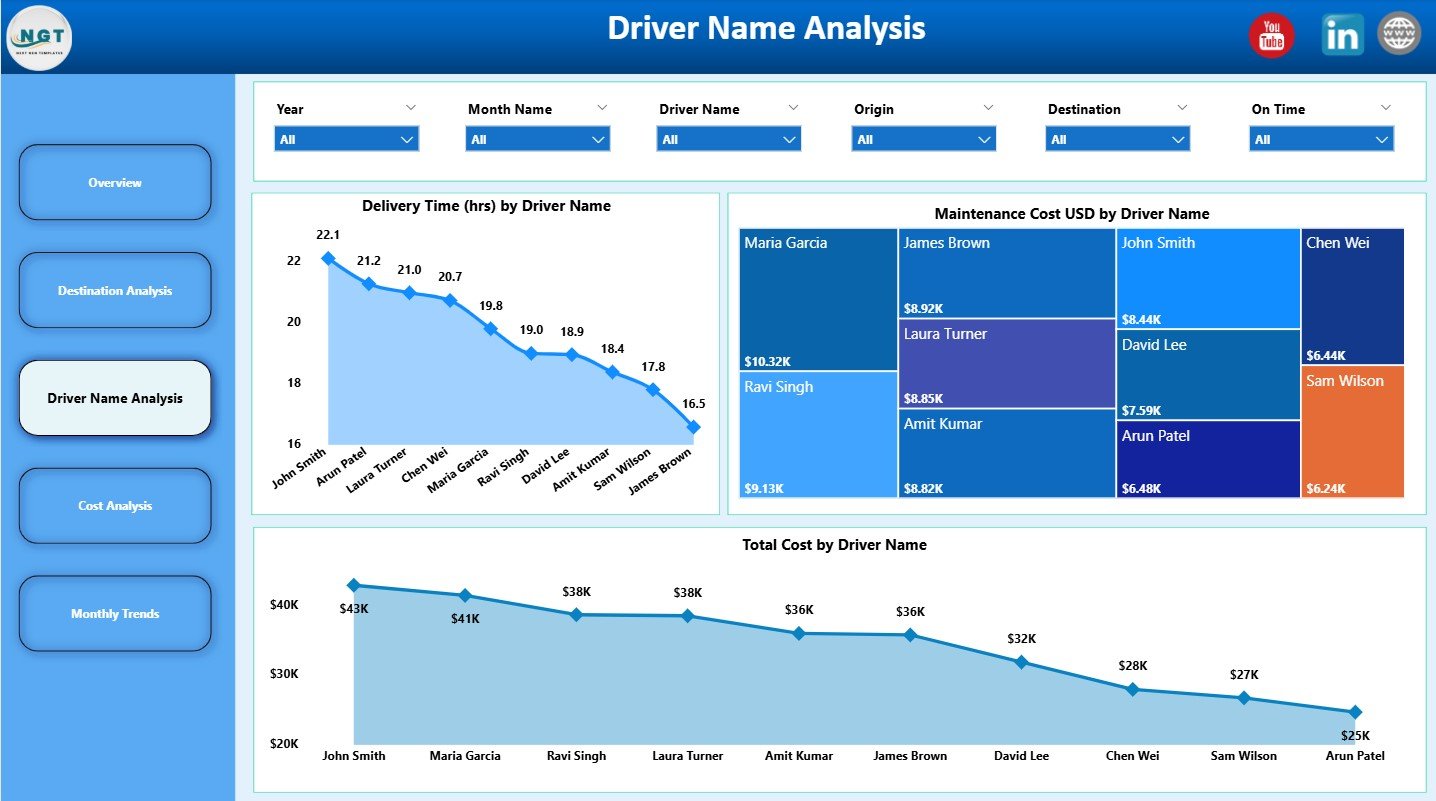
The Driver Name Analysis Page evaluates performance at the driver level.
Slicers
Users can filter data by driver name and time period.
Charts on the Driver Analysis Page
This page displays three driver-focused charts:
-
Delivery Time (Hours) by Driver Name
-
Maintenance Cost (USD) by Driver Name
-
Total Cost by Driver Name
These insights help:
-
Identify high-performing drivers
-
Detect training or efficiency gaps
-
Control driver-related costs
4) Cost Analysis Page: Where Is the Money Going?
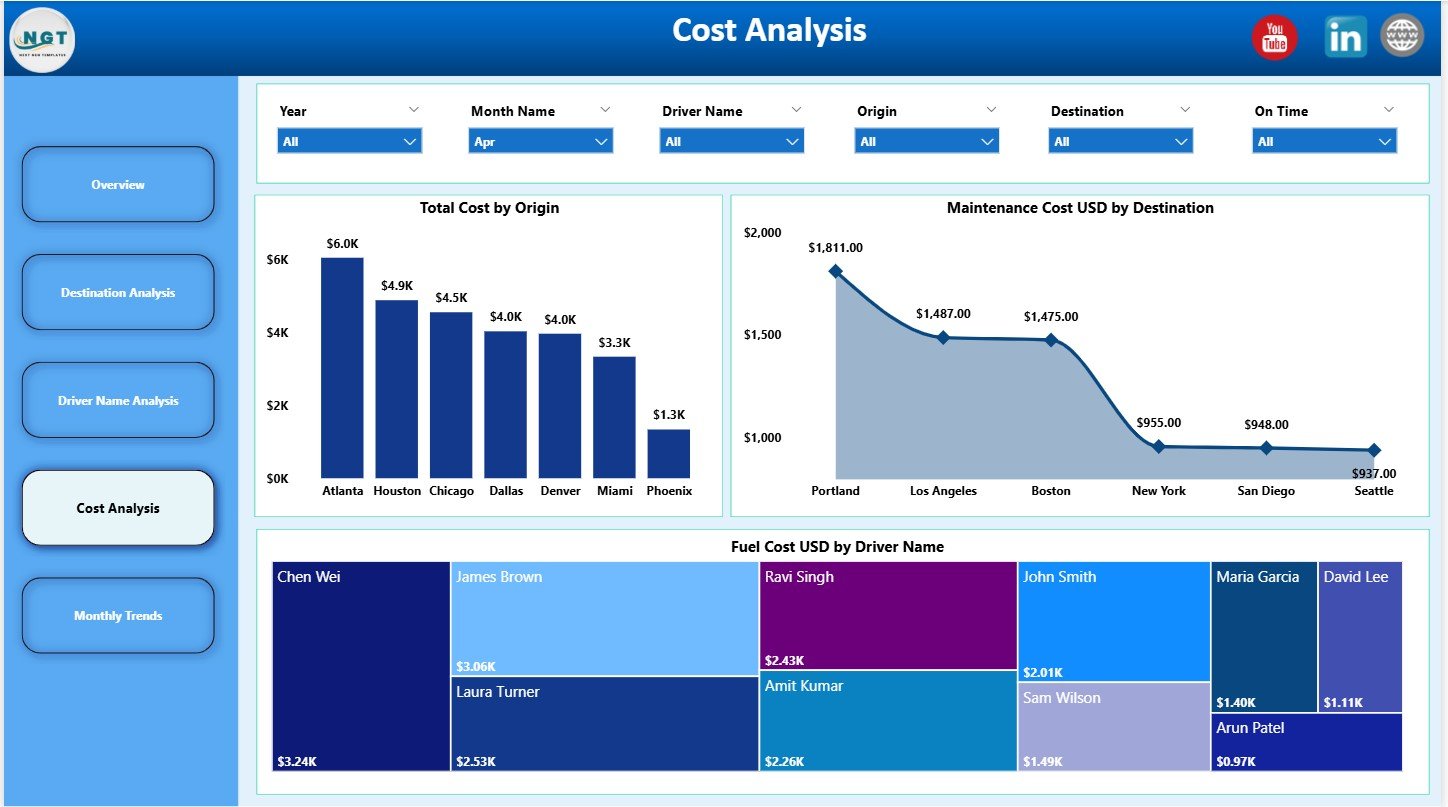
The Cost Analysis Page focuses on expense breakdown and cost drivers.
Slicers
Slicers enable flexible cost analysis by origin, destination, or driver.
Charts on the Cost Analysis Page
This page includes three cost-focused charts:
-
Total Cost by Origin
-
Maintenance Cost (USD) by Destination
-
Fuel Cost (USD) by Driver Name
As a result, finance and operations teams gain better cost visibility and control.
Click to Purchases Trucking Companies Dashboard in Power BI
5) Monthly Trends Page: How Does Performance Change Over Time?
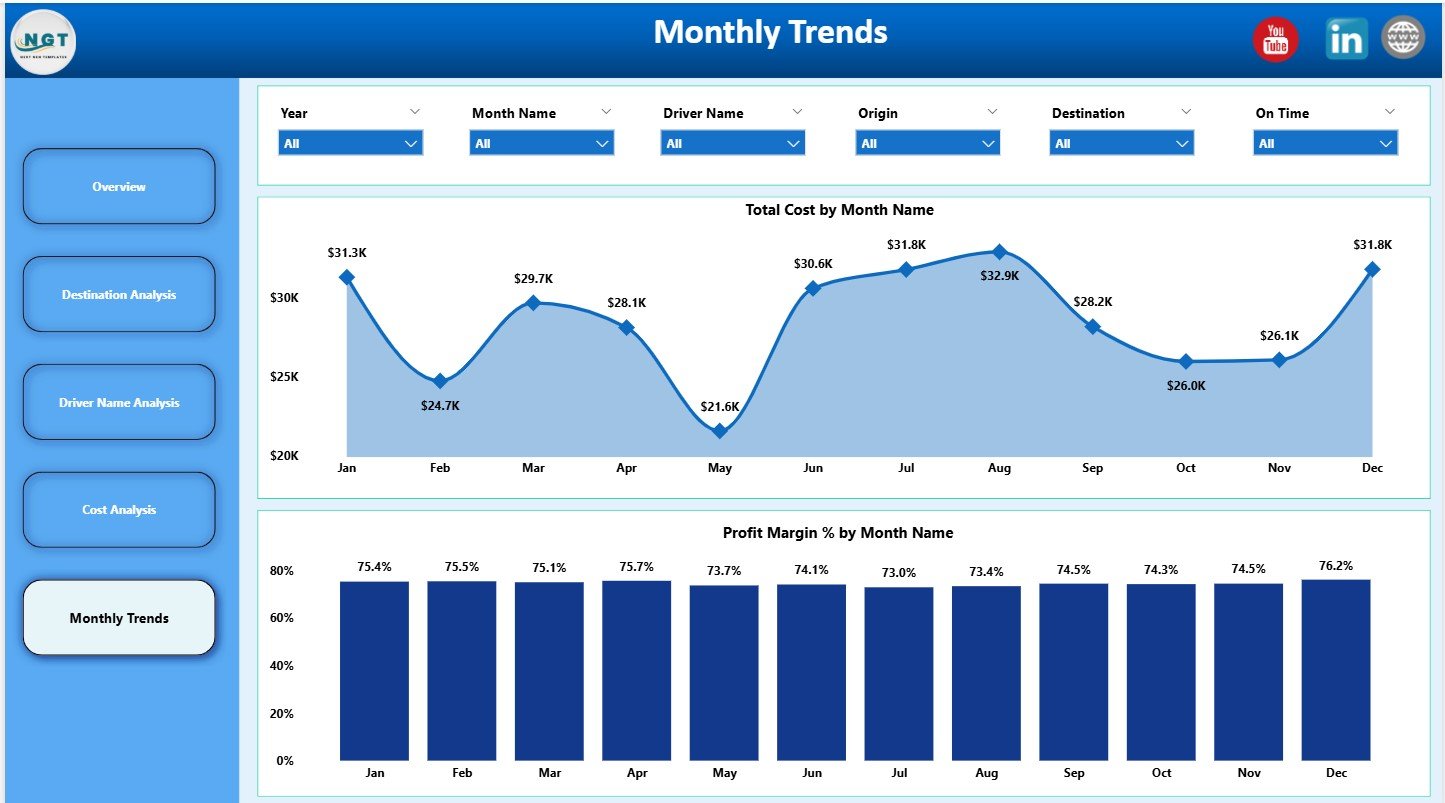
The Monthly Trends Page highlights time-based performance patterns.
Slicers
Users can filter by month or year for trend analysis.
Charts on the Monthly Trends Page
This page includes two trend charts:
-
Total Cost by Month
-
Profit Margin (%) by Month
These charts help track:
-
Cost inflation
-
Profitability changes
-
Seasonal patterns
Key KPIs Tracked in the Trucking Companies Dashboard
The dashboard tracks essential KPIs such as:
-
Total Cost
-
Revenue and Profit
-
Fuel Cost
-
Maintenance Cost
-
Delivery Delay Percentage
-
Total Shipments
-
Profit Margin (%)
-
Average Customer Rating
Together, these KPIs provide a complete operational and financial view.
Advantages of Trucking Companies Dashboard in Power BI
Using this dashboard delivers measurable benefits.
Key Advantages
🚚 Centralized trucking performance tracking
🚚 Real-time visibility into costs and revenue
🚚 Improved driver performance monitoring
🚚 Better fuel and maintenance cost control
🚚 Faster, data-driven decisions
🚚 Interactive and user-friendly visuals
🚚 Professional reporting for leadership
As a result, trucking companies gain stronger operational control.
How Does This Dashboard Improve Decision-Making?
The dashboard converts raw trucking data into actionable insights.
Decision-Making Benefits
-
Identify cost leakage early
-
Improve route and destination planning
-
Optimize driver utilization
-
Reduce delivery delays
-
Increase profitability and customer satisfaction
Therefore, management moves from reactive reporting to proactive optimization.
Best Practices for Using the Trucking Companies Dashboard in Power BI
To maximize value, follow these best practices.
Data Management Best Practices
-
Update data regularly
-
Validate fuel and maintenance costs
-
Keep destination and driver names consistent
-
Remove duplicate records
Dashboard Usage Best Practices
-
Review Overview KPIs daily or weekly
-
Analyze destination profitability monthly
-
Monitor driver performance consistently
-
Track trends before making strategic changes
Governance Best Practices
-
Standardize KPI definitions
-
Control dashboard access
-
Document data sources clearly
-
Train users on interpretation
Following these practices ensures long-term success.
Click to Purchases Trucking Companies Dashboard in Power BI
Who Should Use a Trucking Companies Dashboard in Power BI?
This dashboard benefits multiple stakeholders.
Ideal Users
-
Trucking Company Owners
-
Fleet Managers
-
Operations Managers
-
Finance Teams
-
Logistics Analysts
-
Senior Executives
Each user gains insights without technical complexity.
Conclusion: Why Is a Trucking Companies Dashboard in Power BI Essential?
A Trucking Companies Dashboard in Power BI provides complete visibility into costs, shipments, drivers, and profitability.
Instead of relying on delayed reports and manual spreadsheets, this dashboard delivers real-time insights through interactive visuals and KPIs. Moreover, it helps trucking companies reduce costs, improve efficiency, and increase profit margins.
Therefore, if your goal is to run a smarter, more profitable trucking operation, this dashboard becomes an essential tool.
Frequently Asked Questions (FAQs)
What is a Trucking Companies Dashboard in Power BI used for?
It helps track costs, revenue, shipments, driver performance, and trends in one interactive dashboard.
Do I need advanced Power BI skills to use this dashboard?
No. Basic Power BI knowledge is enough to filter and analyze insights.
Can I customize KPIs and charts?
Yes. You can modify KPIs, visuals, and slicers based on business needs.
How often should the data be updated?
You should update data daily, weekly, or monthly depending on operations.
Is this dashboard suitable for small and large trucking companies?
Yes. The structure supports small fleets as well as large trucking enterprises.
Click to Purchases Trucking Companies Dashboard in Power BI
Visit our YouTube channel to learn step-by-step video tutorials